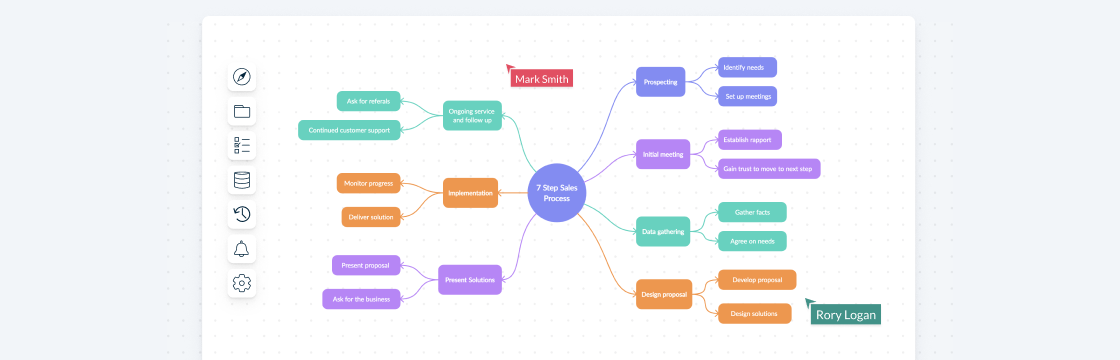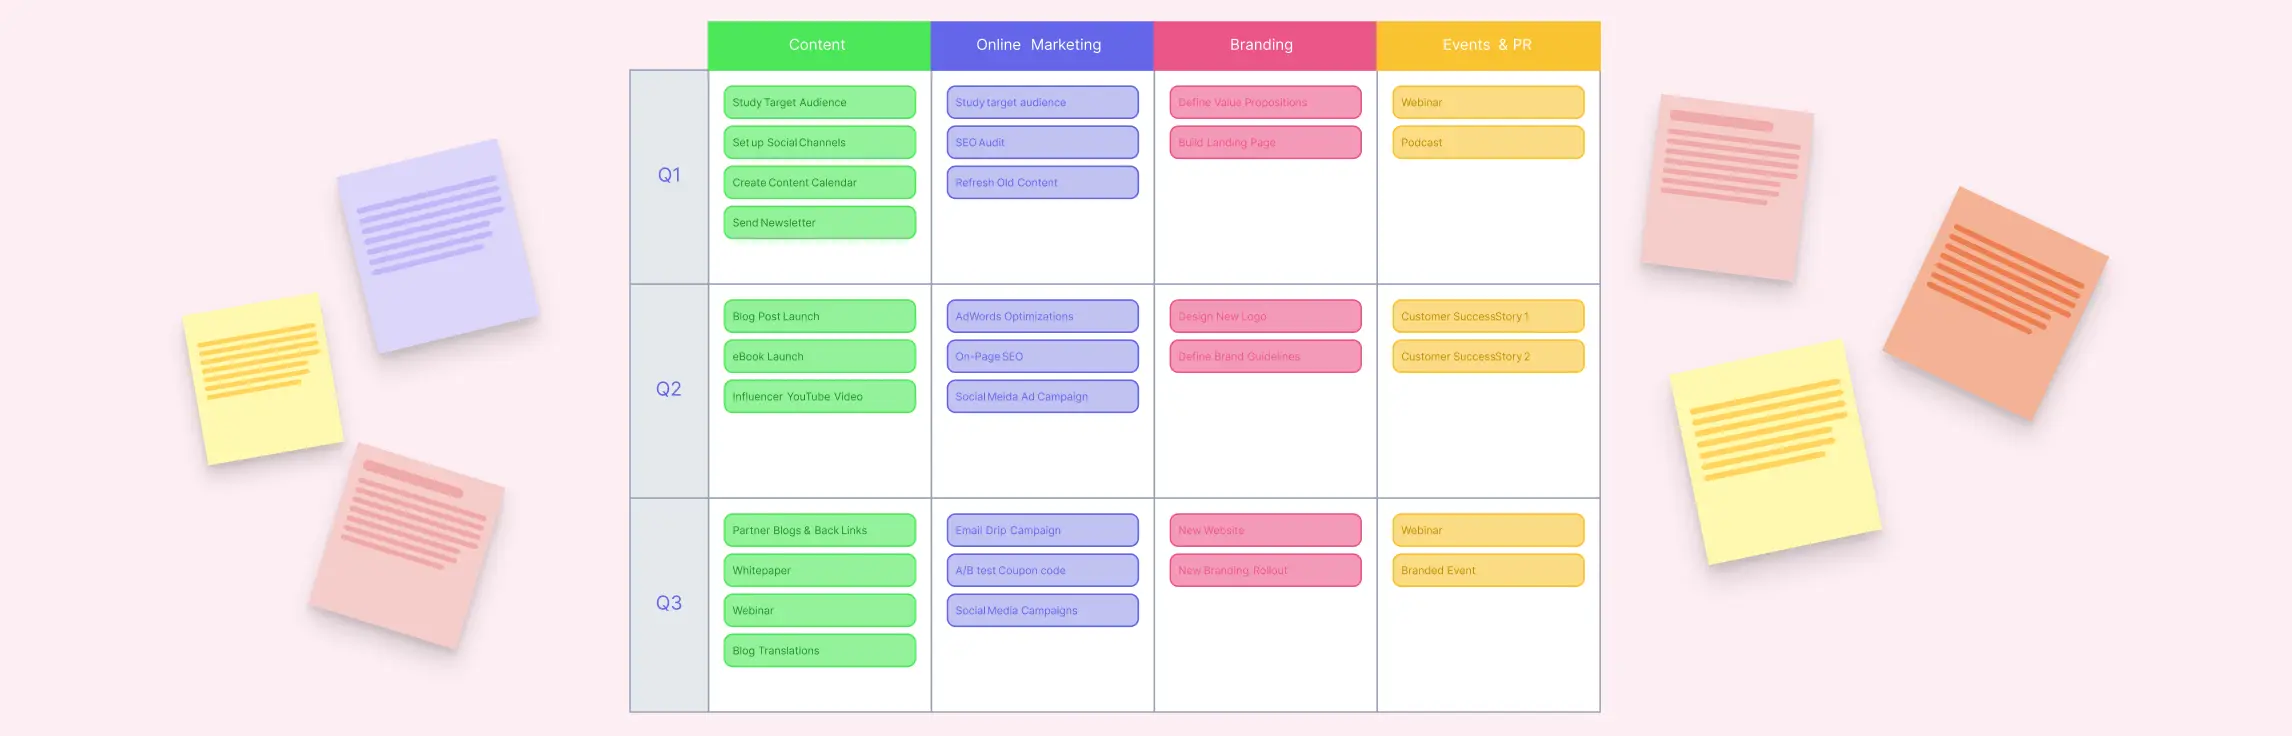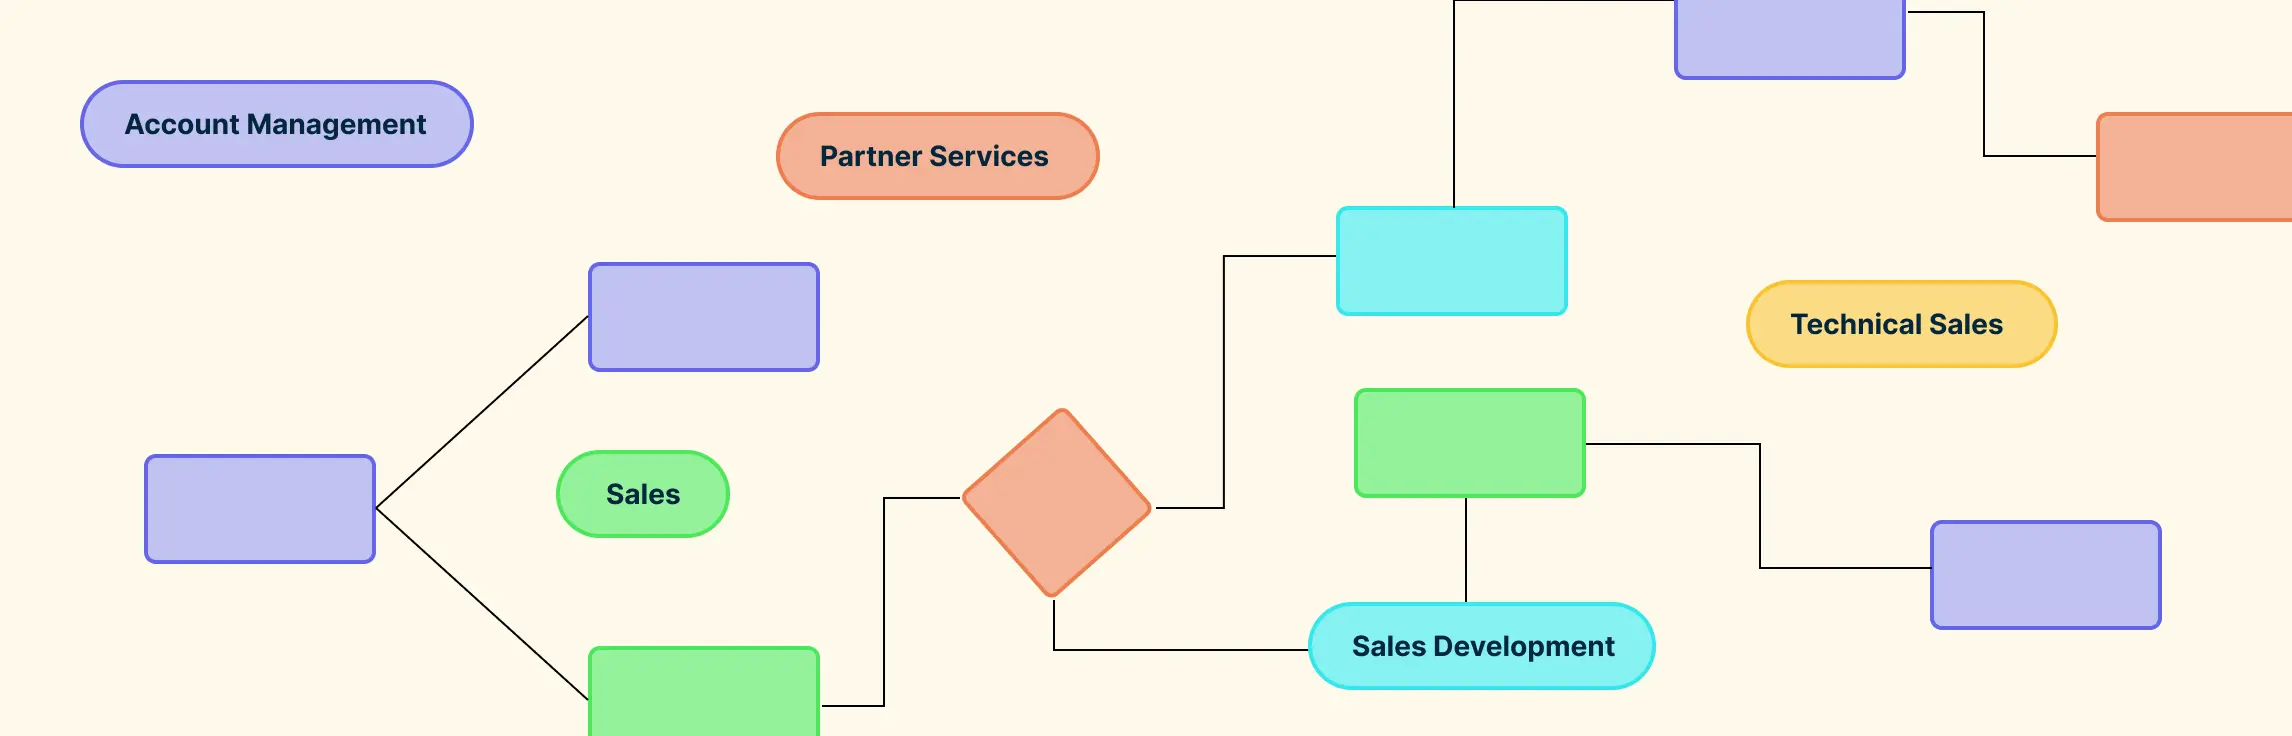
When sales stages, responsibilities, and handoffs are unclear, leads can stall and teams may apply the process inconsistently. Sales process mapping makes the workflow visible from lead generation through closing, including the decisions, roles, systems, and customer touchpoints involved. This guide explains what a sales process map is, how to create one, which mapping methods to use, and how to keep the map useful as your sales process evolves.
What Is Sales Process Mapping?
A sales process map is a visual representation of the activities a sales team uses to move a prospective customer through the sales cycle. Unlike a simple list of steps, it shows how stages connect, where decisions and exceptions occur, and which roles own activities and handoffs. It provides a shared blueprint for understanding how the sales workflow operates.
The difference between documenting sales steps and sales process mapping is all about perspective. While a checklist tells you what needs to be done, a sales process map reveals how everything flows together, highlighting bottlenecks, inefficiencies, and opportunities for improvement.
How Can a Sales Process Map Help?
A sales process map is more than just a diagram. It’s a strategic tool that brings clarity, efficiency, and alignment to your sales team. By visualizing your entire sales workflow, you can see how leads move through each stage, spot bottlenecks, and identify opportunities for improvement.
- Clarity and understanding: Teams instantly know the steps, roles, and touchpoints involved in closing a deal.
- Faster onboarding: New hires can quickly grasp your workflow without relying solely on verbal instructions or manuals.
- Consistency and standardization: A documented sales process ensures every team member follows the same procedures, reducing errors and missed opportunities.
- More consistent forecasting inputs: Clearly defined stages and exit criteria help teams interpret pipeline data consistently. Forecast quality still depends on accurate CRM data and an appropriate forecasting method.
- Process optimization: Visual maps make it simple to identify inefficiencies, redundancies, or gaps in your workflow.
- Enhanced collaboration: Everyone can see who is responsible for each step, encouraging accountability and teamwork.
By creating a sales process map, teams gain a shared blueprint for discussing how work currently happens and where it could improve. A collaborative process mapping tool such as Creately also helps teams keep owners, handoffs, supporting context, and feedback connected to the map as the sales process changes.
Key Components of an Effective Sales Process Map
To create a sales process map that truly drives results, focus on these critical elements:
Clearly Defined Sales Stages: Outline your main sales funnel stages—lead generation, prospecting, qualification, proposal, negotiation, and closing. Visual mapping of stages helps teams track deals and spot bottlenecks.
Key Activities and Tasks: List critical tasks within each stage, like outreach, follow-ups, or lead research. A sales process map shows how steps flow together, ensuring nothing is missed.
Roles and Responsibilities: Assign ownership for every step. Visualizing roles increases accountability and reduces confusion, empowering teams to act confidently.
Decision Points and Approvals: Highlight points where decisions are needed, such as lead qualification or managerial approval, to speed up workflows and reduce delays.
Metrics and KPIs: Include indicators like conversion rates or average deal time. Metrics make your map actionable, helping teams optimize stages and improve results.
Tools and Systems: Show where CRM records, automation, communication tools, and other systems are used. Documenting these touchpoints helps teams understand where information originates, where it moves, and which system supports each activity.
How to Map a Sales Process
Creating a sales process map doesn’t have to be complicated. By breaking your workflow into clear, actionable steps, you can design a map that brings clarity, efficiency, and alignment to your sales team.
Step 1. Identify the Stages of Your Sales Process
Start by outlining the key stages in your sales funnel, such as:
- Lead generation: Attracting potential customers
- Lead qualification: Determining which leads are worth pursuing
- Initial contact: Reaching out to leads for the first time
- Proposal: Presenting your solution or offer
- Negotiation: Addressing objections and finalizing terms
- Closing: Converting the lead into a customer
Defining these stages visually helps your team track deals and spot bottlenecks quickly.
Step 2. Define Key Decision Points
Identify critical decisions that guide the flow of your sales process, including:
- Is the lead qualified? – Decide whether to continue pursuing the lead
- Did the prospect agree to the proposal? – Determine if the deal moves forward or requires follow-up
Mapping decision points and their criteria helps sales representatives make more consistent choices and exposes paths that may create unnecessary delays.
Step 3. Map Your Customer Journey
Visualize the steps your customer takes from first contact to purchase. Include all touchpoints, interactions, and possible paths. This helps your team understand the customer experience and tailor communications effectively.
Step 4. Create a Basic Sales Process
Combine stages, tasks, roles, and decision points into a simple visual map. Keep it readable and focused on key elements. A basic map serves as the foundation for optimization and team alignment.
Step 5. Set Your Performance Metrics
Choose measurable indicators that correspond to the mapped stages, such as stage conversion rate, average time in stage, response time, and win rate. Establish each metric’s definition and data source so the team can compare performance consistently and use the findings to guide improvements.
Step 6. Document Everything
Document the stages, decision criteria, owners, handoffs, exceptions, and systems needed to carry out the process. Connect relevant notes, links, files, and instructions to the map, then identify who is accountable for keeping it current. This turns the sales process map into living documentation that can support onboarding and day-to-day reference.
Tips for Optimizing Your Sales Process Map
A sales process map is only as effective as the effort you put into refining it. Here are actionable tips to make your maps work harder for your team:
Keep it simple and readable: Avoid clutter by focusing on key stages, touchpoints, and decision points. A clean, easy-to-follow sales process map ensures your team can quickly understand and act on the workflow.
Update regularly based on evidence: Review conversion rates, time in stage, customer feedback, and recurring exceptions. Use the findings to test changes and address bottlenecks, and update the map when the working process changes.
Make reviews collaborative: Invite the people who perform and receive the work to comment on stages, decisions, and handoffs. Record agreed changes, assign an accountable owner to maintain the map, and use version history to revisit earlier process documentation when needed.
Experiment and iterate: Every sales process evolves. Test new approaches, tweak stages, and refine touchpoints in Creately. Iteration keeps your process dynamic, efficient, and tailored to real-world results.
Following these practices helps the sales process map remain an accurate operational reference rather than a static diagram. It can then support consistent execution, onboarding, process reviews, and evidence-based improvement.
Sales Process Mapping Methods (with Examples)
There is no single right way to map a sales process. Choose a method based on the question you need to answer—for example, where prospects drop out, how long work waits, who owns a handoff, or how customers experience the journey. The following sales process mapping examples serve different analytical needs and can be combined when useful.
1. Sales Funnel & Pipeline Visualizations
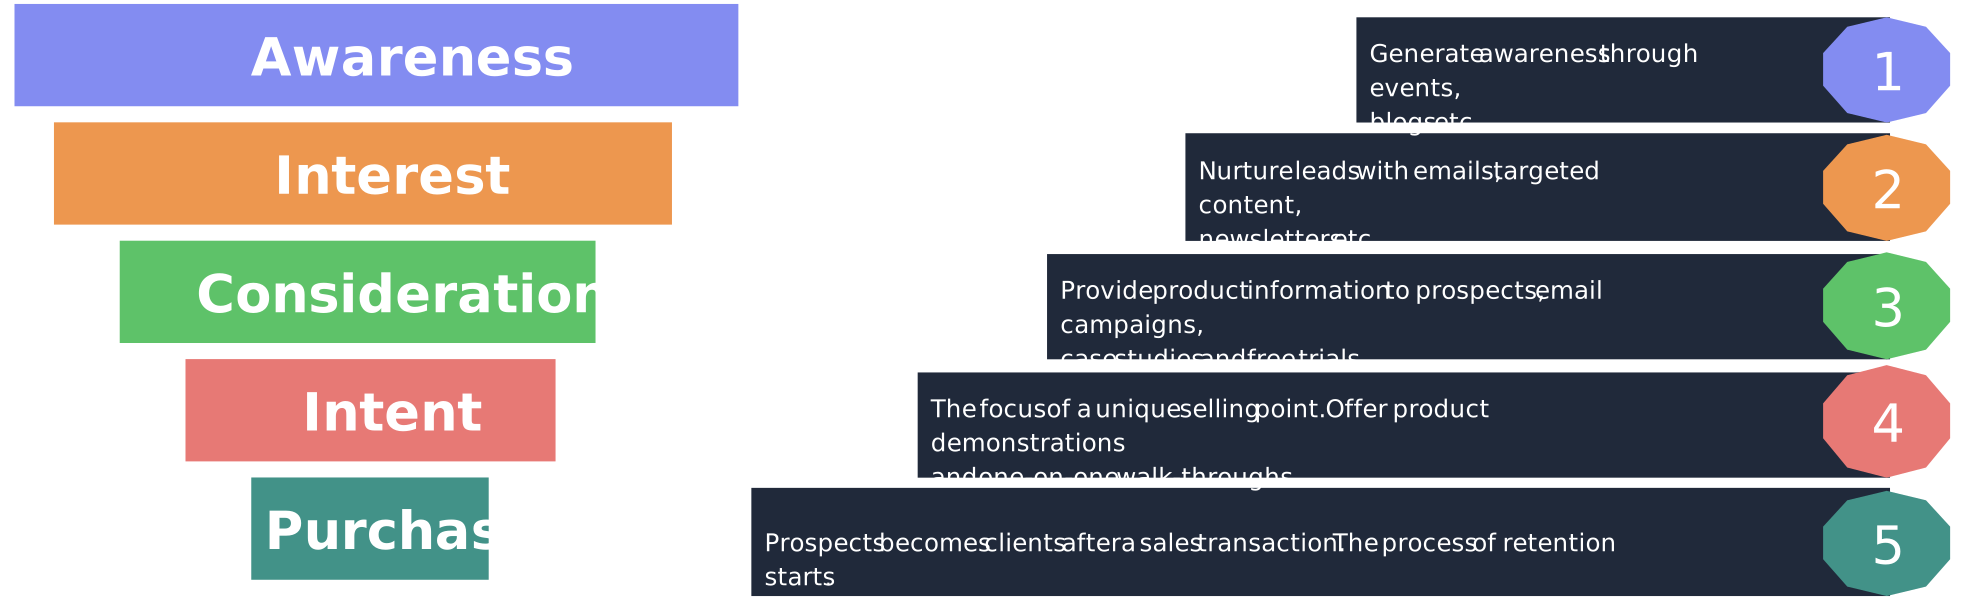
These visuals instantly highlight where deals leak between stages and which transitions need attention (for example, demo → proposal).
Best for: Conversion analysis, stage drop-offs, and forecasting
What it looks like:
- Funnel diagrams (Lead → MQL → SQL → Closed)
- Pipeline stage bars or stacked columns
- Win–loss waterfall views

How to optimize with them:
- Compare funnels by segment, channel, or sales rep
- Overlay conversion rates and average cycle time per stage
This method is ideal when you want a high-level sales process map focused on performance and outcomes.
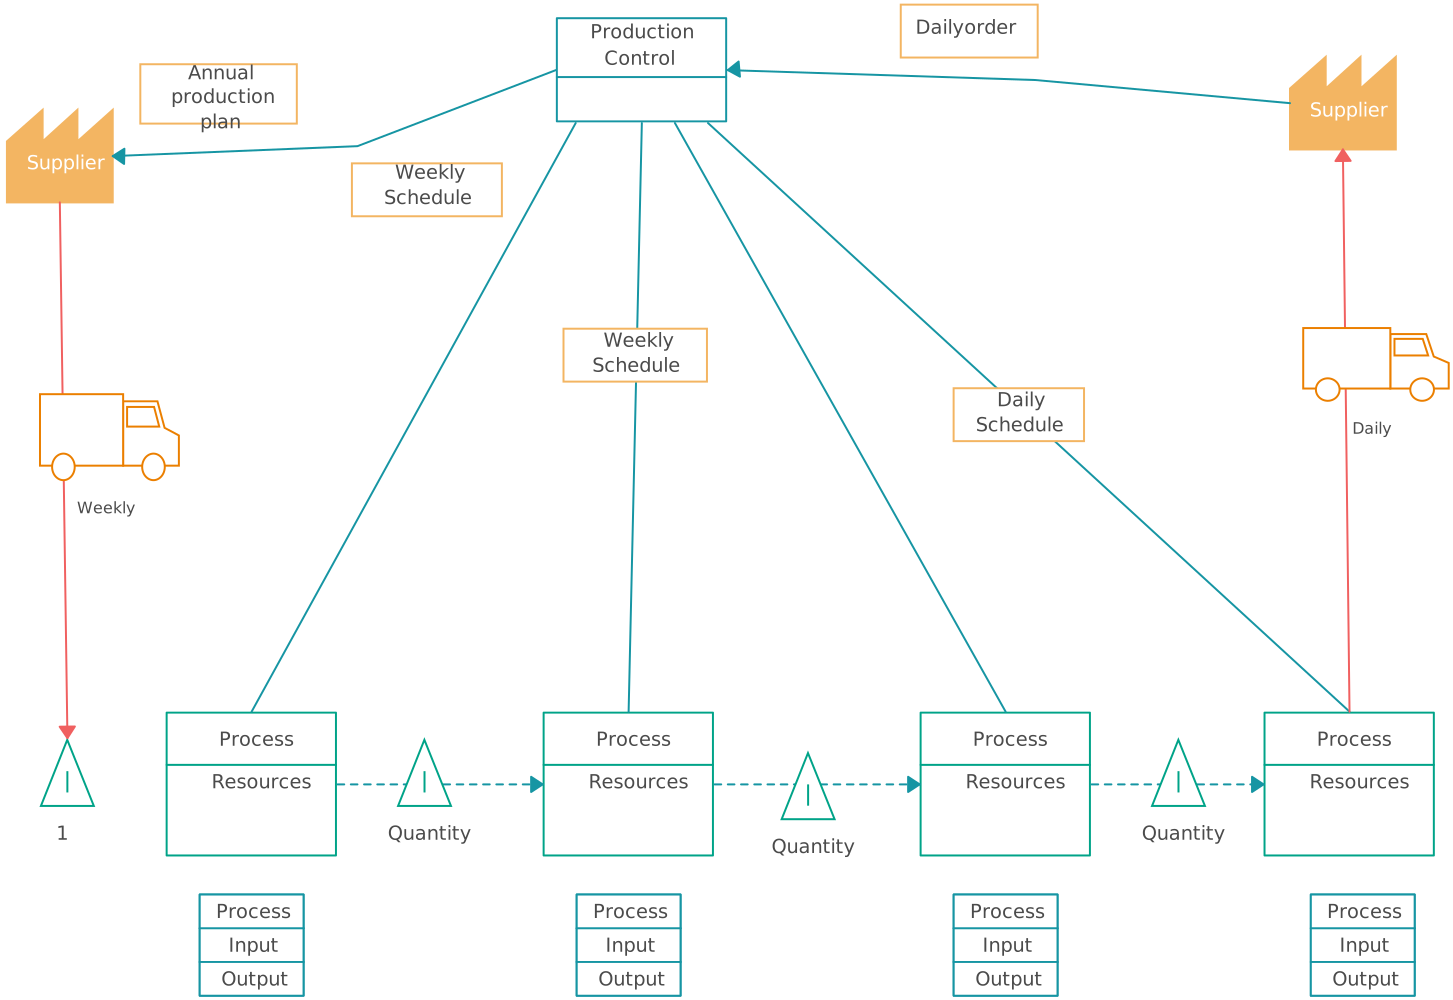
2. Value Stream Maps (VSM)
Borrowed from Lean methodology, VSM exposes hidden delays, like pricing approvals or legal reviews, that quietly slow deals down.
Best for: Eliminating waste and delays in the sales cycle
What it shows:
- Every step from lead creation to deal closure
- Wait times, approvals, handoffs, and rework loops
How to optimize with it:
- Reduce time-to-close
- Remove non-value-adding steps
This approach is perfect when speed and efficiency are your biggest challenges.
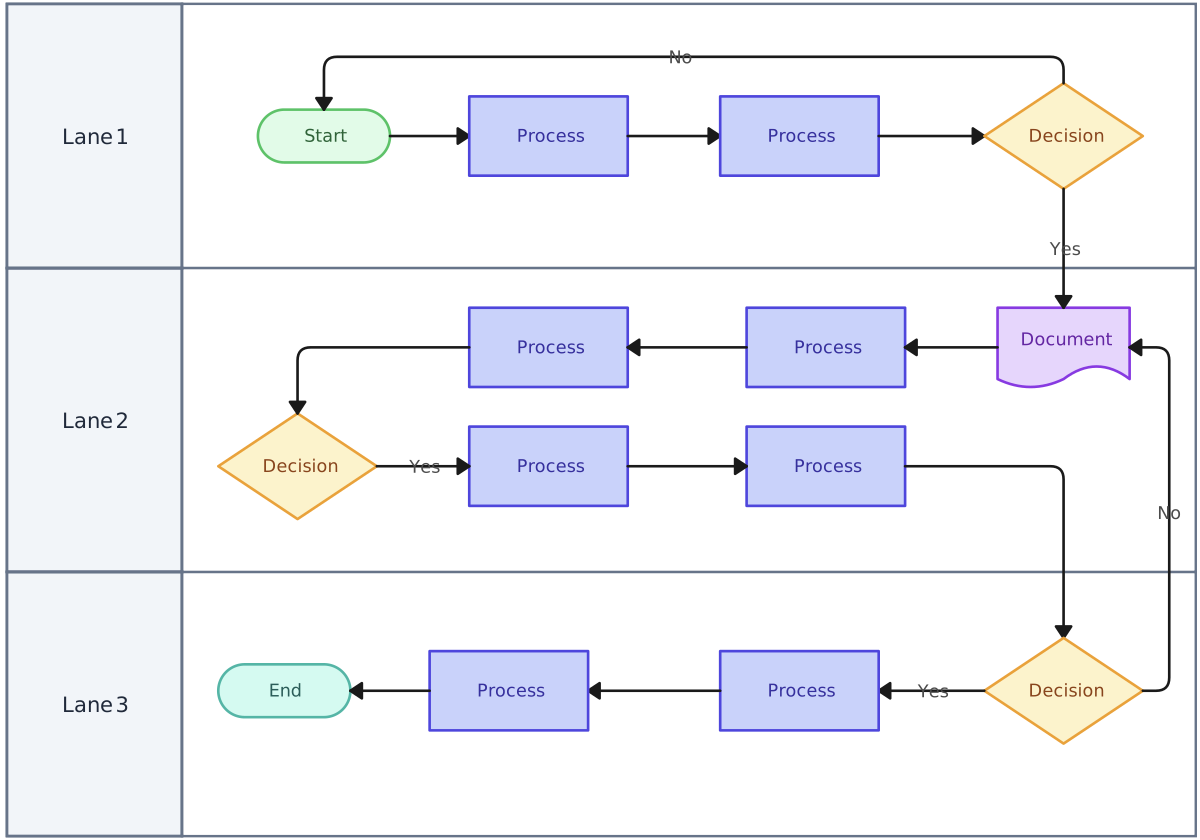
3. Swimlane Diagrams
Swimlanes reveal responsibility gaps, overlaps, and handoff friction that traditional diagrams miss.
Best for: Role clarity and cross-team handoffs
What it shows:
- Separate lanes for Sales, Marketing, SDRs, RevOps, Legal, and Finance
- Clear ownership of every step in the sales workflow
How to optimize with it:
- Fix SLA issues between Marketing and Sales
- Clarify ownership in complex or enterprise sales processes
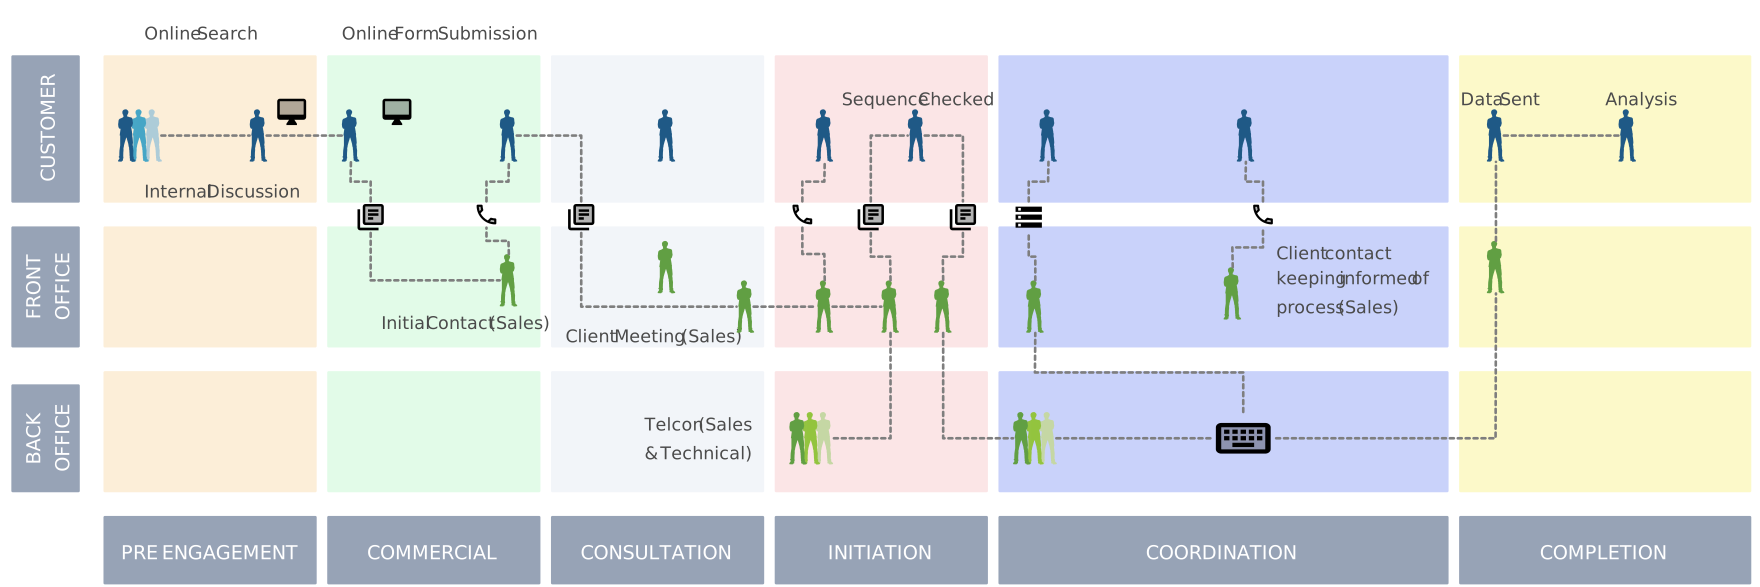
4. Customer Journey Maps (Sales-Focused)
This method optimizes the buyer experience—not just internal efficiency—reducing drop-offs caused by poorly timed or misaligned outreach.
Best for: Aligning sales actions with buyer behavior
What it shows:
- Buyer stages (Awareness → Consideration → Decision)
- Buyer emotions, objections, and questions
- Sales touchpoints mapped to each stage
How to optimize with it:
- Improve messaging at each stage
- Anticipate objections before they stall deals
5. Sankey Diagrams
Sankey diagrams make complex, multi-channel sales flows instantly readable.
Best for: Visualizing deal flow and lead movement
What it shows:
- Flow of leads from sources → stages → outcomes
- Line thickness representing volume or revenue

How to optimize with it:
- Identify lead sources that produce high-quality deals
- Spot unexpected leakage paths in the sales process
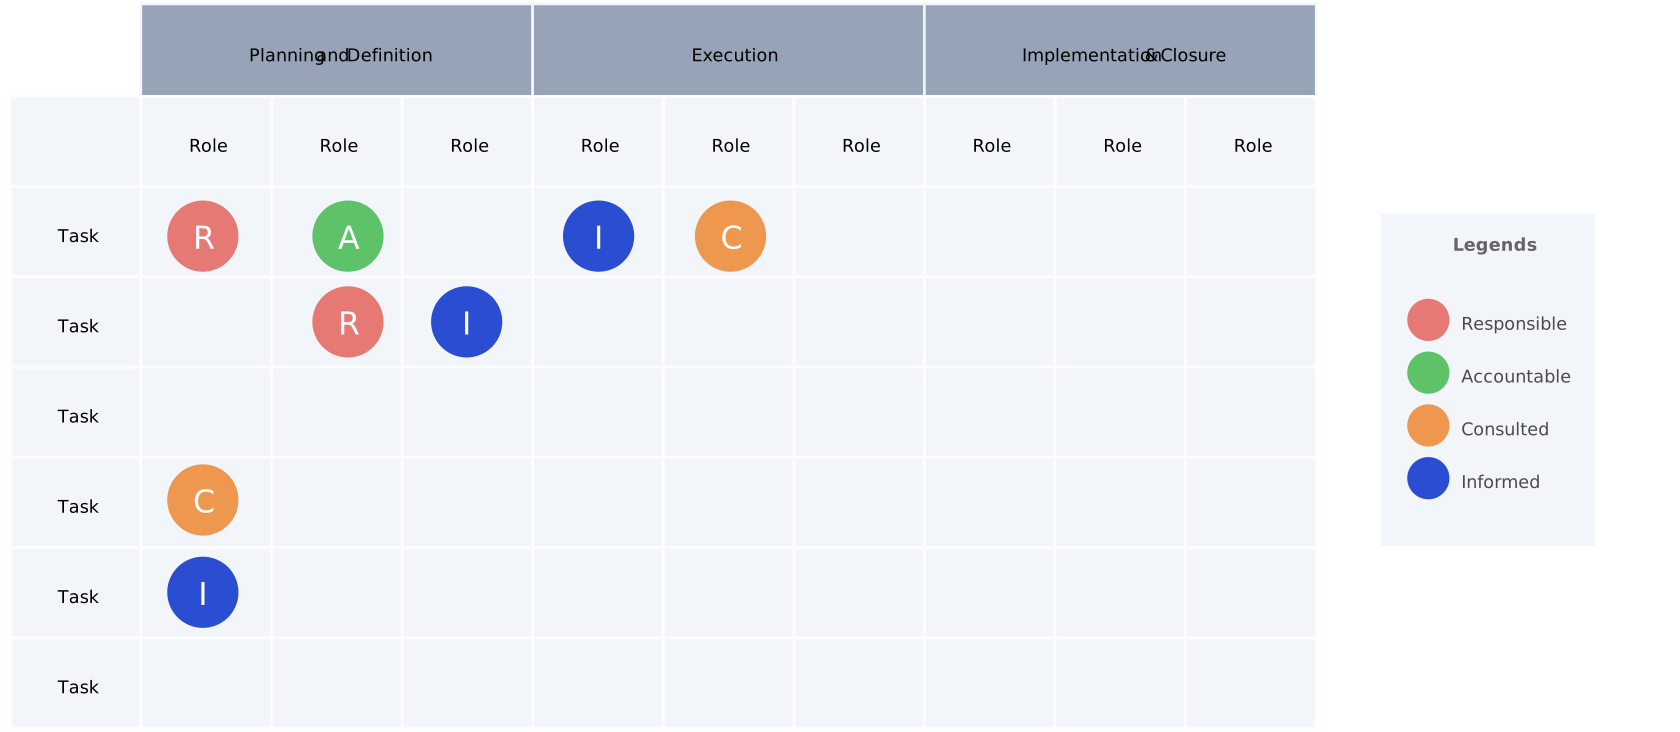
6. RACI / Responsibility Matrices
A RACI matrix clarifies who is Responsible, Accountable, Consulted, and Informed for an activity. Used alongside a process map, it can help teams diagnose responsibility gaps in complex B2B or enterprise sales workflows.
Best for: Governance and decision clarity
What it shows:
- Who is Responsible, Accountable, Consulted, and Informed at each step
This method pairs well with a sales process mapping template focused on compliance and accountability.
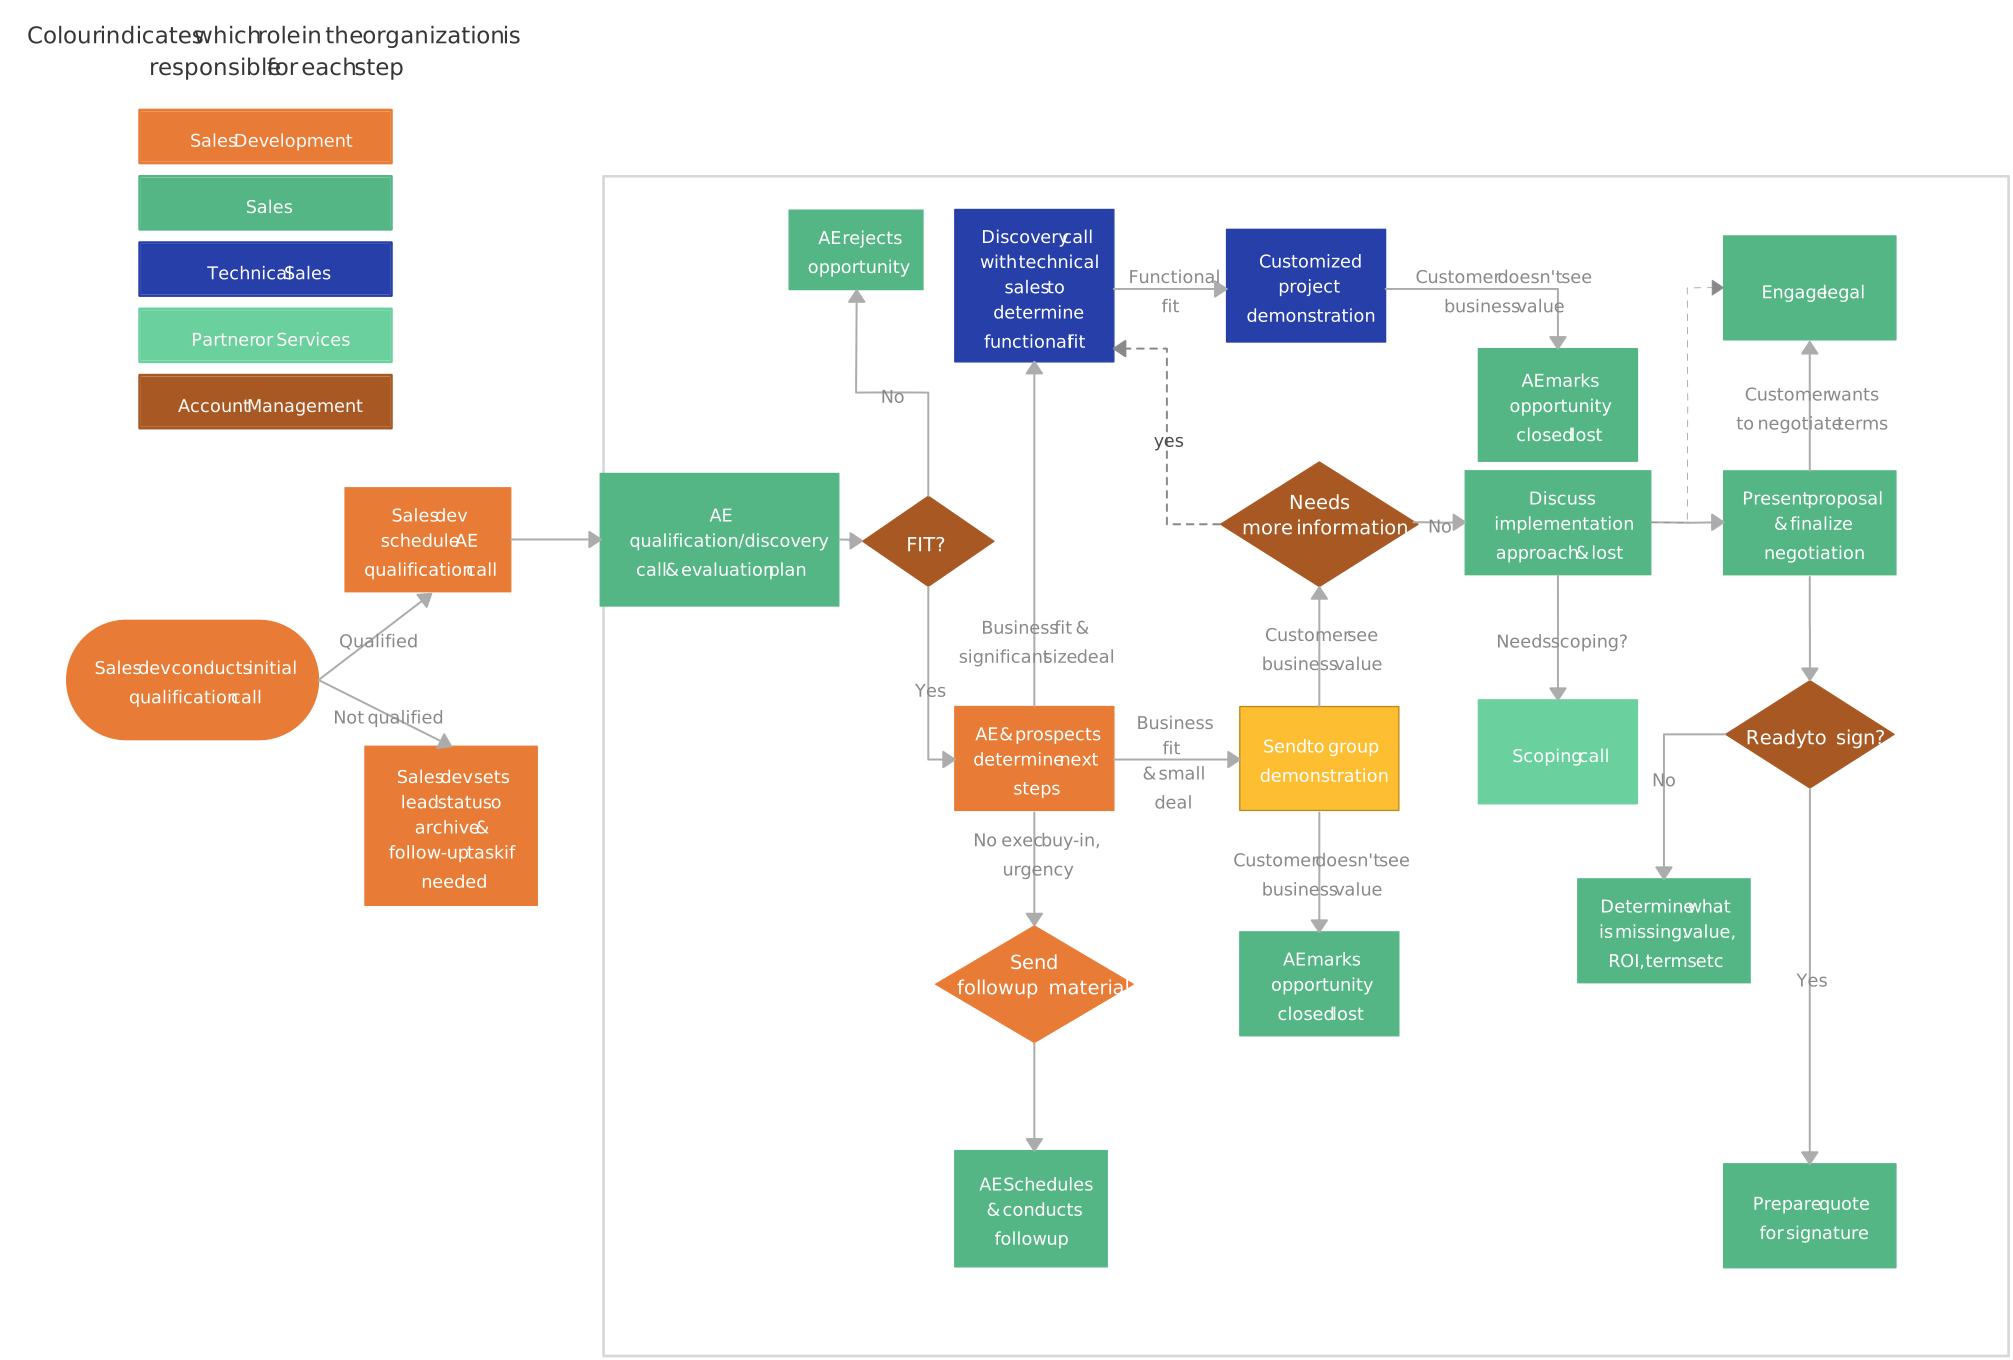
7. Flowcharts
Business process flowcharts show the sequence of activities and decisions in a sales workflow. They are useful for documenting a basic process, explaining it to new representatives, and establishing a consistent reference.
Best for: Simple, end-to-end process documentation
What it shows:
- Step-by-step progression of the sales process
- Clear paths from lead to close
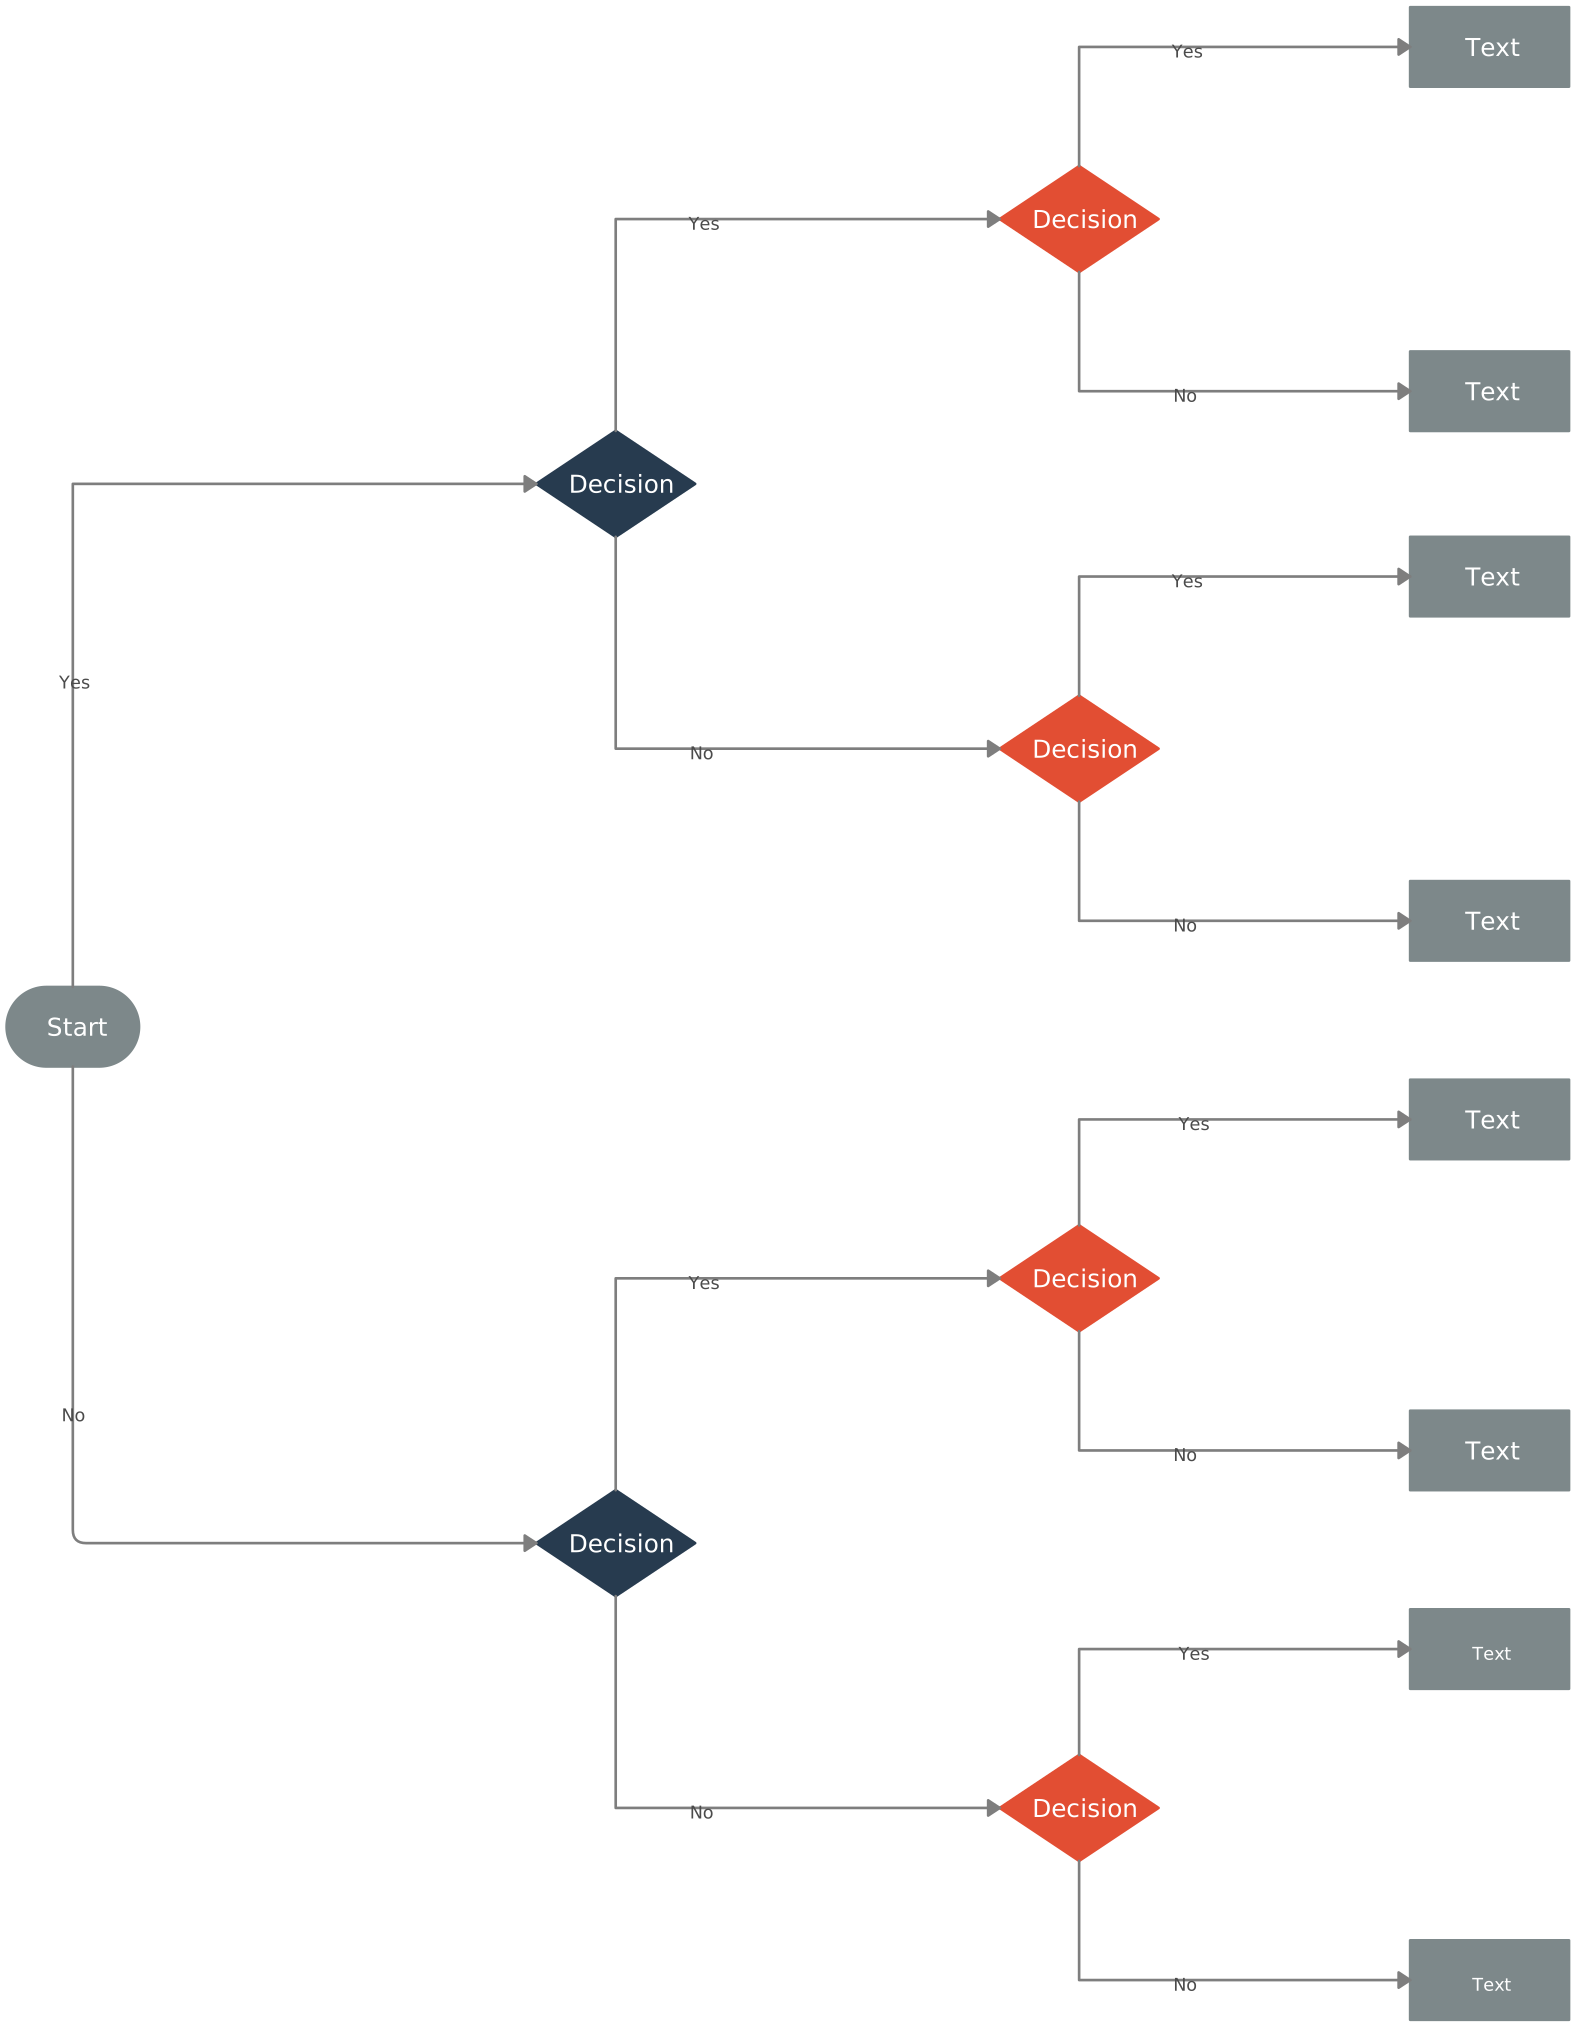
8. Decision Trees
Best for: Deal qualification and next-best-action guidance
What it shows:
- If/then paths based on deal attributes, budget, authority, or readiness
How to optimize with it:
- Improve qualification frameworks (BANT, MEDDICC)
- Guide junior reps to make consistent decisions
Decision trees reduce guesswork and improve deal quality across the pipeline.
✨ Pro tip: In Creately, you can combine methods—for example, using swimlanes to show ownership and decision points to show conditional paths. Add relevant properties and supporting references where teams need more context, then review the map with stakeholders as the workflow evolves.
Why Does Sales Process Mapping Matter?
Sales teams often struggle with scattered workflows, missed follow-ups, and slow-moving deals. When every team member has their own way of doing things, it’s easy for leads to slip through the cracks, opportunities to be delayed, and overall performance to suffer. That’s where a sales process map becomes a game-changer.
By visualizing your entire sales workflow, a sales process map brings clarity and alignment to your team. Instead of guessing what comes next, everyone can see the steps, responsibilities, and decision points at a glance.
Eliminates confusion and inconsistency: A clear sales process map ensures everyone follows the same workflow instead of relying on individual approaches or guesswork.
Improves efficiency and speed: When each step is documented and visualized, teams waste less time figuring out what to do next and move deals forward faster.
Makes performance easier to evaluate: Mapping the sales process highlights where deals stall, drop off, or slow down, making optimization more data-driven.
Strengthens collaboration across teams: Clear handoffs between Sales, Marketing, and other teams reduce friction and keep workflows running smoothly.
Supports forecasting and planning: Documented stage definitions and decision criteria give leaders a consistent process context for interpreting pipeline data and revenue trends.
Enhances the customer experience: Sales reps engage prospects with the right message at the right time by understanding where they are in the buying journey.
Creates scalable, repeatable growth: Successful teams rely on structured sales processes, and sales process mapping provides the foundation for consistent results.
With Creately’s process mapping software, teams can create and maintain sales process maps with owners, handoffs, decision points, notes, files, and linked references in a shared visual workspace. Stakeholders can comment in context and collaborate in real time, while version history helps teams review how the documentation changed over time.
Benefits of Sales Process Mapping
Sales process mapping brings structure and visibility to what is often a complex, fast-moving workflow. By turning your sales activities into a clear visual system, teams gain confidence, alignment, and momentum.
Makes the sales process transparent: A visual sales process map shows every stage, handoff, and decision point, eliminating guesswork and hidden gaps.
Serves as a blueprint for the entire sales team: Everyone follows the same roadmap, ensuring consistency across reps, regions, and channels.
Gives leadership a high-level process overview: Managers can see how stages, decisions, and handoffs are designed and compare that structure with pipeline data when investigating bottlenecks.
Eases onboarding for new sales reps: New hires can grasp the sales workflow faster, reducing ramp-up time and dependence on tribal knowledge.
Supports evaluation and improvement: A documented sales process makes it easier to review performance, assess deal stages, and optimize what’s not working.
Increases sales confidence and ingenuity: When reps know the process and trust it, they spend less time guessing and more time selling creatively and effectively.
Ultimately, sales process mapping gives teams a repeatable framework for executing, reviewing, and improving the way they sell. Its impact depends on whether the mapped process reflects actual work and is maintained as conditions change.
A well-designed sales process map makes stages, roles, decision points, and customer touchpoints easier to examine together. Creately’s templates, structured properties, real-time collaboration, comments, connected references, and version history help teams maintain these maps as living documentation as stages, owners, and handoffs evolve.