What's New
May 30, 2025
Improved Cultural Genograms, Collapsible PFDs, Smoother Workflows, and More

Visualize Diversity with the Automatic Cultural Genograms
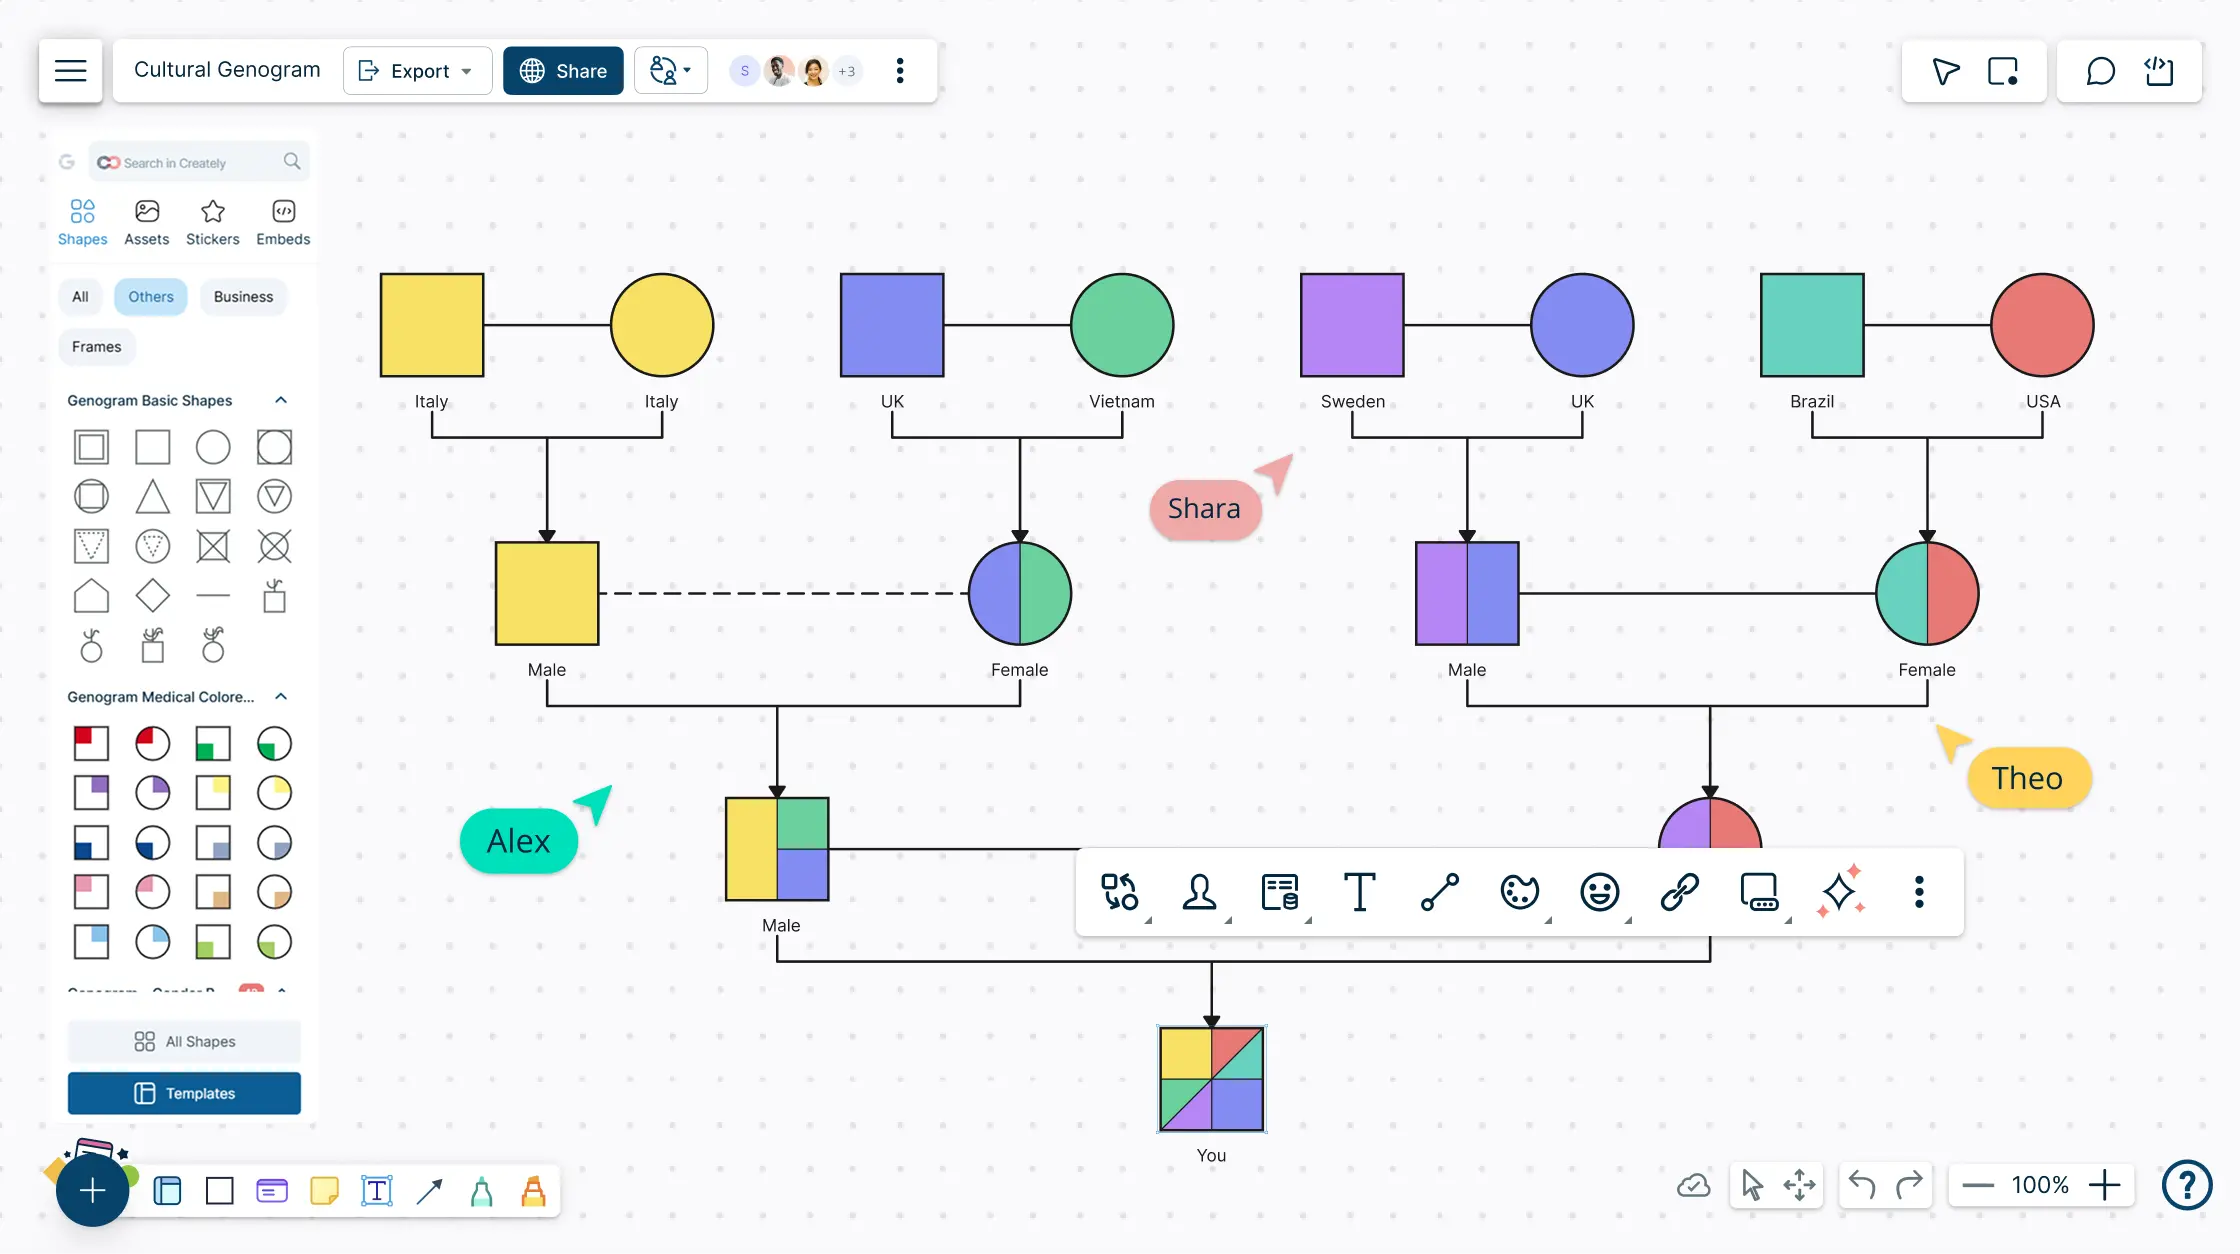
Cultural genograms get filled out with their parental colors automatically. It’s a game changer for drawing genograms and family trees easily. Drawing them is REALLY fun. Changing colors on parents, cascade to their children, grandchildren and so on.
The Cultural Genogram includes a new “Connector Bar for Children”, making it easier to represent multi-cultural or blended family backgrounds. Simply create parent nodes with distinct colors, connect them using the new connector bar, and add a child node — the child will automatically inherit a blended color based on the parents’ attributes. This visual enhancement offers a clearer and more intuitive way to explore cultural dynamics within family structures.

Expanded 12K Character Limit for AI Template Prompts
We’ve increased the custom prompt input limit in the AI Template Generator to 12,000 characters, giving you more room to craft detailed and nuanced instructions. This allows for more context-rich prompts, leading to smarter, more accurate AI-generated templates tailored to your specific needs.
Fresh Look with the New AI Color Palette
AI-generated templates now come with a new color palette that ensures visually balanced and cohesive designs. This enhancement helps your templates look polished and professional right from the start, saving time on manual styling and color adjustments.
Simplify Complex Process Flows with Collapsible Diagrams
We’ve added a Collapse/Expand button to Process Flow Diagrams, enabling you to hide or reveal sub-processes and branches with a single click. This enhancement improves navigation and makes it easier to focus on specific sections of your diagram, especially when working with complex or layered workflows.
Expanded ER Diagram Support with New Notations
We’ve added two widely-used notations to the ER diagram library: Bachman Notation and Barker’s Notation. These additions give you more flexibility to model data structures using your preferred standards, making Creately even more powerful for data modeling and database design.
Precision Shape Insertion and Accurate Connector Placement with Plus Create
We’ve resolved two important issues with the Plus Create feature to improve your workflow. Now, Plus Create adds only one intended shape without duplicates. Additionally, when creating shapes from rotated objects, connectors attach to the correct points, and new shapes appear in the right position and direction. These fixes ensure your diagrams stay neat, precise, and easy to build.
Seamless Name Mapping for CSV Imports in Org Charts
We’ve enhanced the CSV import process so that the “Name” field now automatically maps to the corresponding attribute in your org chart shapes within SmartSets. This improvement ensures your shapes are correctly labeled right away, making your org chart creation faster and more reliable.
Enhanced Advanced Filtering with AND/OR Conditions for Org Charts
The Advanced Filter for imported data in org charts now includes an AND/OR selector, giving you greater flexibility to combine conditions and precisely control which data is displayed. This improvement makes filtering more powerful and tailored to your needs.
Smooth and Immediate Text Updates in Shapes
We’ve improved text handling so that when you paste new text after deleting existing content, it appears instantly without needing extra actions. Previously, in some cases, when a user deleted text and pasted new text into a shape, the new content wouldn’t appear until another action was performed. This enhancement makes editing feel more natural and keeps your workflow flowing seamlessly.
Add Empty or Predefined Slides to Presentations with Ease
Creately can now be used to build slides really easily. Our presentation feature is one of the world’s most flexible presentation tools with zoom-in and selective view controls providing you a really great way to take anyone through a large, detailed canvas.
However, if you simply wants to whip out a presentation in classic powerpoint style, Creately has got your covered too. You can now use empty slides or choose from the pre-defined slides and drag drop them on the canvas. They get added to the presentation flow automatically, making it easier than ever to build structured slide decks, right in the Creately workspace.