Succession planning best practices help organizations prepare successors, reduce leadership risk, and maintain continuity when key roles change. This guide covers practical practices for executive and board succession planning, talent development, governance, readiness reviews, and common mistakes.
A data-linked org chart connects reporting lines with employee and role records. Keeping those records together helps HR review team structure, vacancies, and proposed changes. This guide explains how to prepare the data, build a chart, and maintain it as the organization changes.
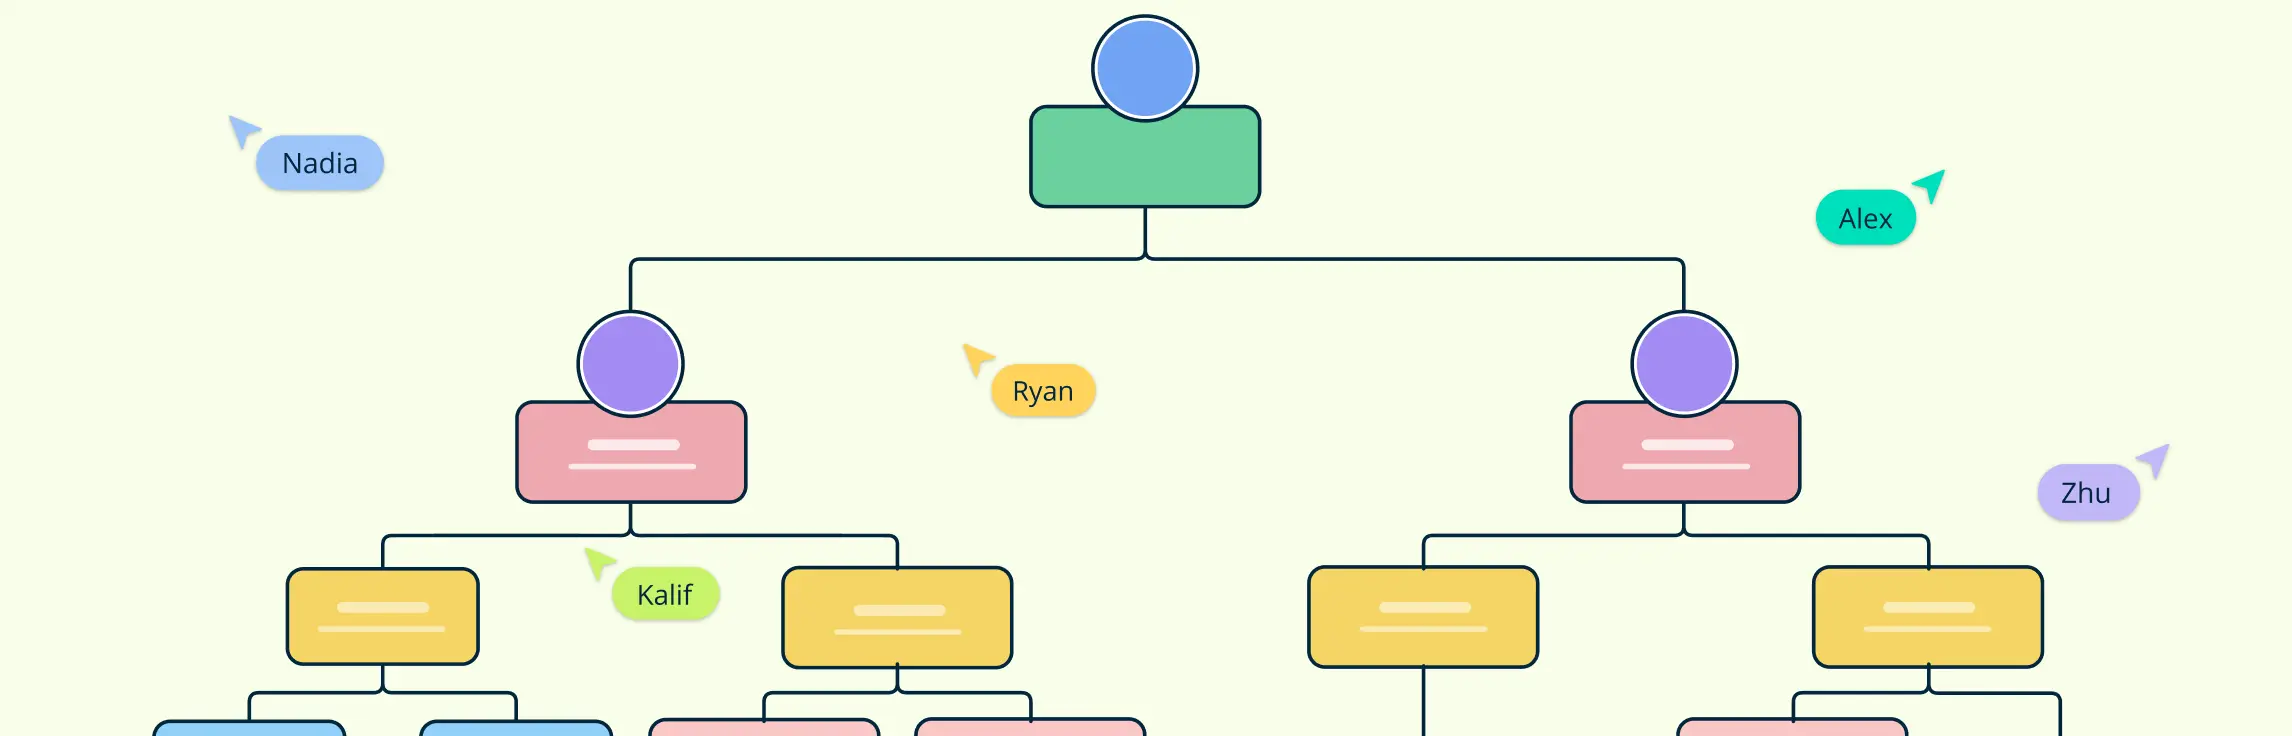
An organization chart is a graphical representation of relationships between an organization’s departments, functions, and people. It can also indicate the flow of data, responsibility, and reporting from bottom-up or top-down. Its usage across the globe is a testament to its effectiveness. Below are some rules for drawing organizational charts and org chart best practices to make your organization chart more meaningful and useful.
This is the third post in a series on organization structures. Here is a brief outline of what has been discussed so far: In the first post we discussed the simple, functional and the multidivisional organizational structures. The second post followed up with the Holding company structure, Matrix Structure & Team-based structures. Now with the final post in the series, let’s take a look at the Project-based and Network structures.


![Organizing for Success [3] : Map out your Organization Structure](/static/assets/guides/organizing-for-success/Organizational-Chart-Best-Practices-for-Meaningful-Org-Charts-header.webp)