KWL Chart Online
Unlock Learning with Creative KWL Charts That Spark Engagement and Insight
Easily build and customize your KWL charts online for better learning outcomes, whether you're teaching, brainstorming, or organizing ideas.
- Intuitive drag-and-drop interface combined with smart diagramming features
- Embed, share, and present easily within documents, slides, or learning portals
- Collaborate in real-time with your team or class from anywhere
AI KWL Chart Generator
Turn what you know, want to know, and learn into actionable insights in seconds
- Input your K, W, and L points, or simply type your topic
- Click Generate with AI → Creately auto-creates a structured KWL chart
- Refine, expand, and collaborate on an infinite canvas in real time
Why educators and teams love Creately’s AI KWL Chart Generator
 Instant structure – Save hours of setup time with an AI-powered KWL chart creator
 Secure By Design – AI runs within Creately; no data leaves the platform
 Clarity from complexity – Organizes scattered thoughts into a coherent K-W-L format
 Multilingual support – Create KWL chart online in any language, perfect for diverse classrooms
 Boost engagement – Makes learning interactive and visual for students and teams
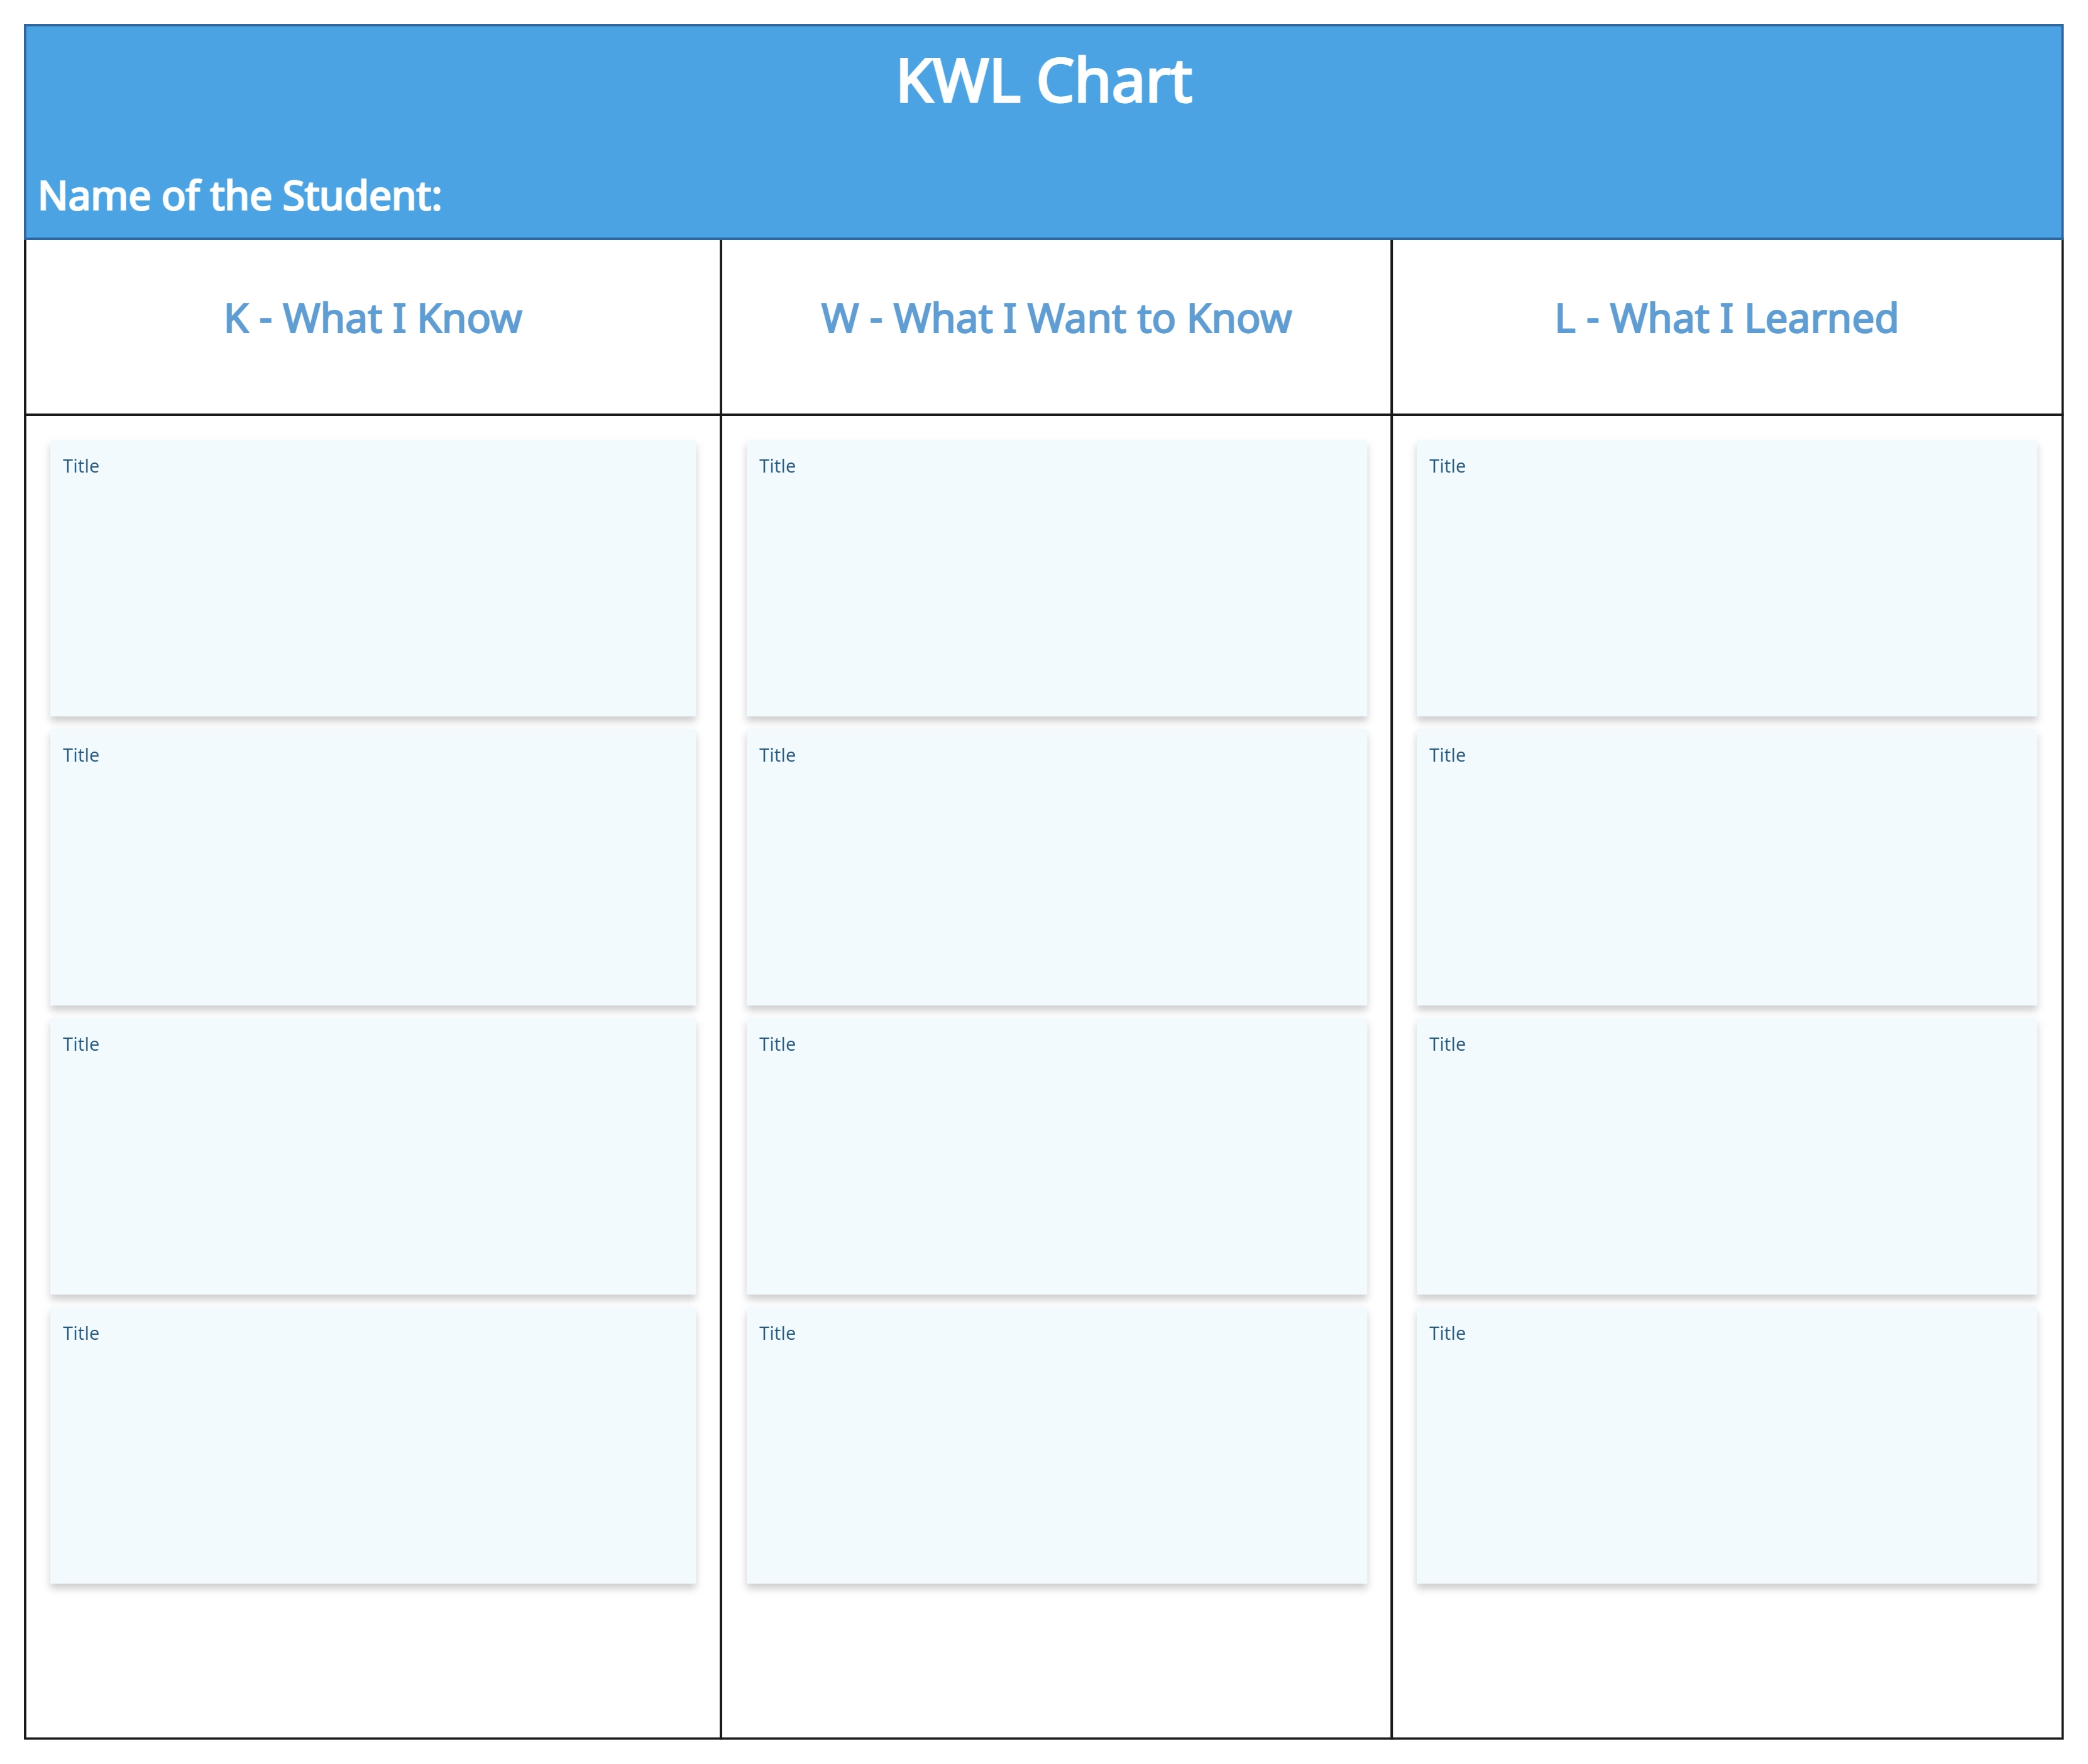
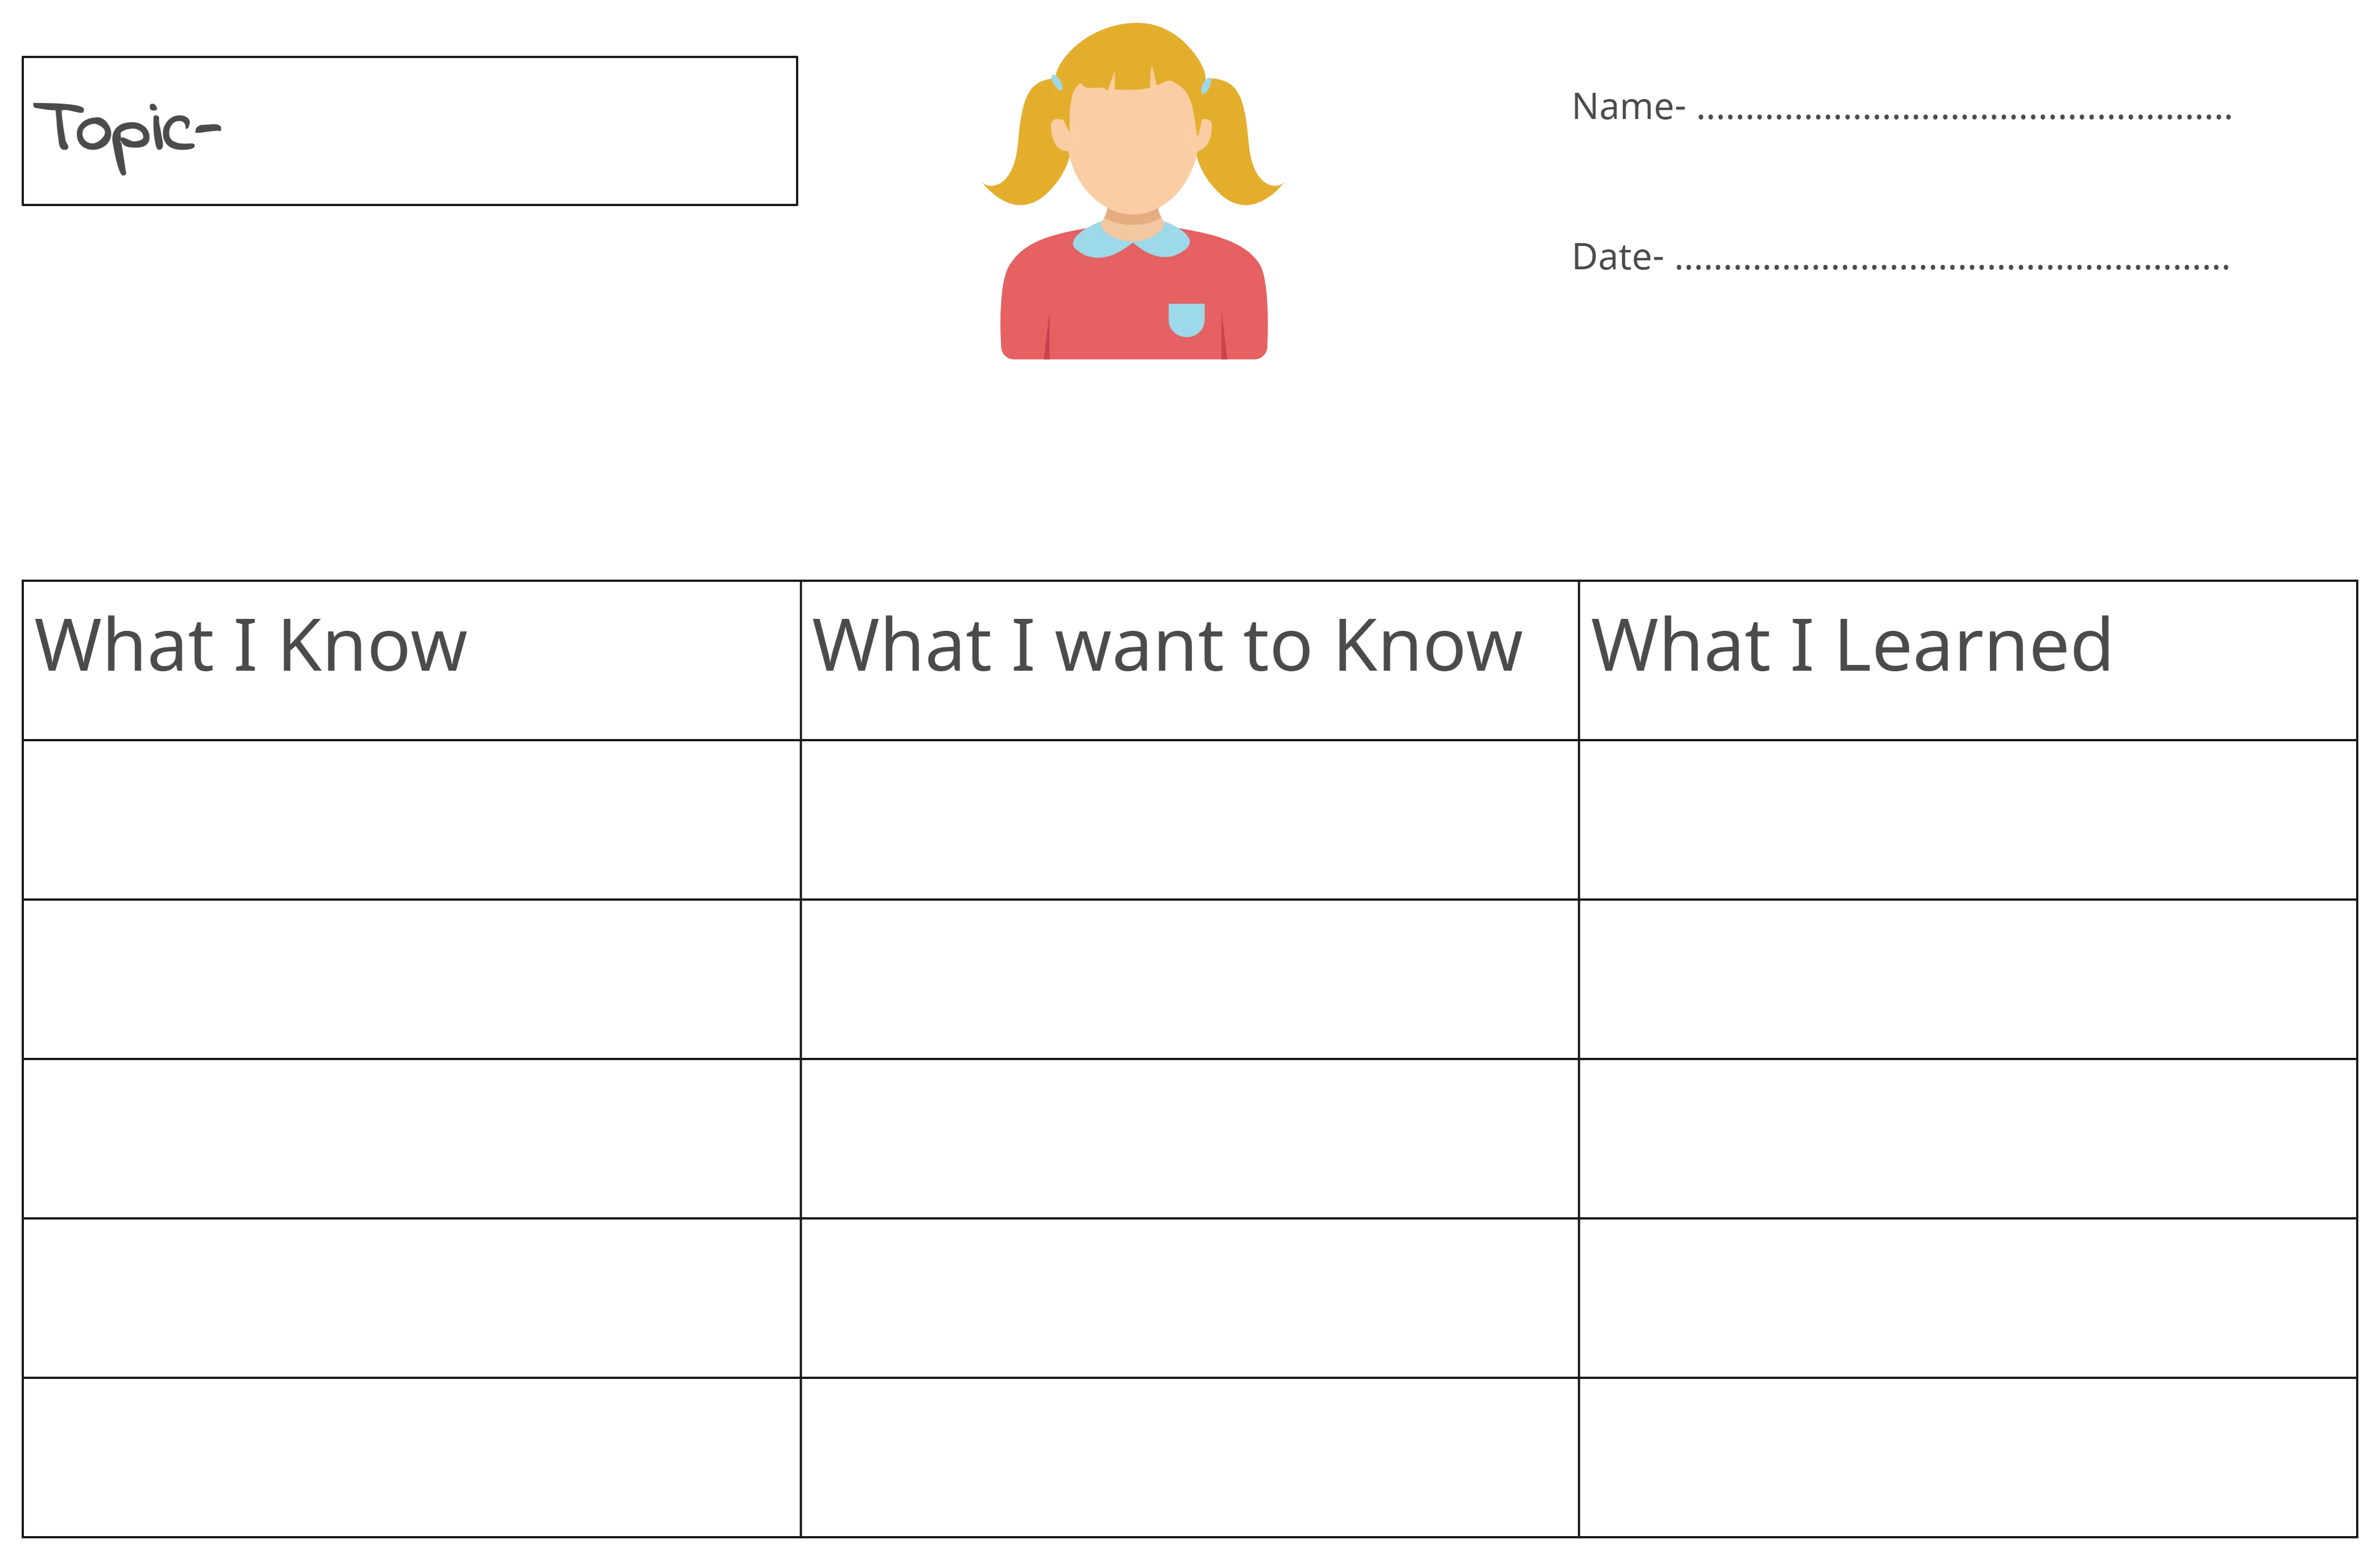
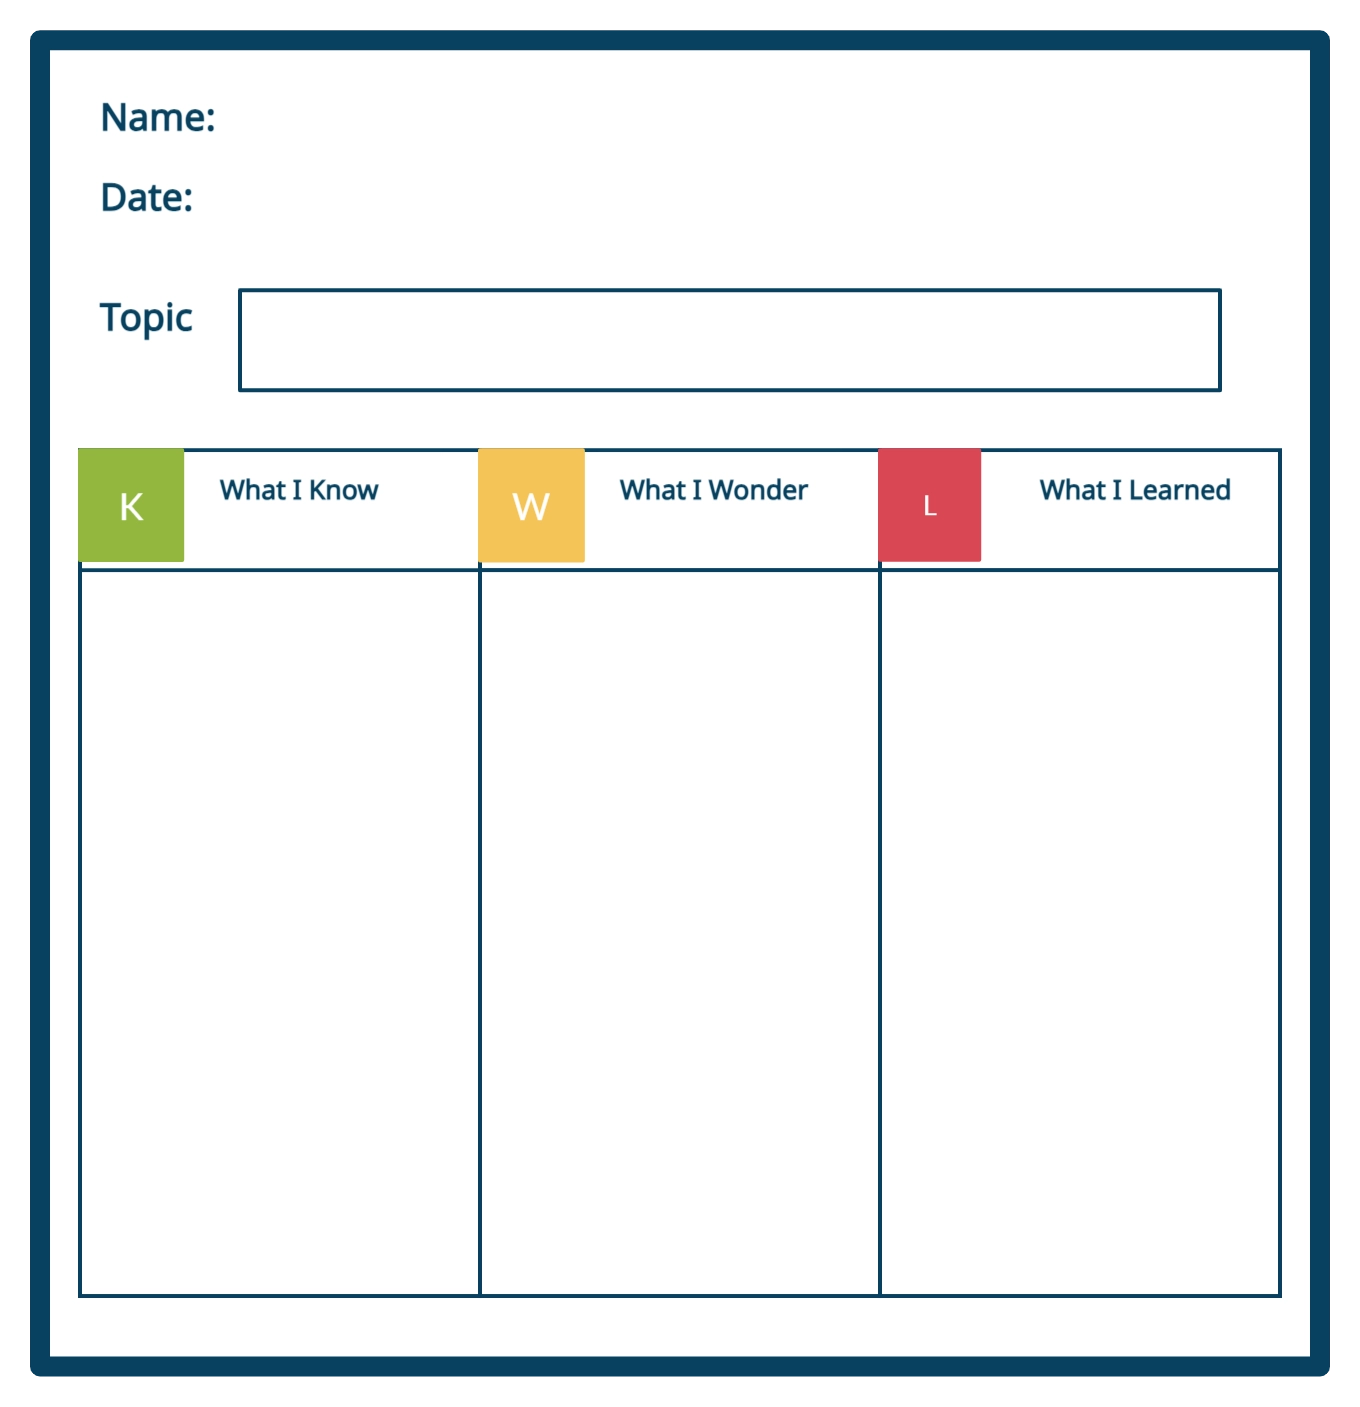
KWL Chart Templates
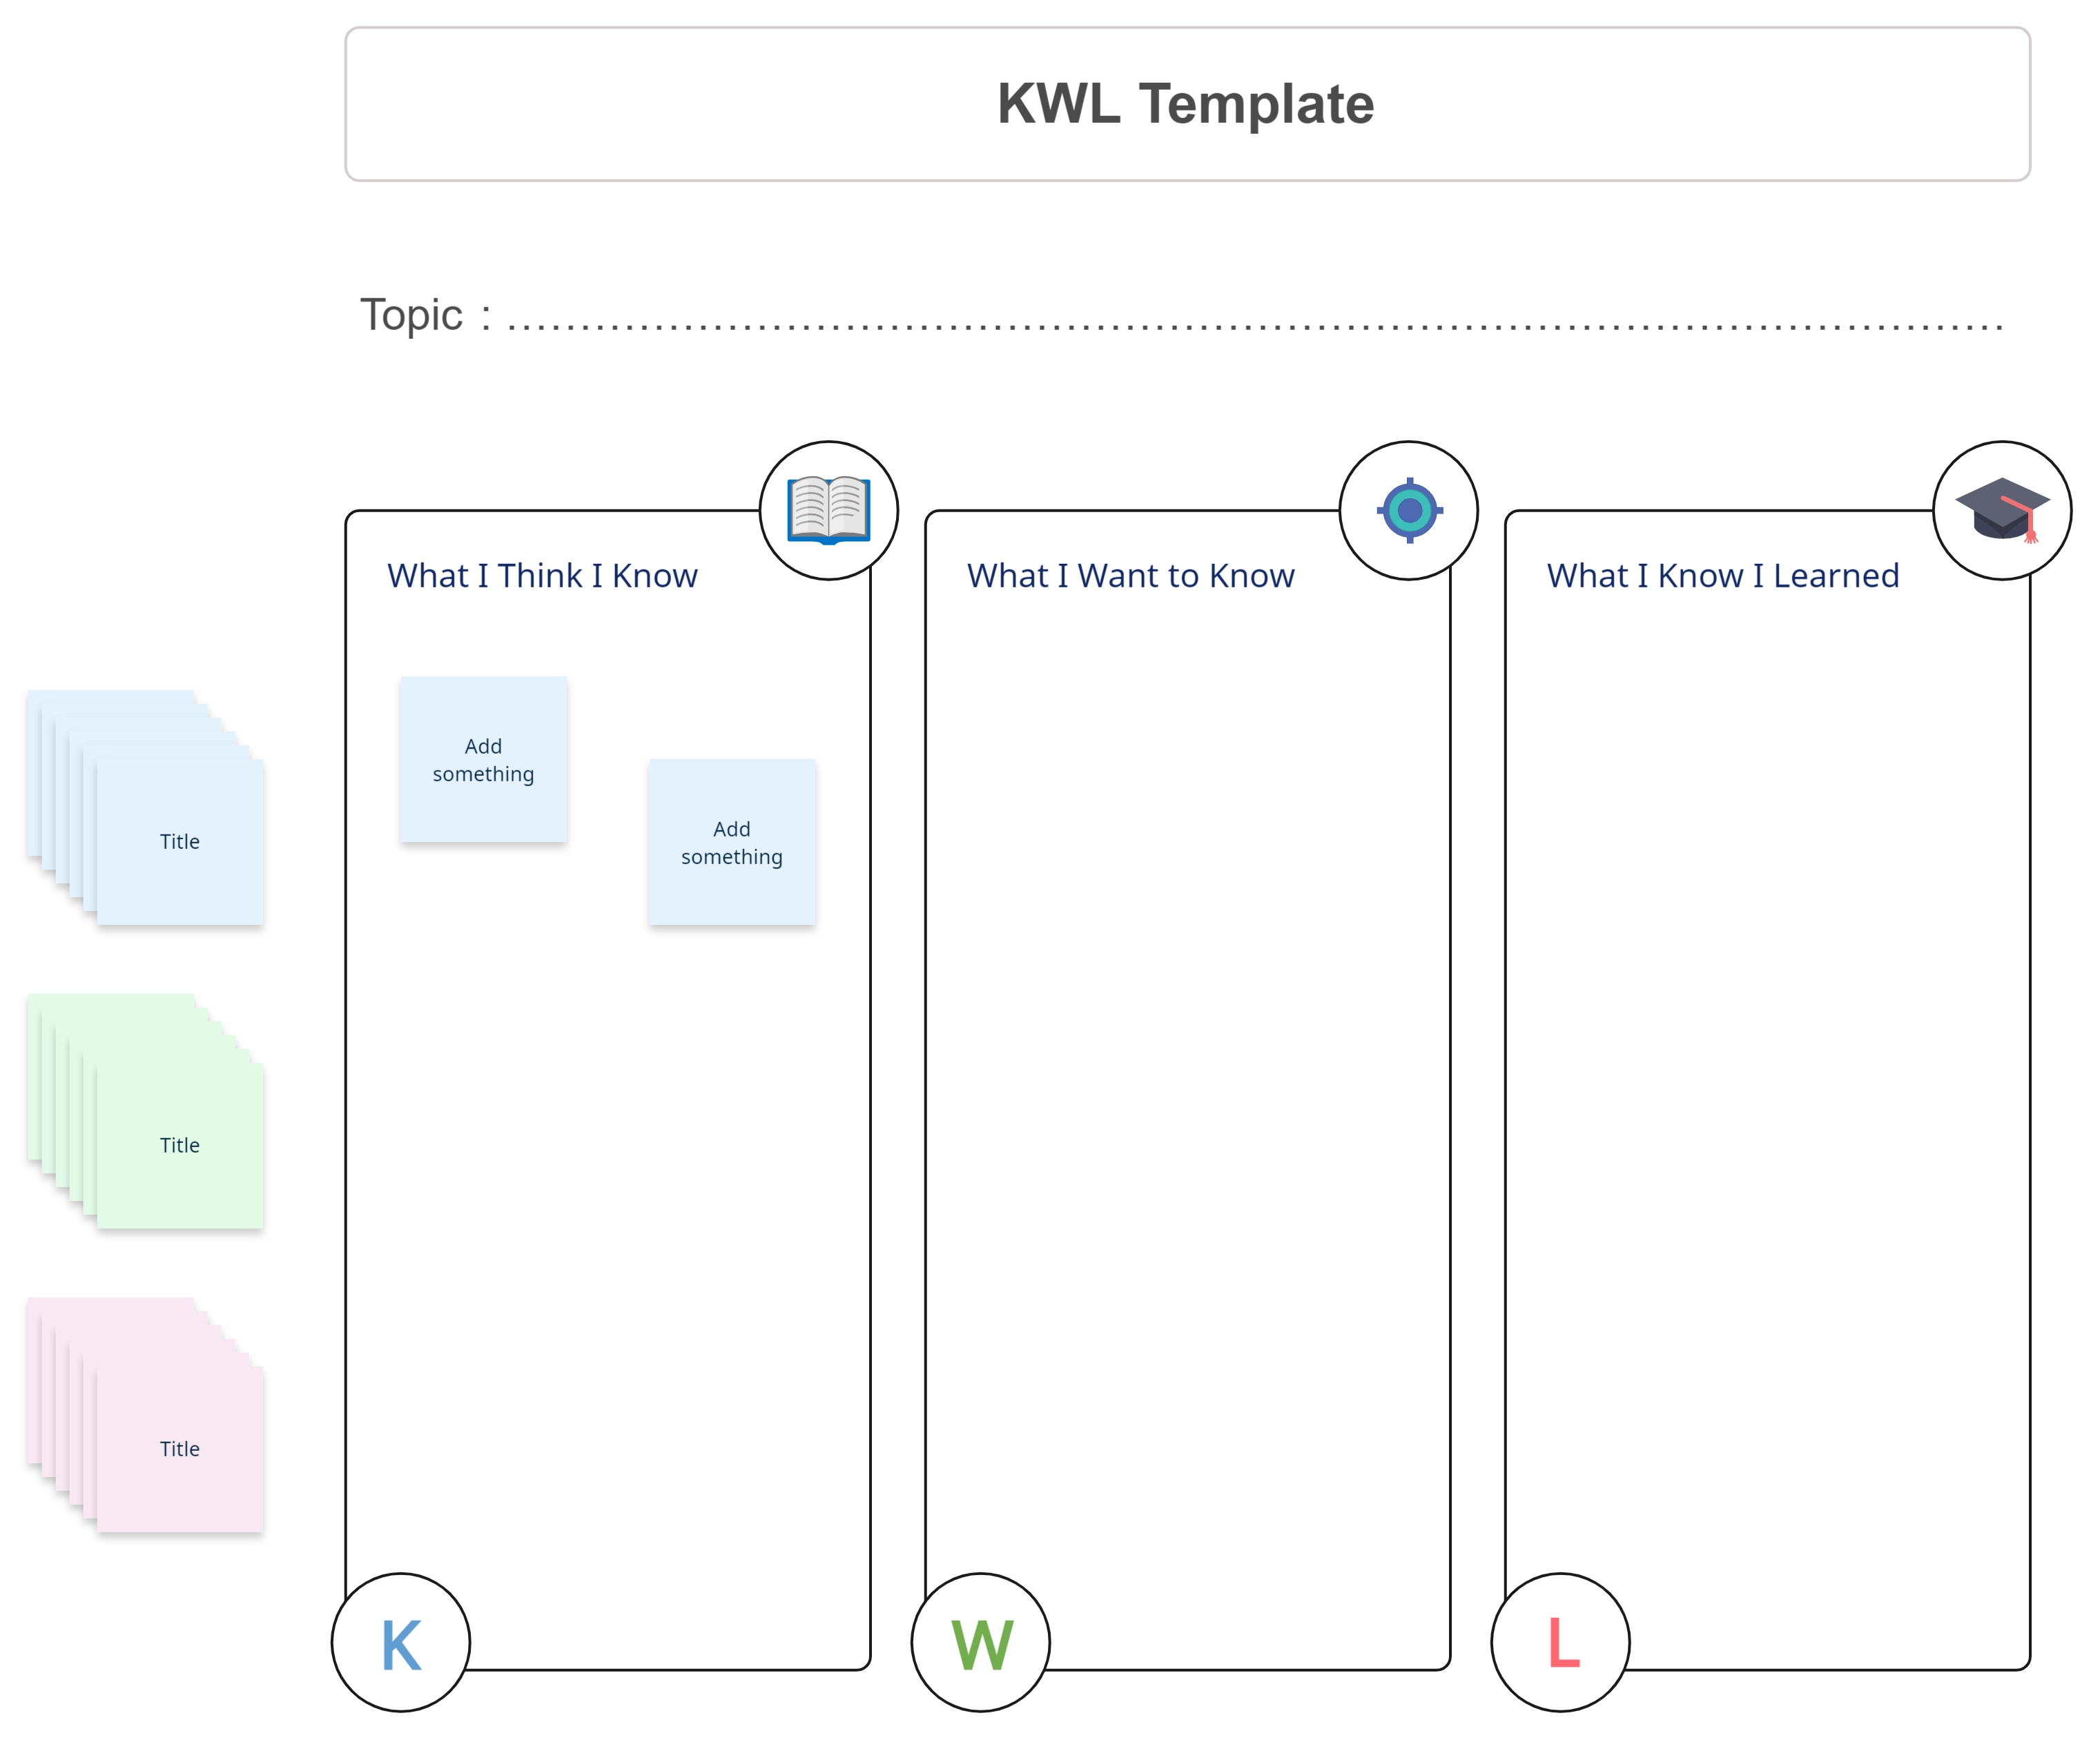
What Is a KWL Chart?
A KWL chart is a simple yet powerful graphic organizer that supports learning and comprehension. It helps students map out their knowledge journey through three key stages:
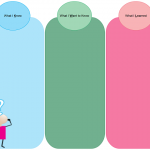
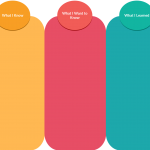
- K – What I Know
- W – What I Want to Know
- L – What I Learned
Originally designed for classroom use, the KWL chart is widely used in reading comprehension, inquiry-based learning, and reflective thinking. Its structured format encourages students to activate prior knowledge, set learning goals, and reflect on their understanding after a lesson.
Today, with KWL chart online platforms, educators and learners can go beyond paper. An online KWL chart tool lets you create, customize, and collaborate on KWL diagrams visually, whether you’re teaching in a classroom or conducting remote lessons.
When Do You Need a KWL Chart?
- To Help Students Understand and Reflect:
Teachers use KWL charts to activate prior knowledge, set learning intentions, and help students reflect on what they’ve learned. It’s especially effective in subjects like science, history, and reading comprehension.
- To Train and Onboard Employees:
HR teams and trainers use KWL digital tools to structure employee onboarding or training sessions. It helps participants identify existing knowledge, clarify learning goals, and assess retention after sessions.
- To Learn Something New Independently:
Whether you’re learning a language, picking up a new software, or exploring a hobby, a KWL chart online can help guide your self-learning by tracking what you already know and what you aim to master.
- To Plan Group Discussions and Research Projects:
Collaborative groups—academic or professional—can use KWL chart generators to align team members before research or brainstorming sessions. Everyone starts with the same understanding and learning objectives.
- To Evaluate Learning Outcomes in Digital Classrooms:
In blended or remote learning environments, using a KWL chart tool like Creately enables teachers and students to document learning progress over time, especially with real-time collaboration and template-based guidance.
How Can KWL Charts Help?
- Encourage Active Learning:
By identifying what learners already know (K) and what they want to learn (W), KWL charts promote curiosity and set personalized learning goals.
- Guide and Focus Learning:
KWL charts help learners stay focused by narrowing down key questions and helping them find answers during the learning process. With Creately’s KWL chart generator, this becomes faster and more structured.
- Track Learning Progress:
The “Learned” column (L) makes it easy to reflect on how much knowledge has been gained. This supports better retention and accountability—especially in group learning environments or corporate training.
- Improve Critical Thinking Skills:
As learners move from assumptions to inquiry to insight, the KWL chart tool fosters deeper thinking and analysis.
- Enable Collaboration and Discussion:
Using a KWL chart creator like Creately allows multiple users to collaborate in real time, contribute ideas, and visually co-create understanding—perfect for teams and classrooms.
- Make Learning Visual and Engaging:
With drag-and-drop features, image integration, and AI-assisted formatting, KWL online charts on Creately turn abstract thoughts into clear, interactive visuals.
How to Create a KWL Chart Online with Creately?
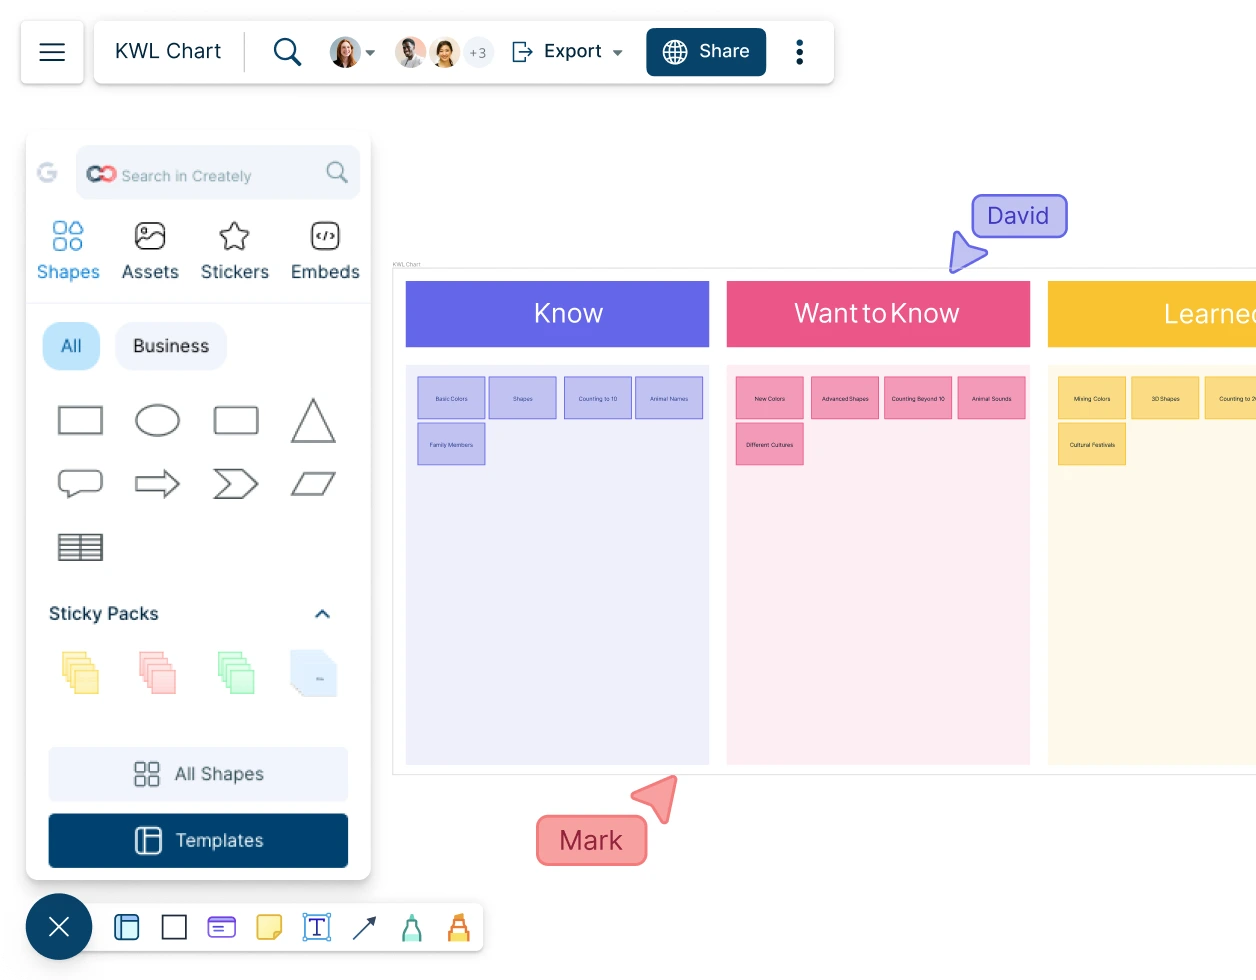
The first step is to sign in and open a workspace. Use KWL chart templates to get started instantly, or drag and drop the table shape from the shape library. Add or remove columns to set the table to your requirements.
Name the three columns: What I Know, What I Want to Know, and What I Learned. Apply custom colors, styles, and formatting using the contextual toolbar to separate each section visually.
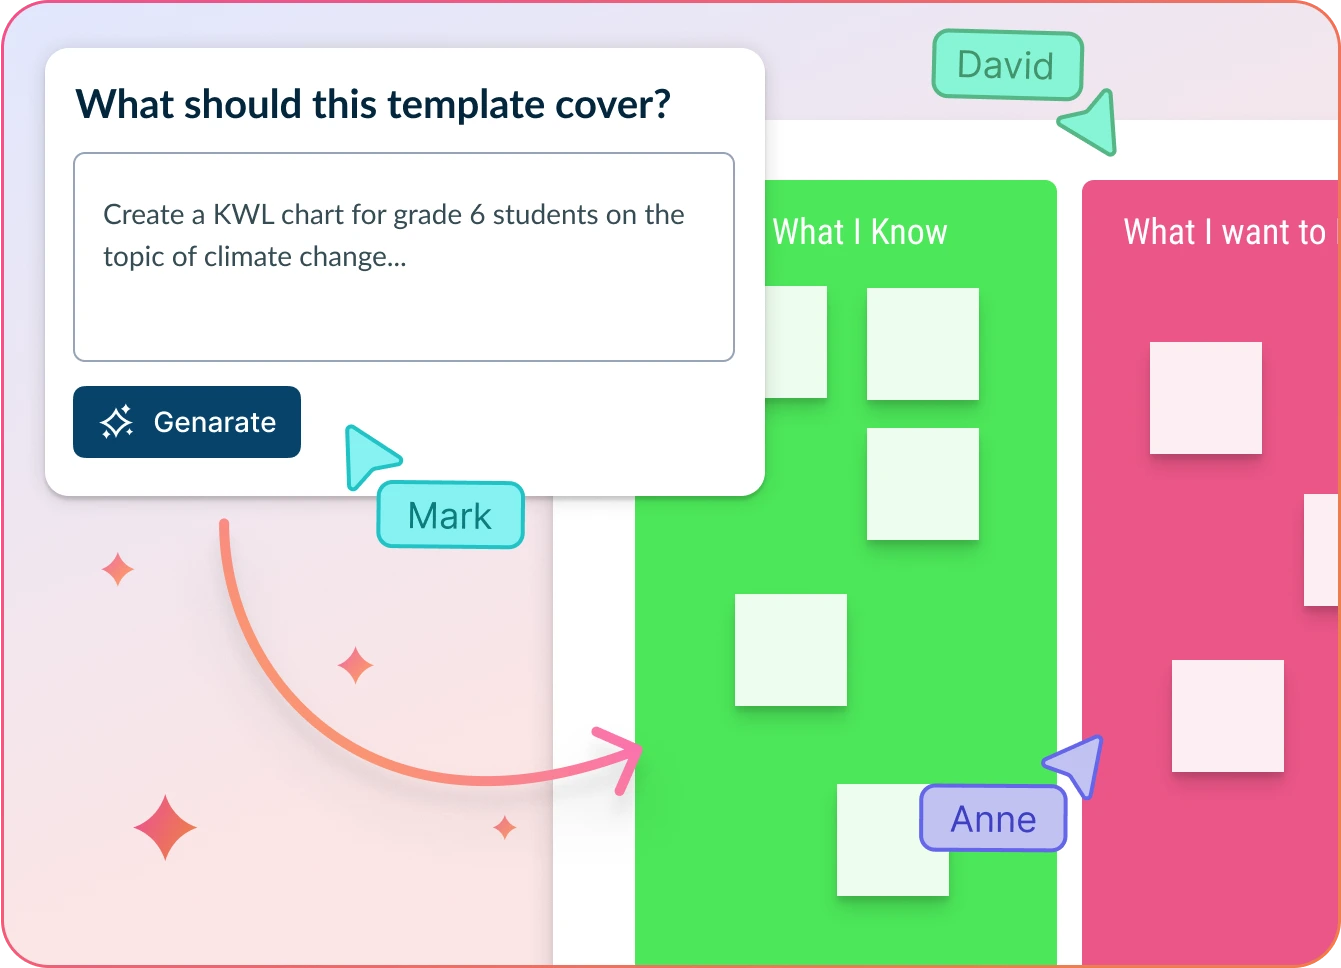
Speed up your process with the AI KWL Chart Generator. Just input your topic and the information you have, and Creately AI will generate a KWL chart with suggestions for relevant entries under each column. Perfect for quick brainstorming or jumpstarting a lesson plan.
In the first column, What I Know, add prior knowledge related to the topic. With real-time collaboration, students or teammates can simultaneously contribute their ideas, in person or remotely.
Next, in the second column, What I Want to Know, list down your learning goals or questions. Use text boxes or sticky notes to capture inquiries like what, why, how, etc. This helps guide the learning process.
Use the third column, What I Learned, to summarize newly gained knowledge after the lesson. Use color-coded highlights or connectors to link answers back to earlier questions, improving visual clarity and understanding.
Enhance your KWL chart with images, illustrations, or graphics using the built-in Google image search or by importing them into the workspace. Embed links, documents, and articles with in-app previews to provide deeper context.
Collaborate with your team and share the KWL chart online with ease. With live mouse-tracking, version history, and third-party app integrations, Creately makes real-time teamwork seamless.
Export or embed your KWL chart in formats like PNG, SVG, JPEG, or PDF, or embed it into articles, blogs, LMS platforms, or documentation using a secure shareable link.