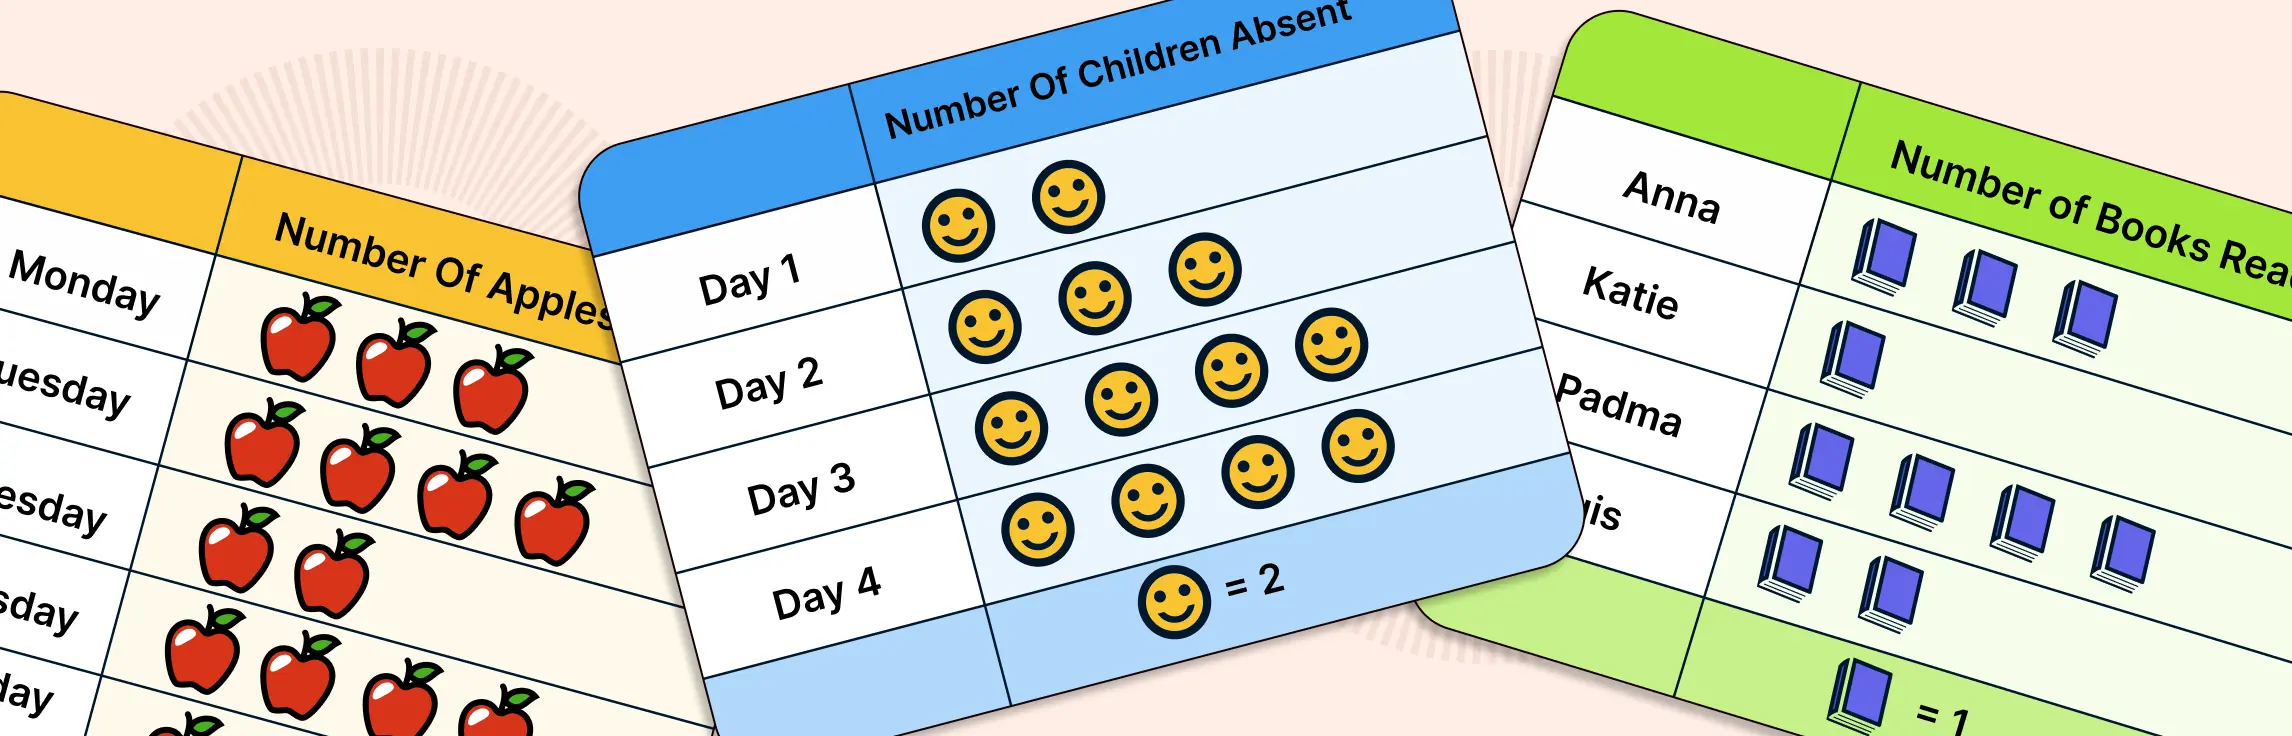
Data visualization is the process of presenting data in a graphical or pictorial format, such as charts, graphs, maps, diagrams or infographics. Data visualization can help you communicate complex information, discover patterns and trends, and make better decisions.
But data visualization is not a simple task. It requires a lot of skills and knowledge, such as choosing the right type of visualization, selecting the appropriate data sources, cleaning and processing the data, designing the layout and aesthetics, and interpreting the results.
That’s where artificial intelligence (AI) can help. AI is the branch of computer science that deals with creating machines or systems that can perform tasks that normally require human intelligence, such as learning, reasoning, and problem-solving.
Incorporating AI into Data Visualization
Automating the data preparation and analysis process, saving you time and effort of cleaning, transforming, or aggregating the data manually.
Generating insights and recommendations based on the data, helping you understand their meaning and implications. Using AI you can even determine what actions you can take based on the information. AI uses advanced algorithms and models to find patterns, trends, outliers, and correlations in the data, and suggests the best ways to optimize your outcomes.
Creating interactive and dynamic visualizations that respond to user inputs and feedback, allowing you to explore the data from different angles and perspectives.
Personalizing the visualizations based on your preferences, goals, and context, making them more relevant and engaging. You can use different prompts to generate various types of charts, layouts and themes to suit your requirements.
Benefits of Using AI for Data Visualization
Improving the quality and accuracy of the visualizations, reducing errors and biases.
Increasing the efficiency and productivity of the data visualization process, enabling you to create more visualizations in less time.
Enhancing the creativity and innovation of the visualizations, allowing you to discover new patterns and insights that you might have missed otherwise.
Boosting the impact and influence of the visualizations, making them more persuasive and memorable.
Limitations of Using AI for Data Visualization
Ensuring the trustworthiness and transparency of the AI systems, explaining how they work and why they produce certain results. AI systems should be able to explain how they work and why they produce certain results, especially when they affect human lives and well-being.
Balancing the automation and human intervention of the AI systems, finding the optimal level of control and collaboration between the machine and the user. This means that the AI systems should not replace human judgment or responsibility, but rather augment and support them.
Dealing with ethical and social issues related to the AI systems, such as privacy, security, fairness, and accountability.
How Creately Helps Visualize Data
Creately gives teams a visual workspace to turn information, ideas, and research into diagrams, frameworks, boards, and structured views. Instead of keeping data scattered across documents, spreadsheets, and meeting notes, teams can bring everything into one canvas, organize it visually, and use in-app AI assistance where helpful to make sense of complex information.
With Creately, you can:
Organize Information Visually
Use diagrams, tables, mind maps, flowcharts, Kanban boards, timelines, and other visual formats to structure information in a way that is easier to understand and discuss.
Start With Ready-Made Frameworks
Use templates for SWOT analysis, business model canvas, user journey maps, process flows, priority grids, and other frameworks to organize information without starting from scratch.
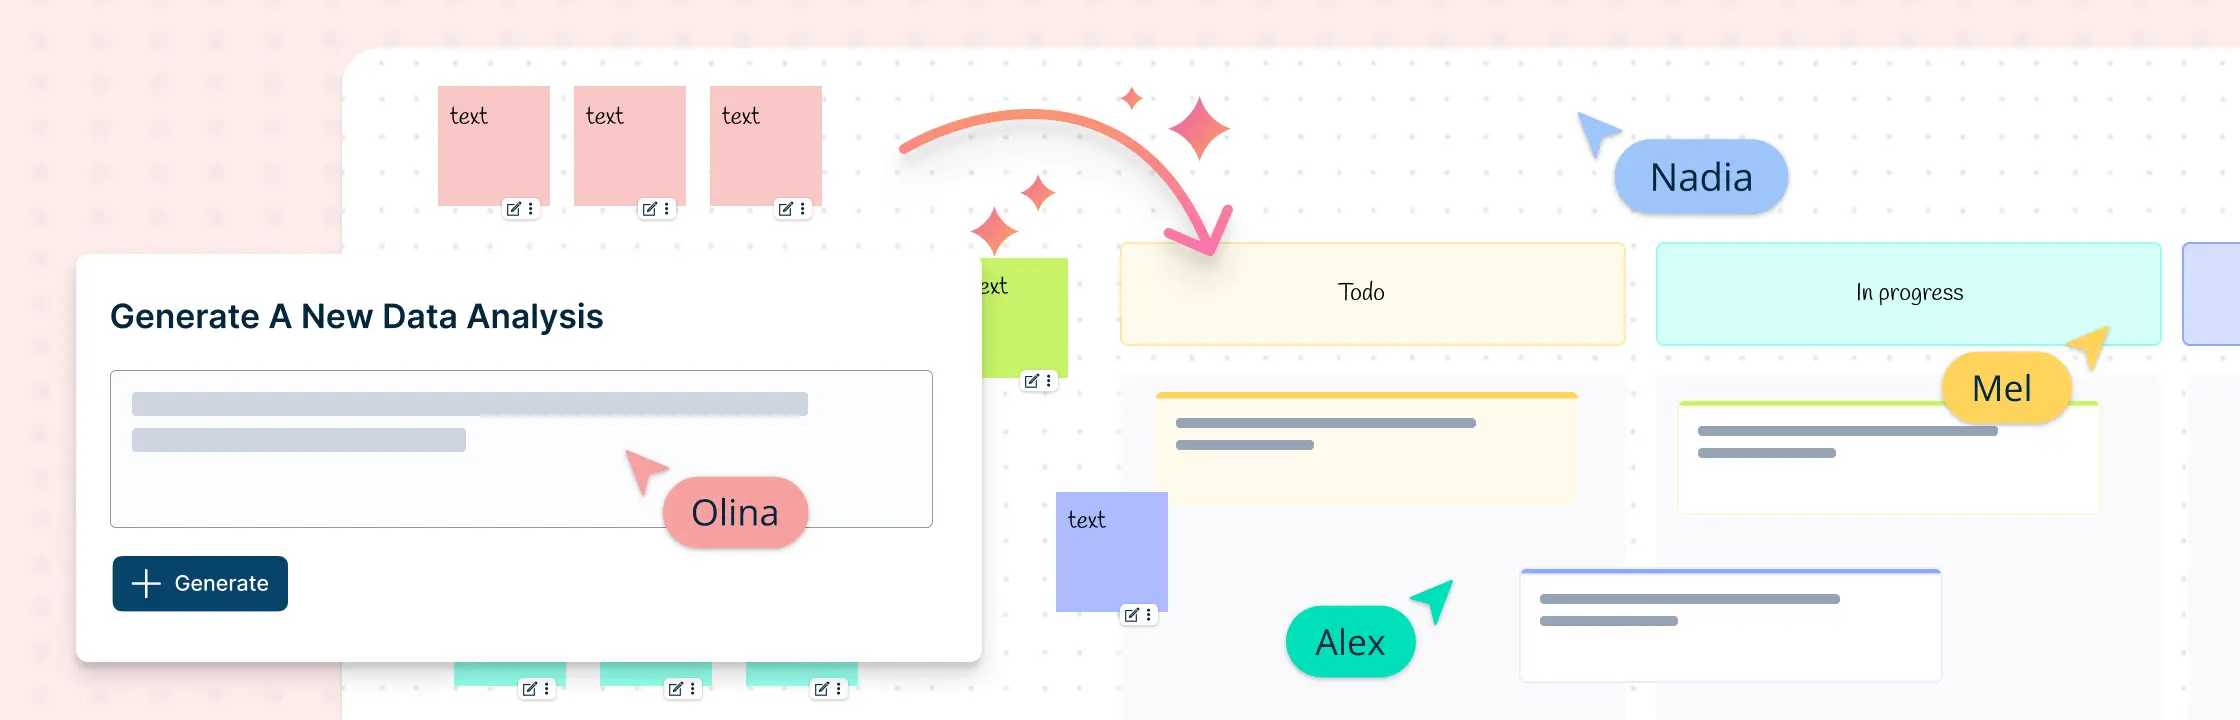
Expand and Refine Ideas With AI Assistance
Use in-app AI assistance to expand ideas, refine wording, explore counterpoints, or clarify rough inputs as you work on the canvas.
Group Related Information Into Themes
Use AI assistance and visual grouping tools to organize elements by themes, sentiment, priority, category, or custom criteria, helping teams identify patterns and relationships more easily.
View the Same Information From Different Angles
Represent information using different visual formats such as diagrams, boards, timelines, matrices, or task views so teams can compare perspectives and decide what to do next.
Creately helps make information easier to understand by combining visual organization, collaborative workspaces, ready-made frameworks, and in-app AI assistance. Whether you are mapping research, planning a project, analyzing ideas, or preparing a presentation, you can structure information in a way that is easier to review, share, and act on.
Conclusion
Data visualization helps teams communicate complex information more clearly. With Creately, teams can organize information visually, collaborate in one workspace, use structured templates, and apply in-app AI assistance to expand ideas, group related inputs, and identify patterns. This makes it easier to move from scattered data to clearer insights and better decisions.