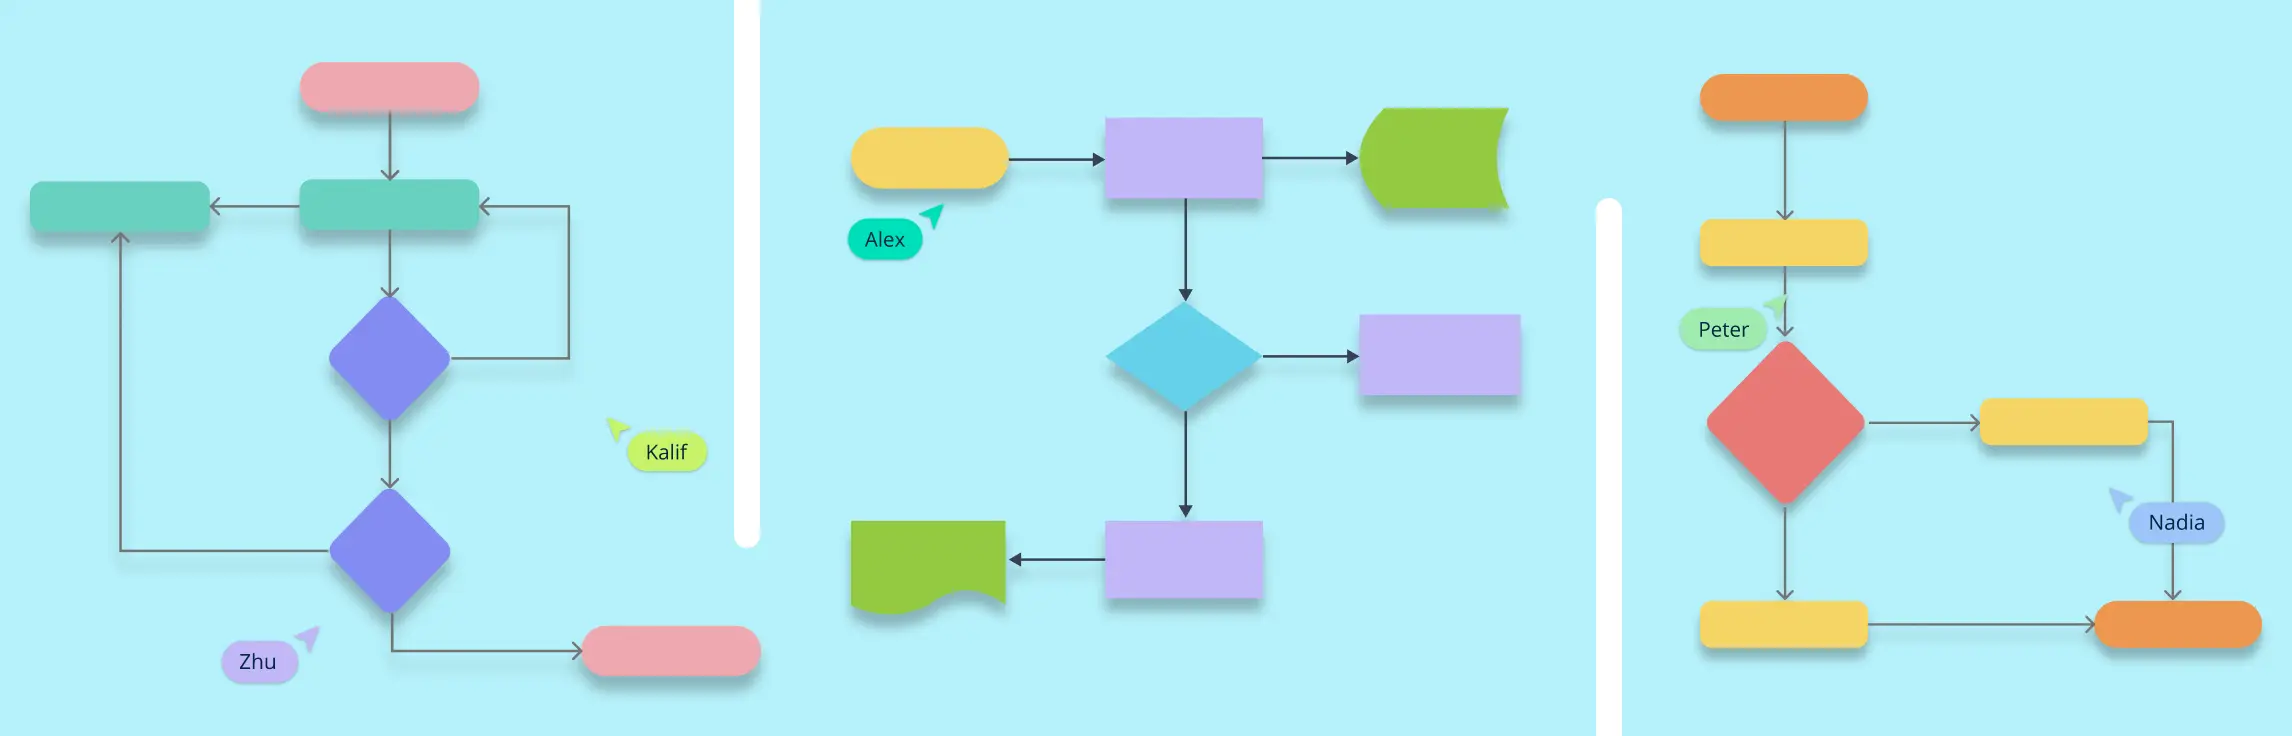
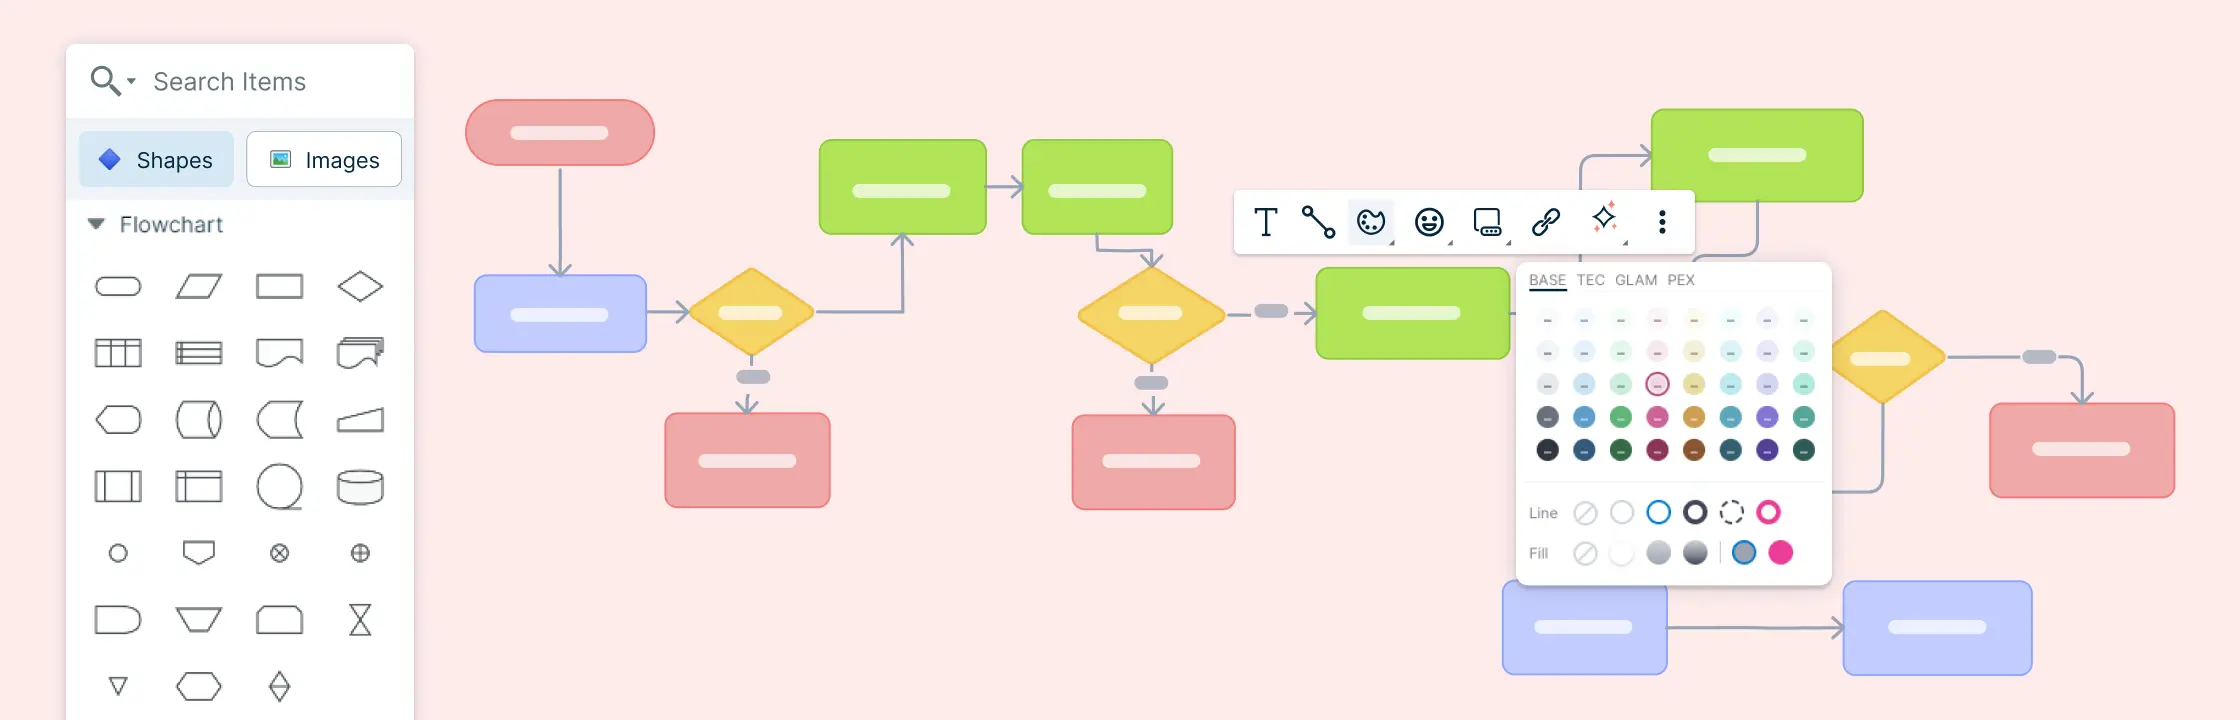
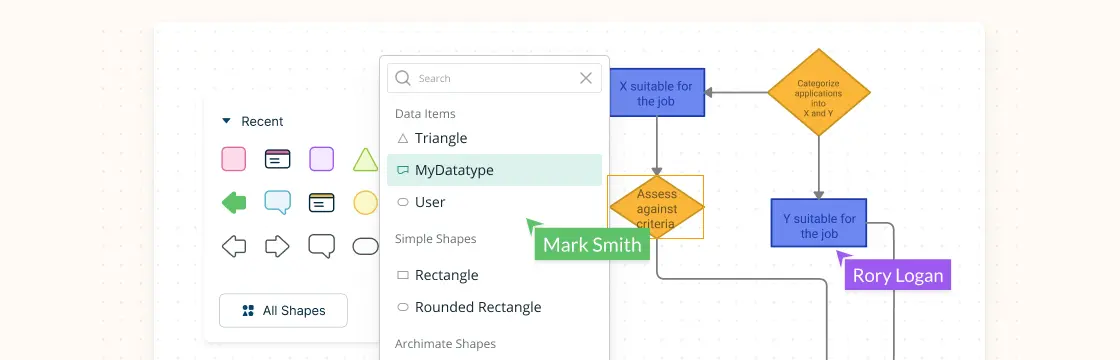
Easily visualize your processes and workflows with smart automation.
Create visual organizational structures with images and detailed profiles.
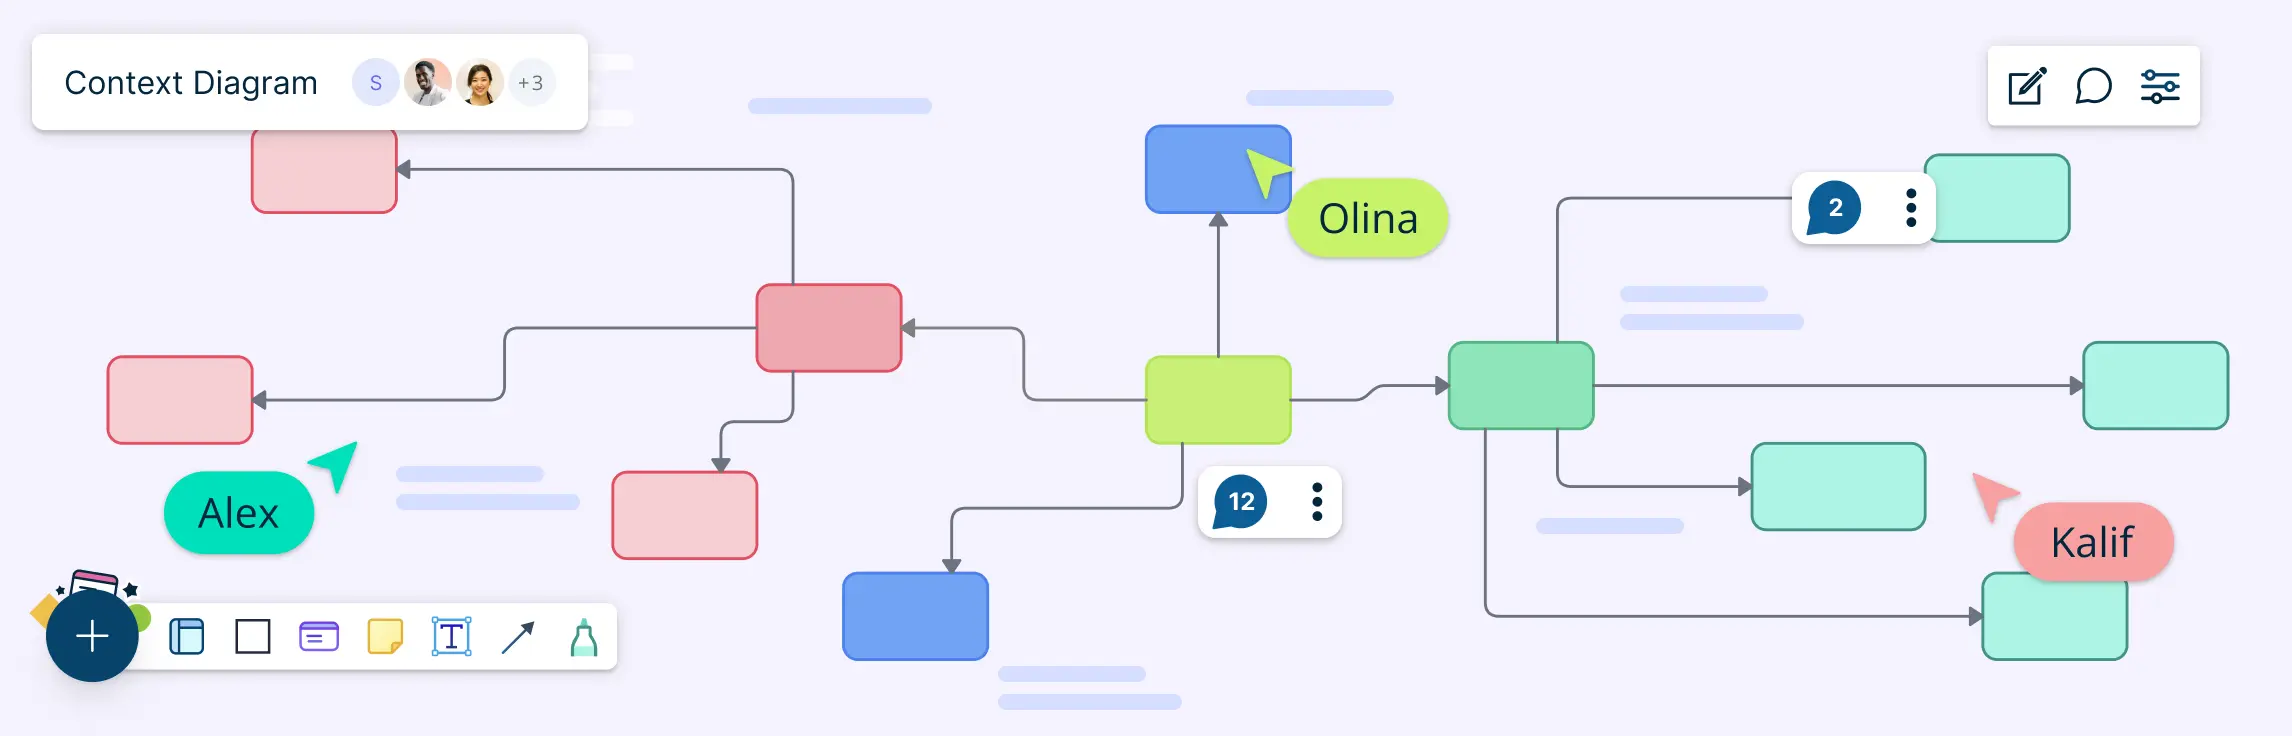
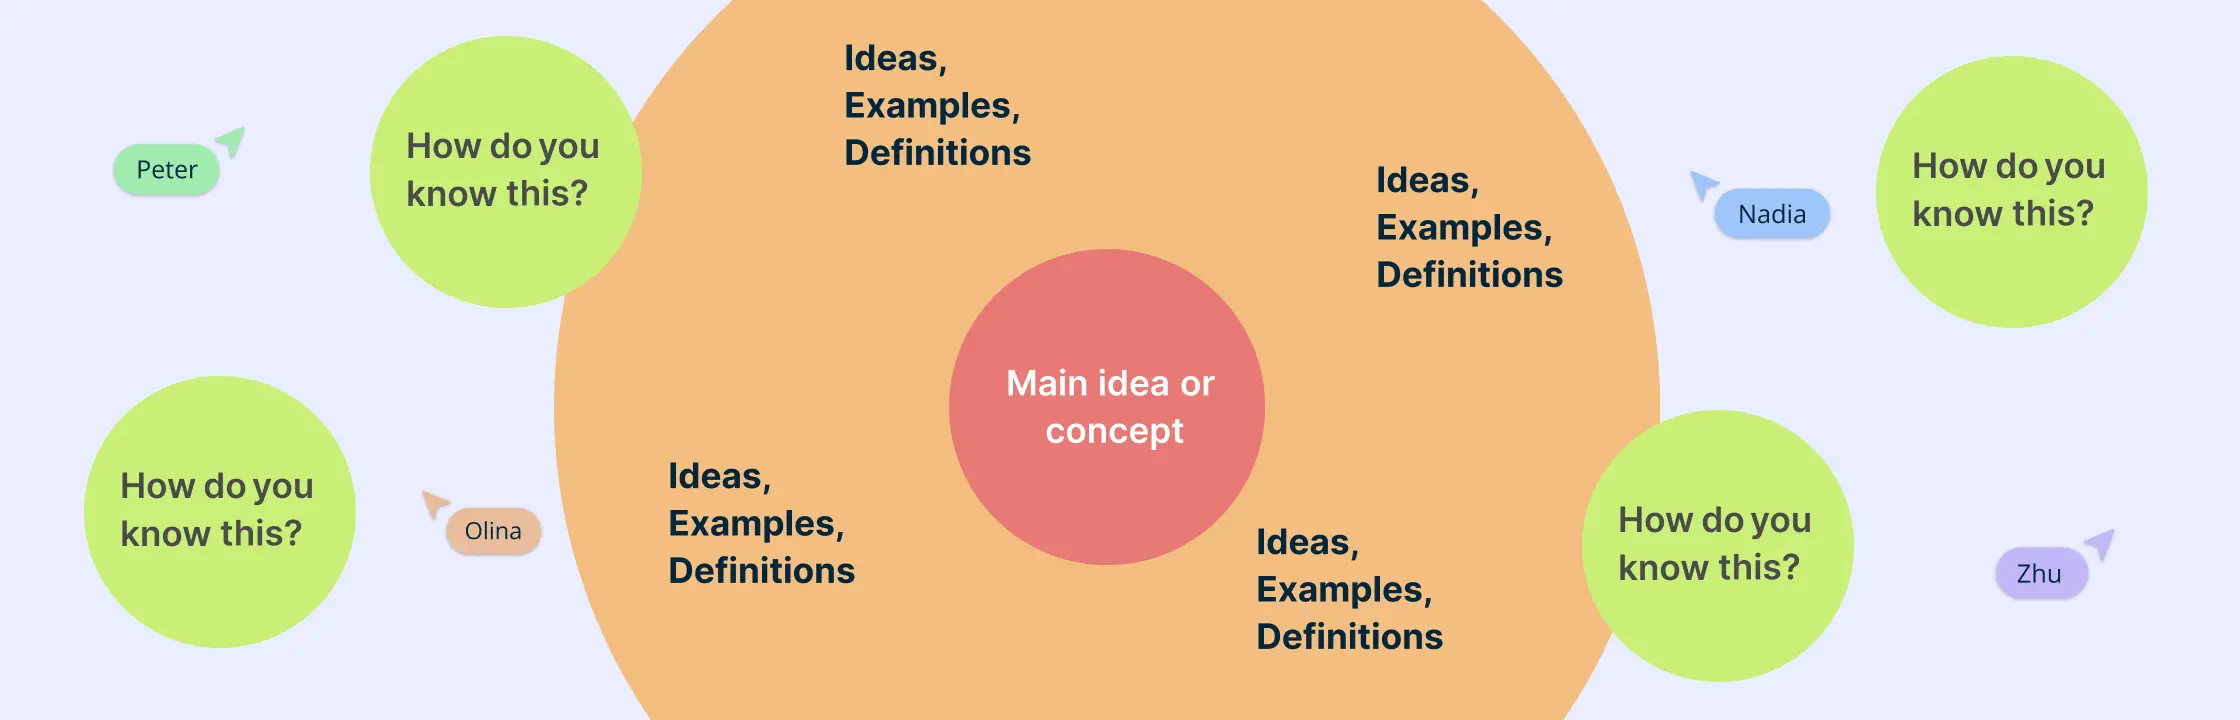
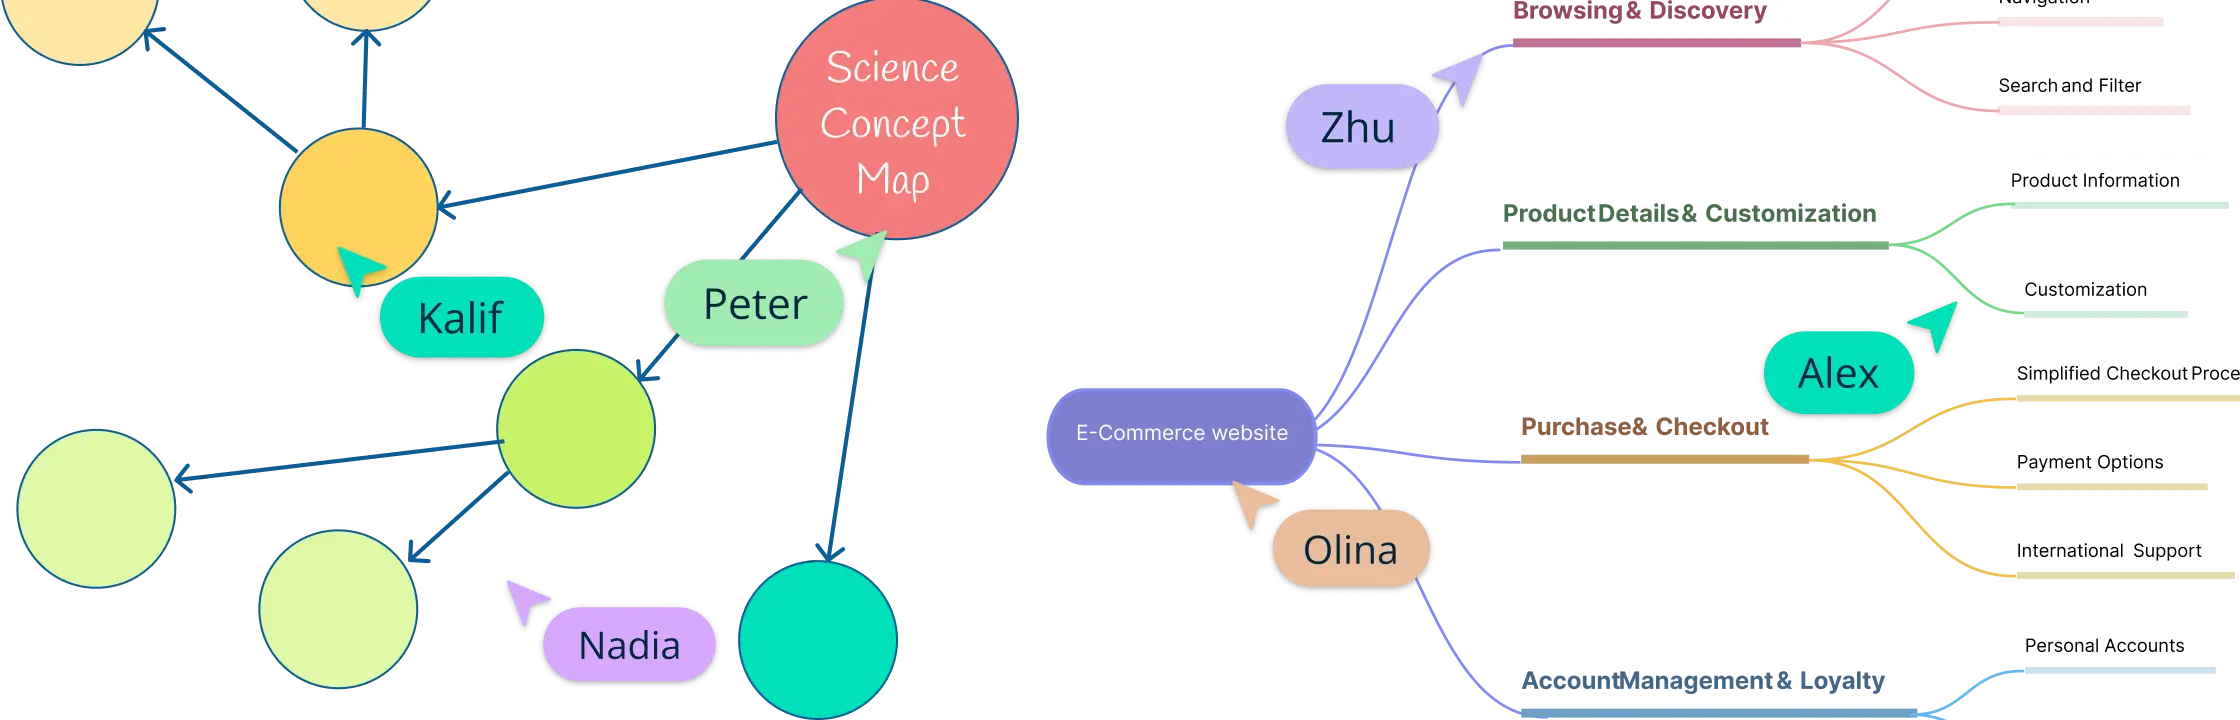
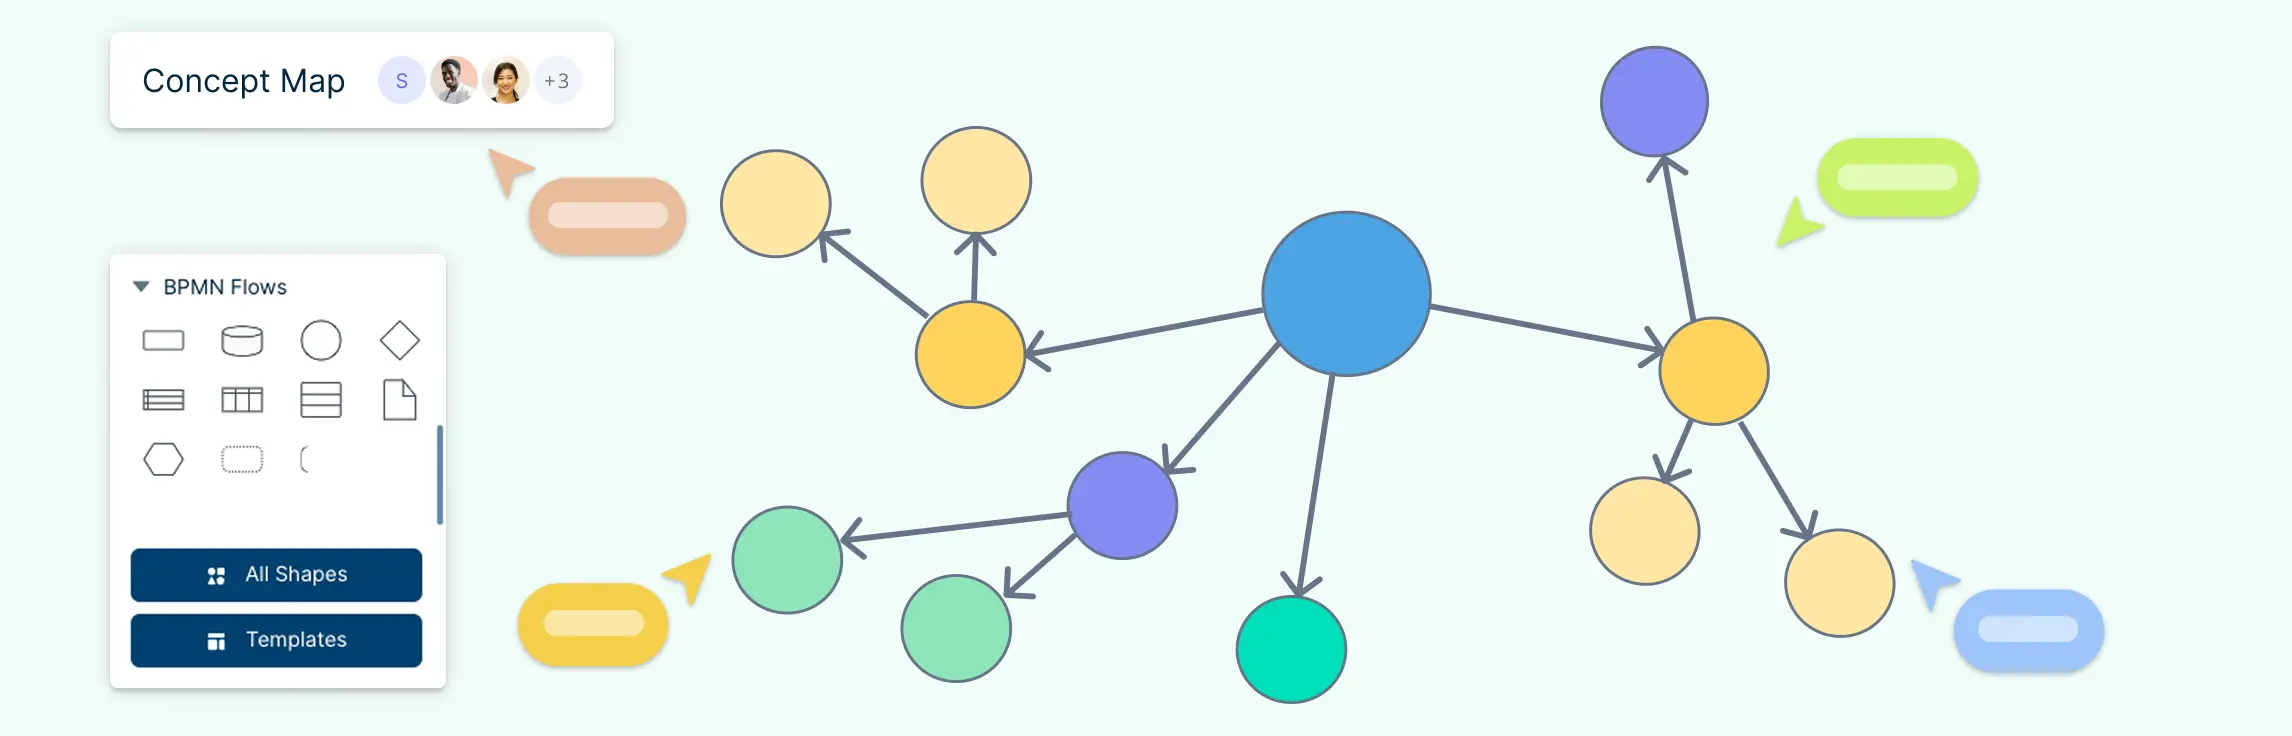
Visualize concepts and their relationships on an infinite visual canvas.
Map family history and understand the relationships with detailed genograms.
Visualize relationships between entities using Crows Foot or Chen notation.
Visualize your network infrastructure. Support AWS, CISCO, Azure and more.
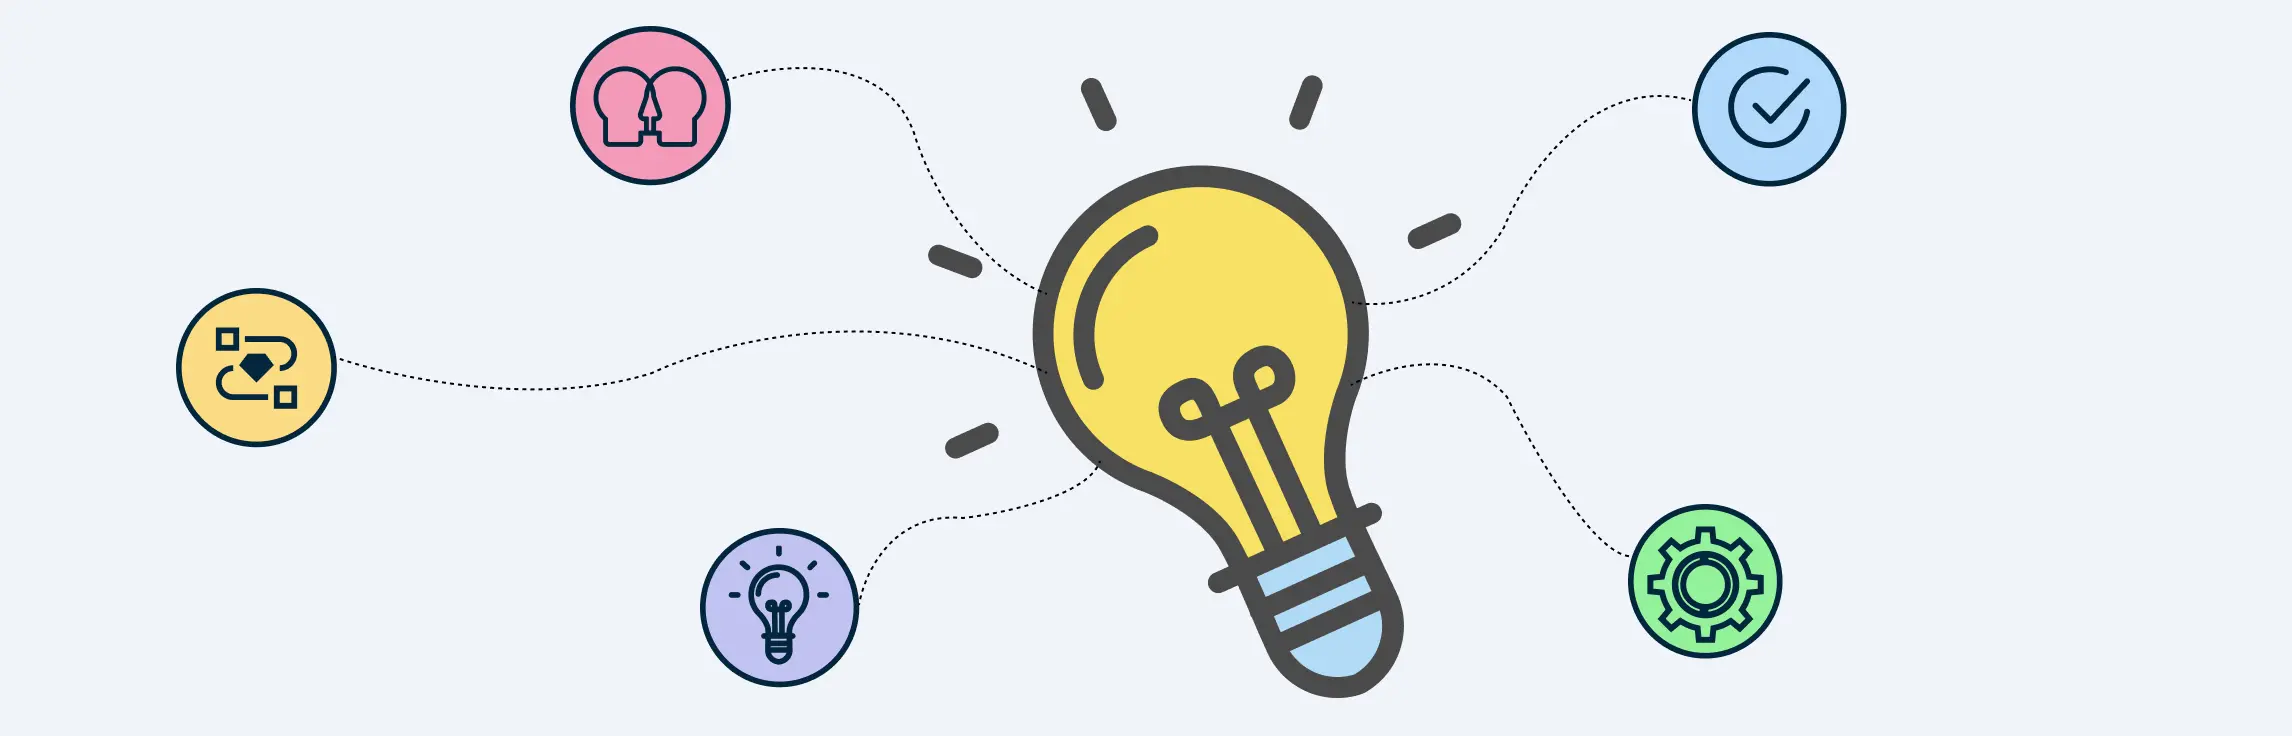
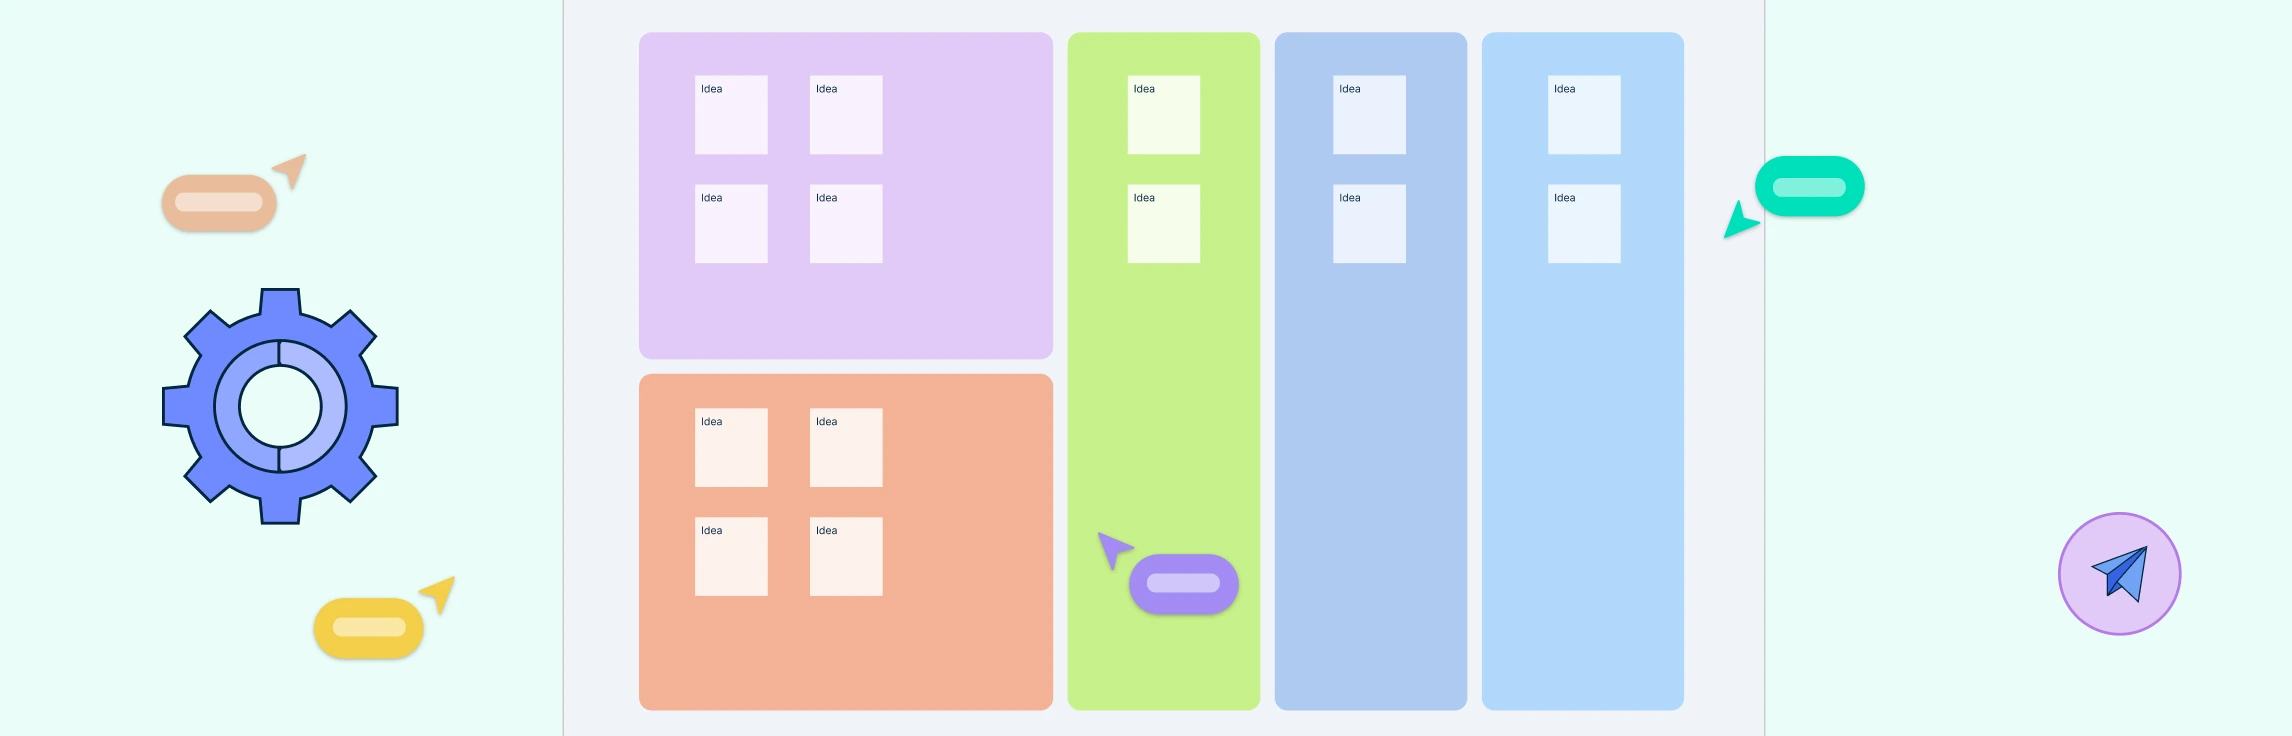
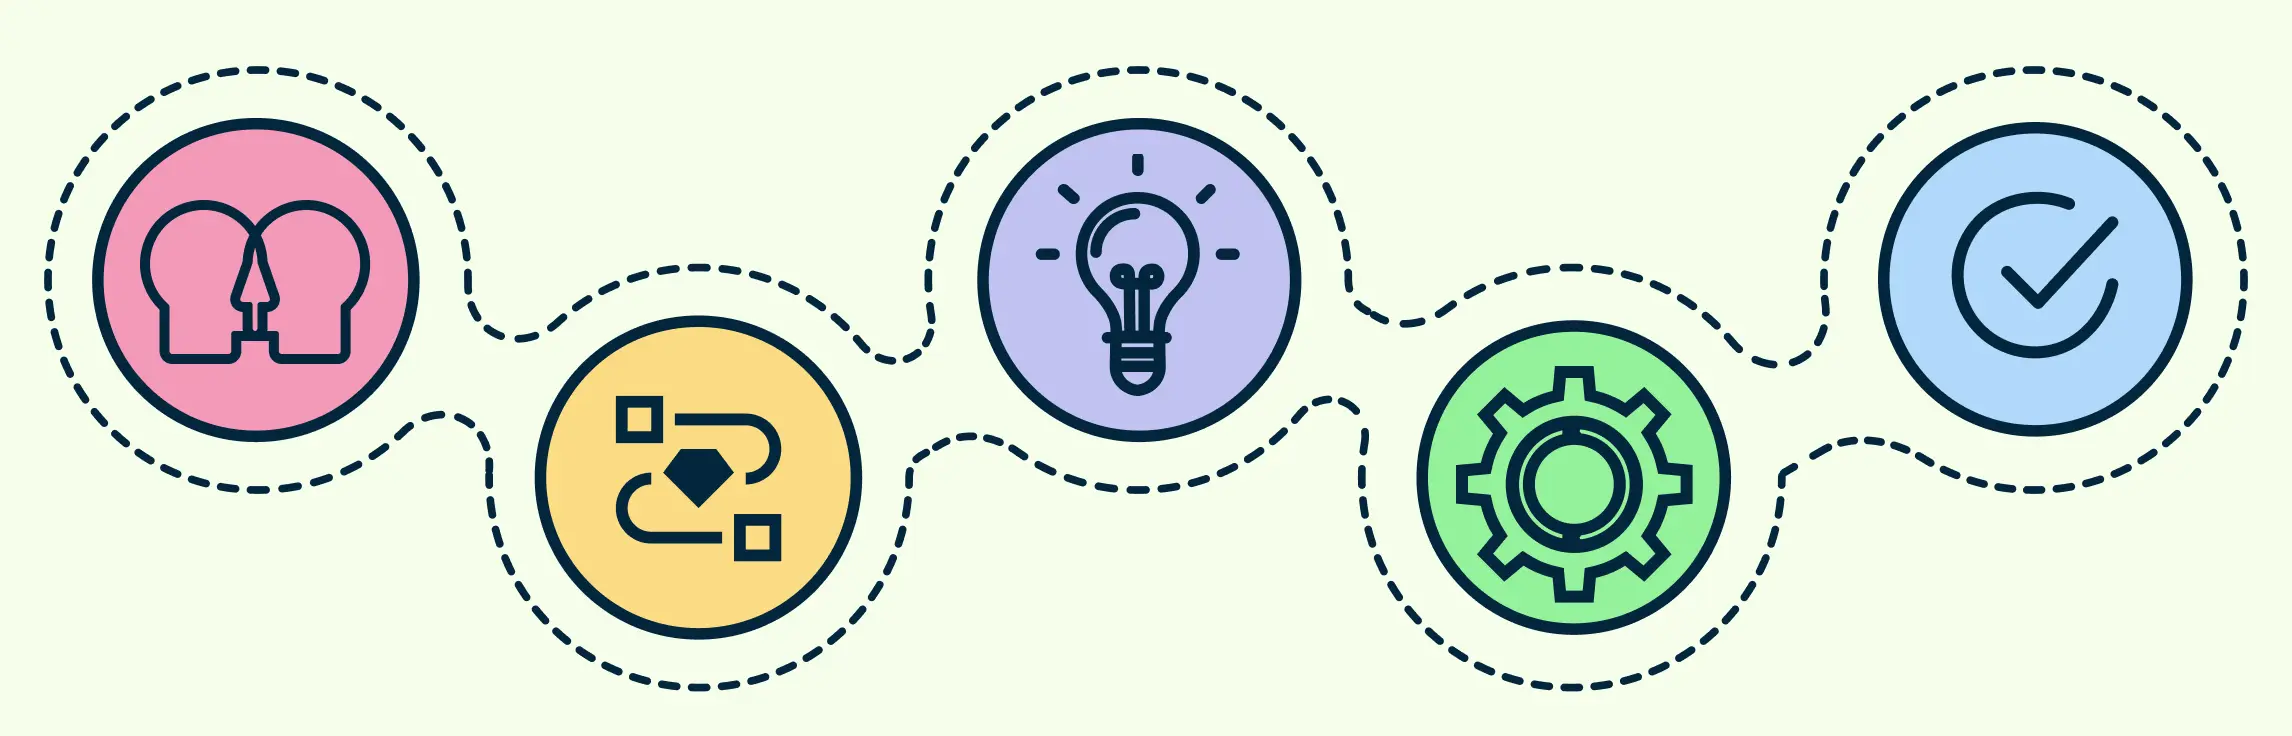
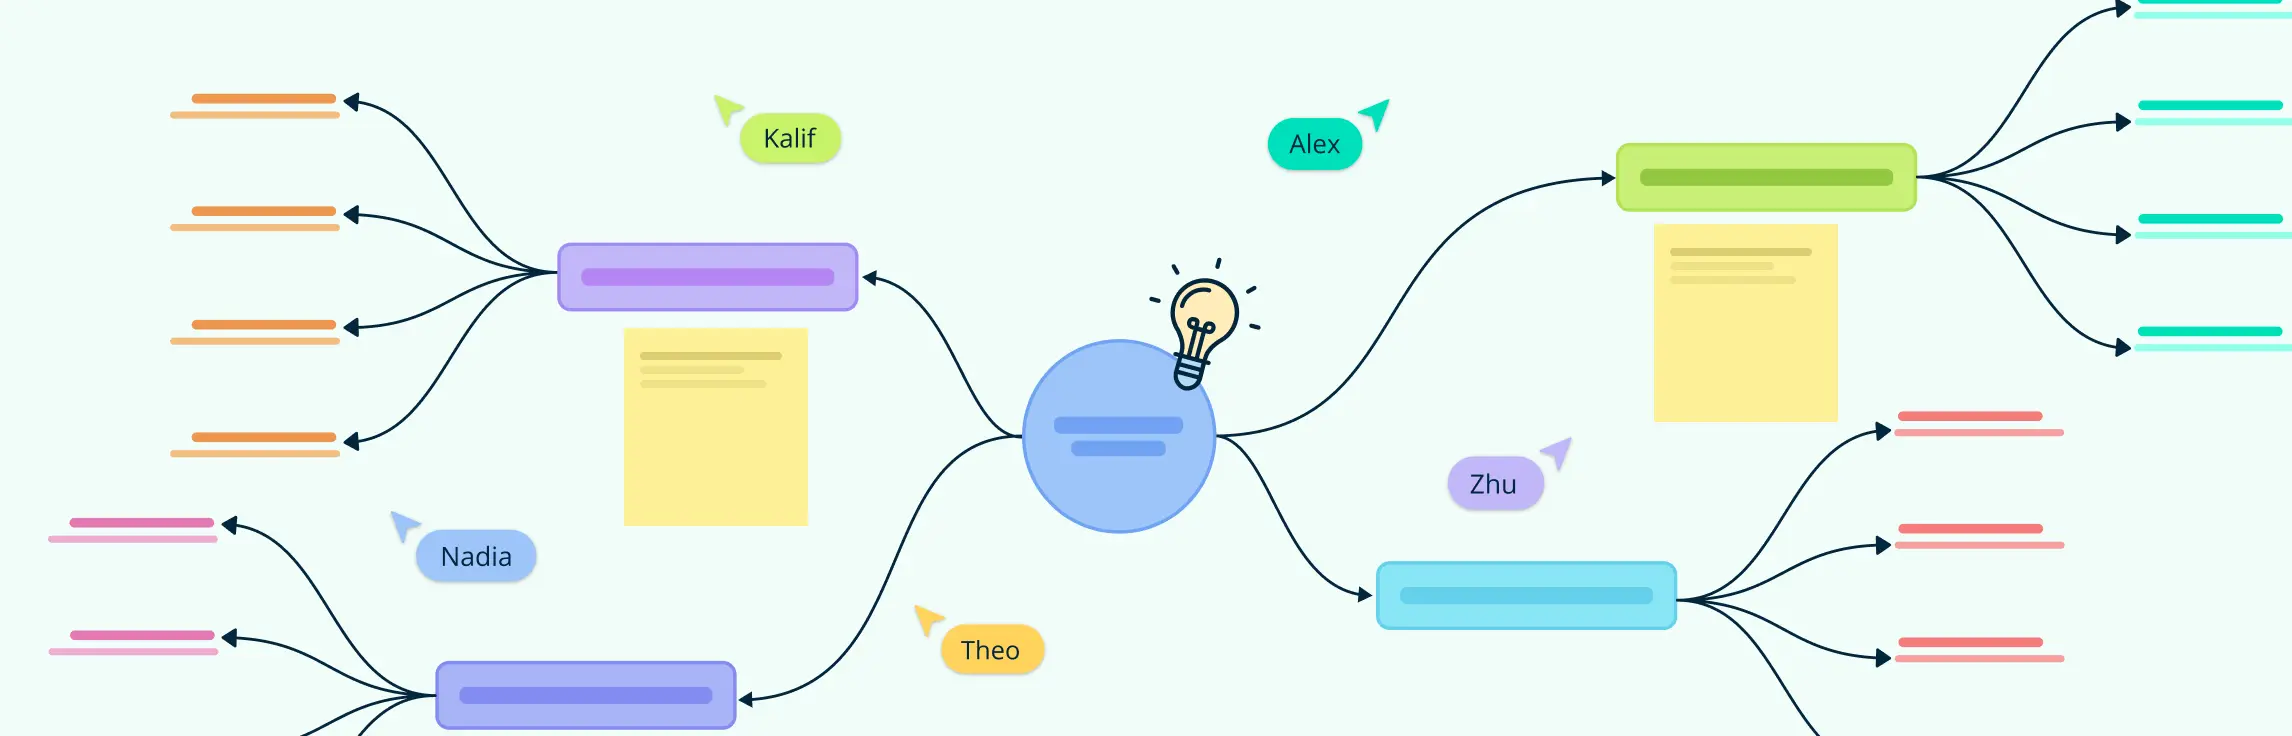
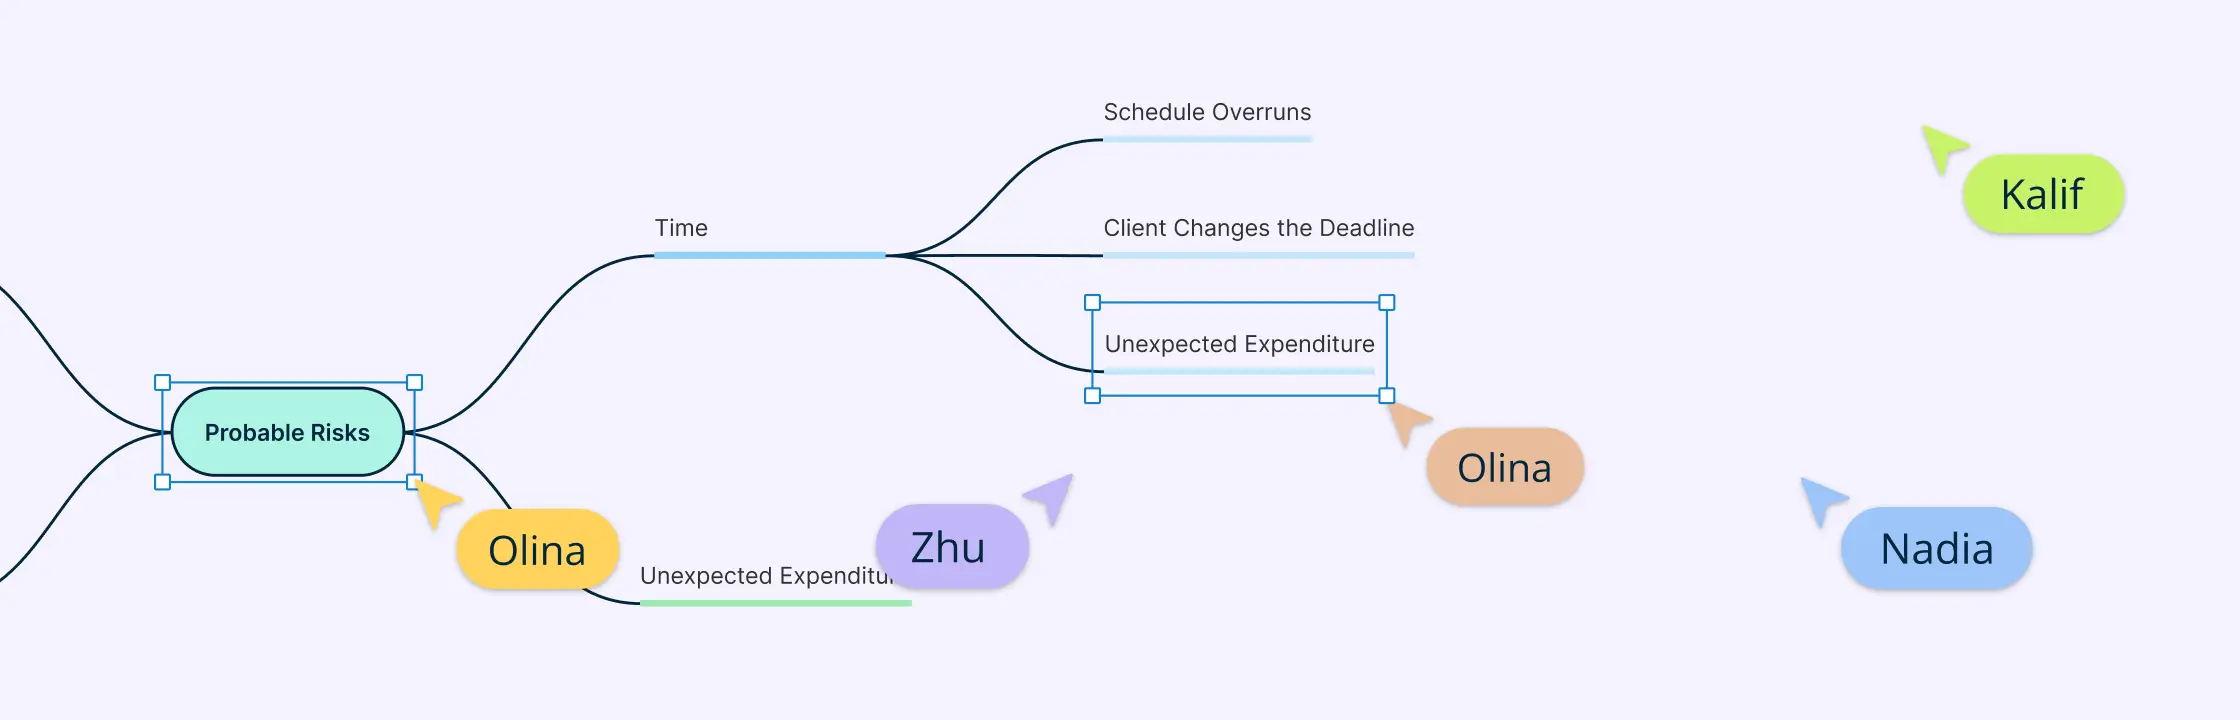
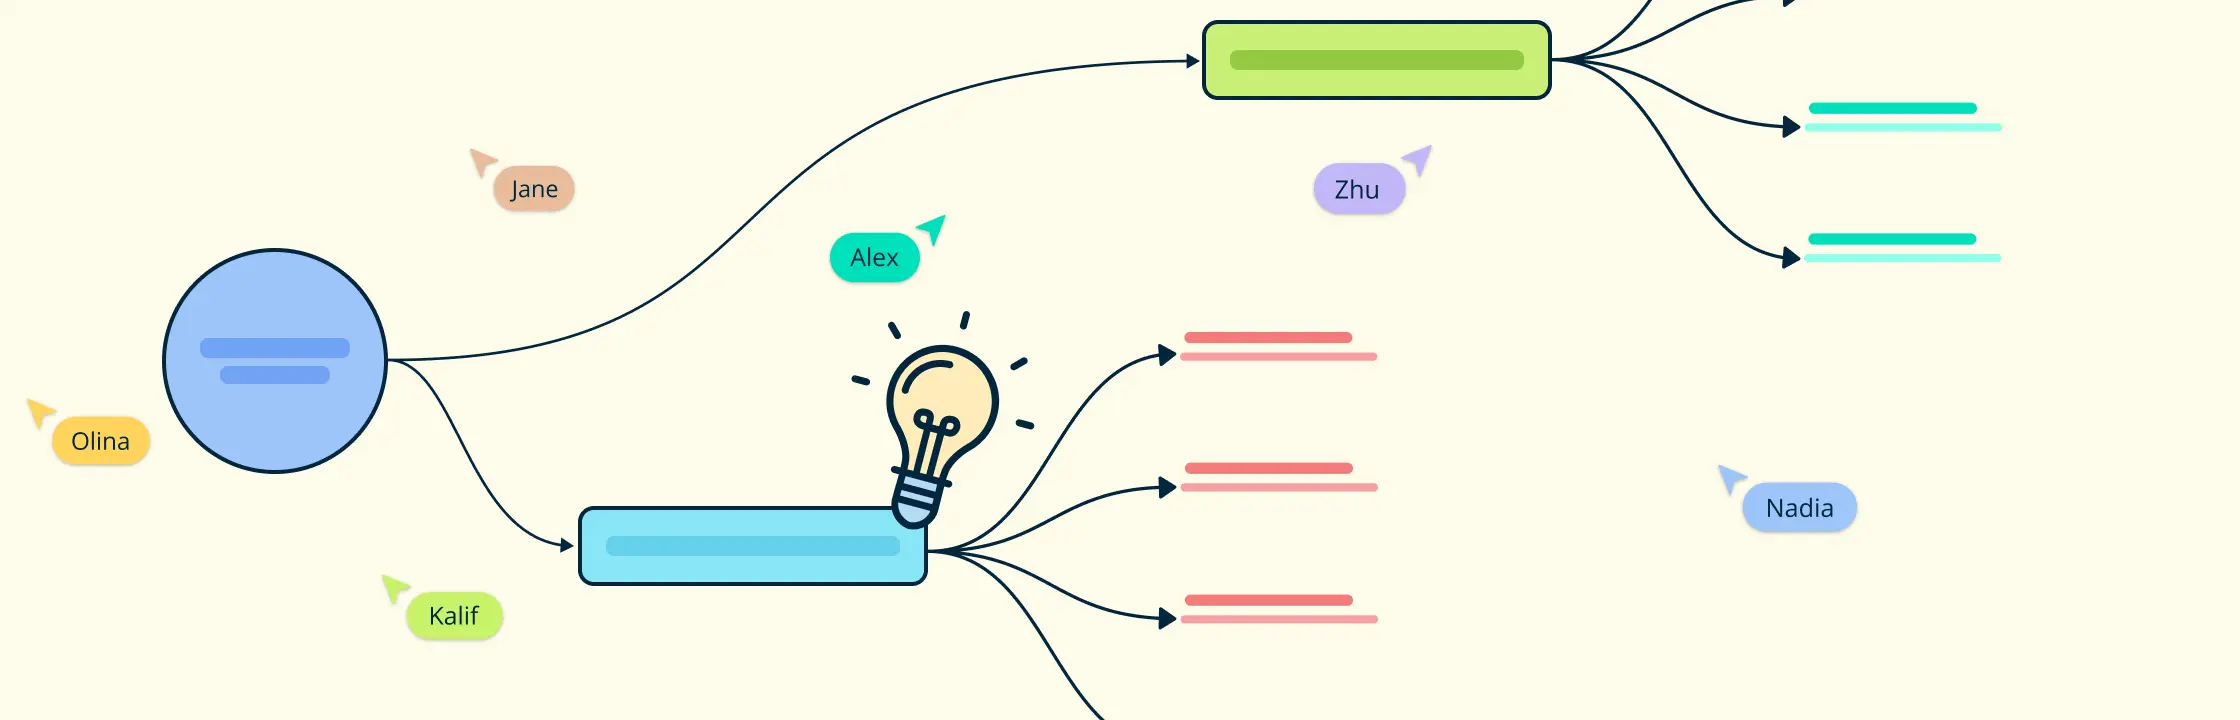
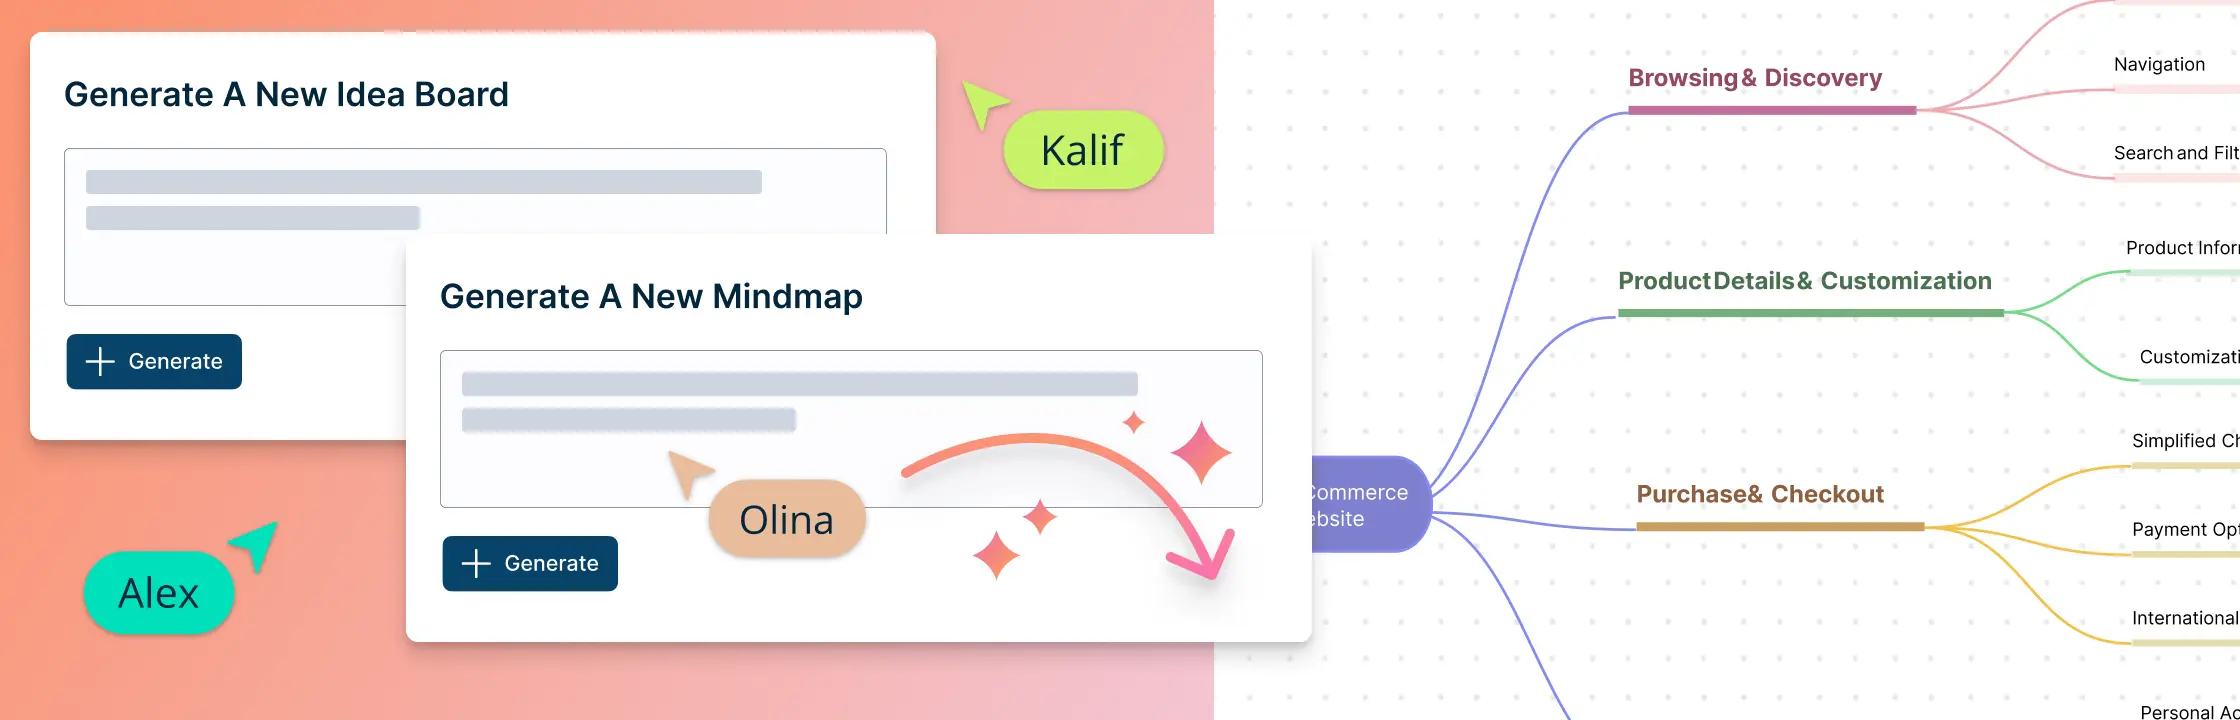
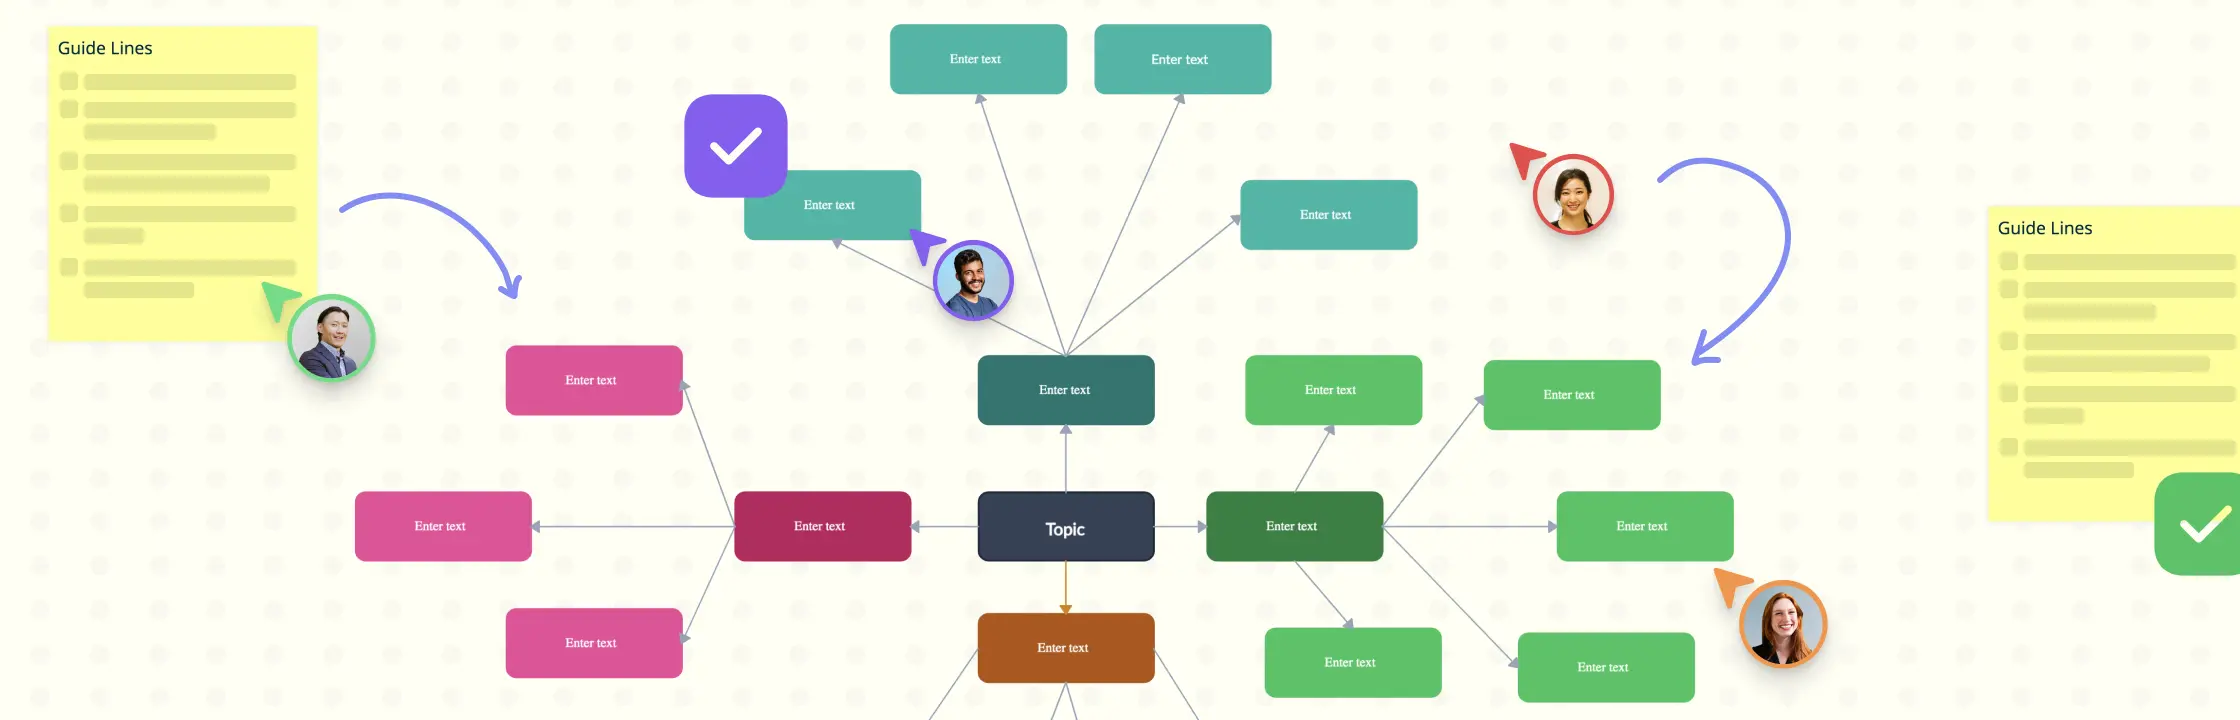
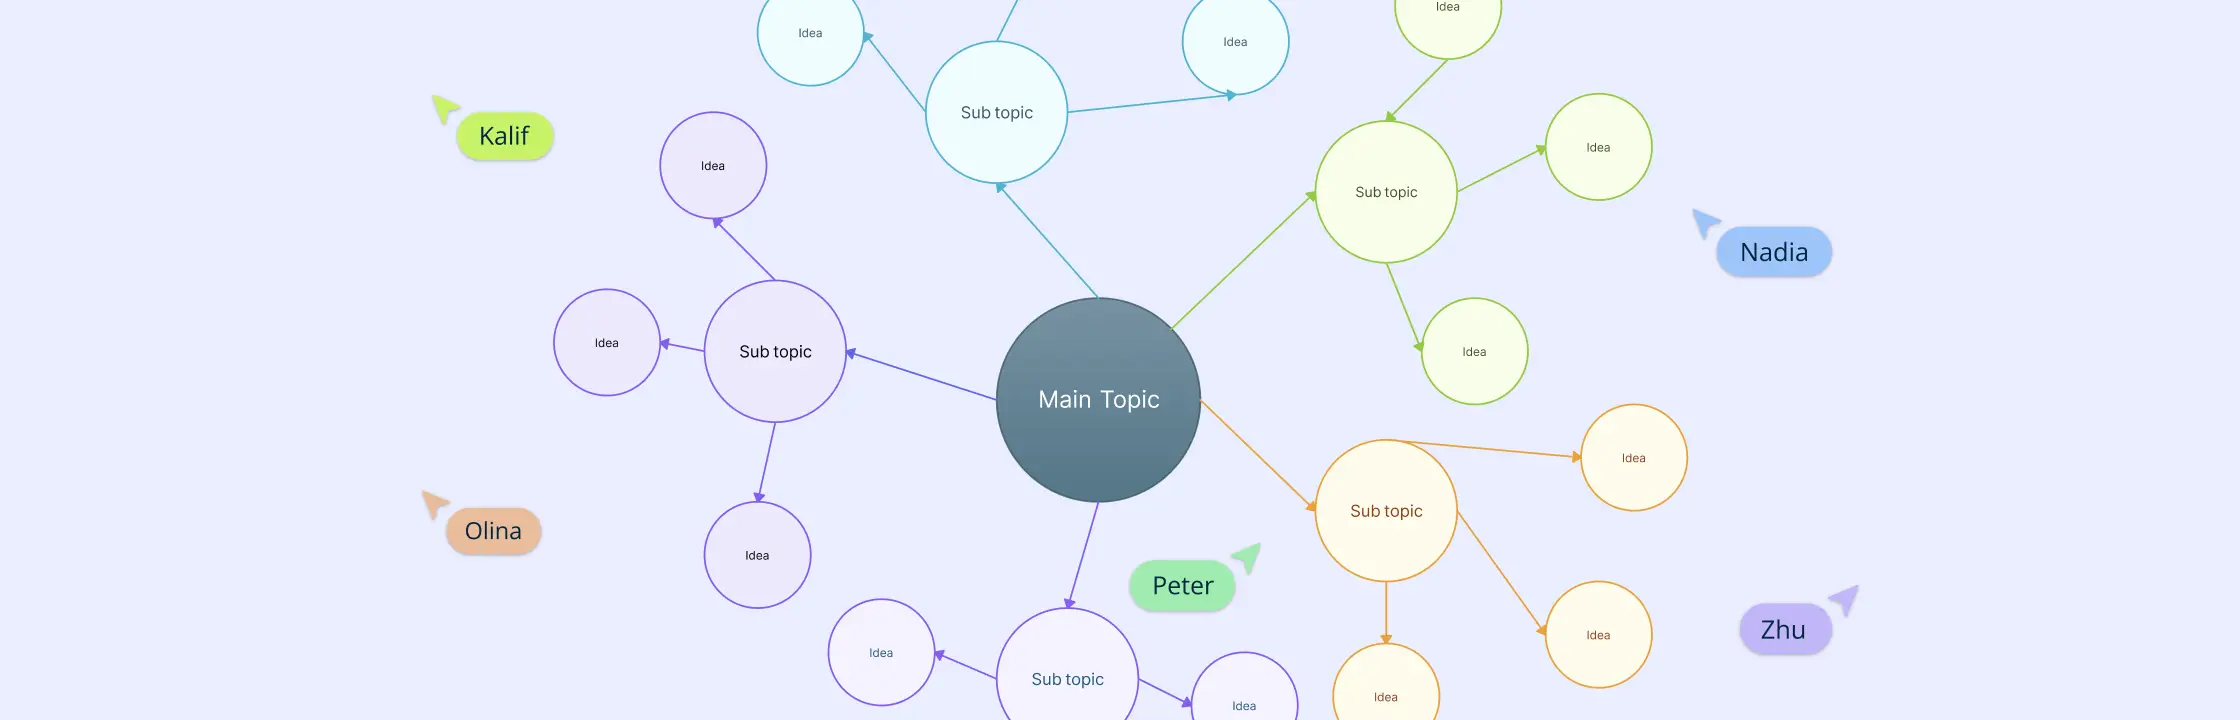
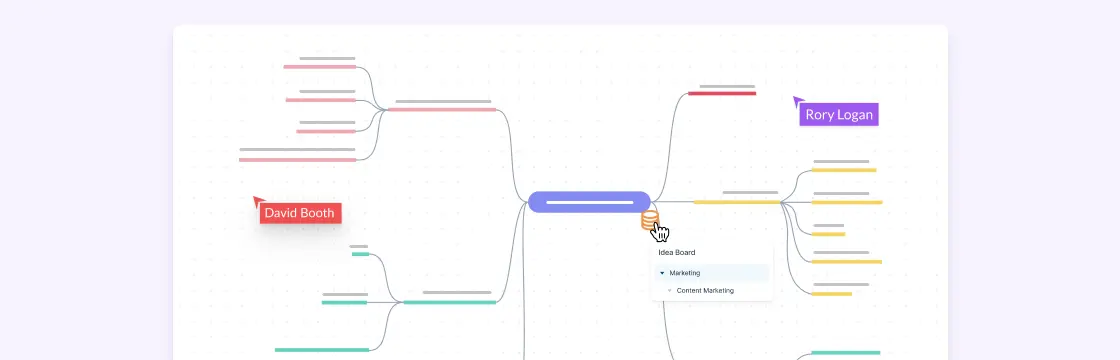
Visualize and expand your ideas using our powerful mind mapping tool.
Easily create family trees with our professionally designed templates.
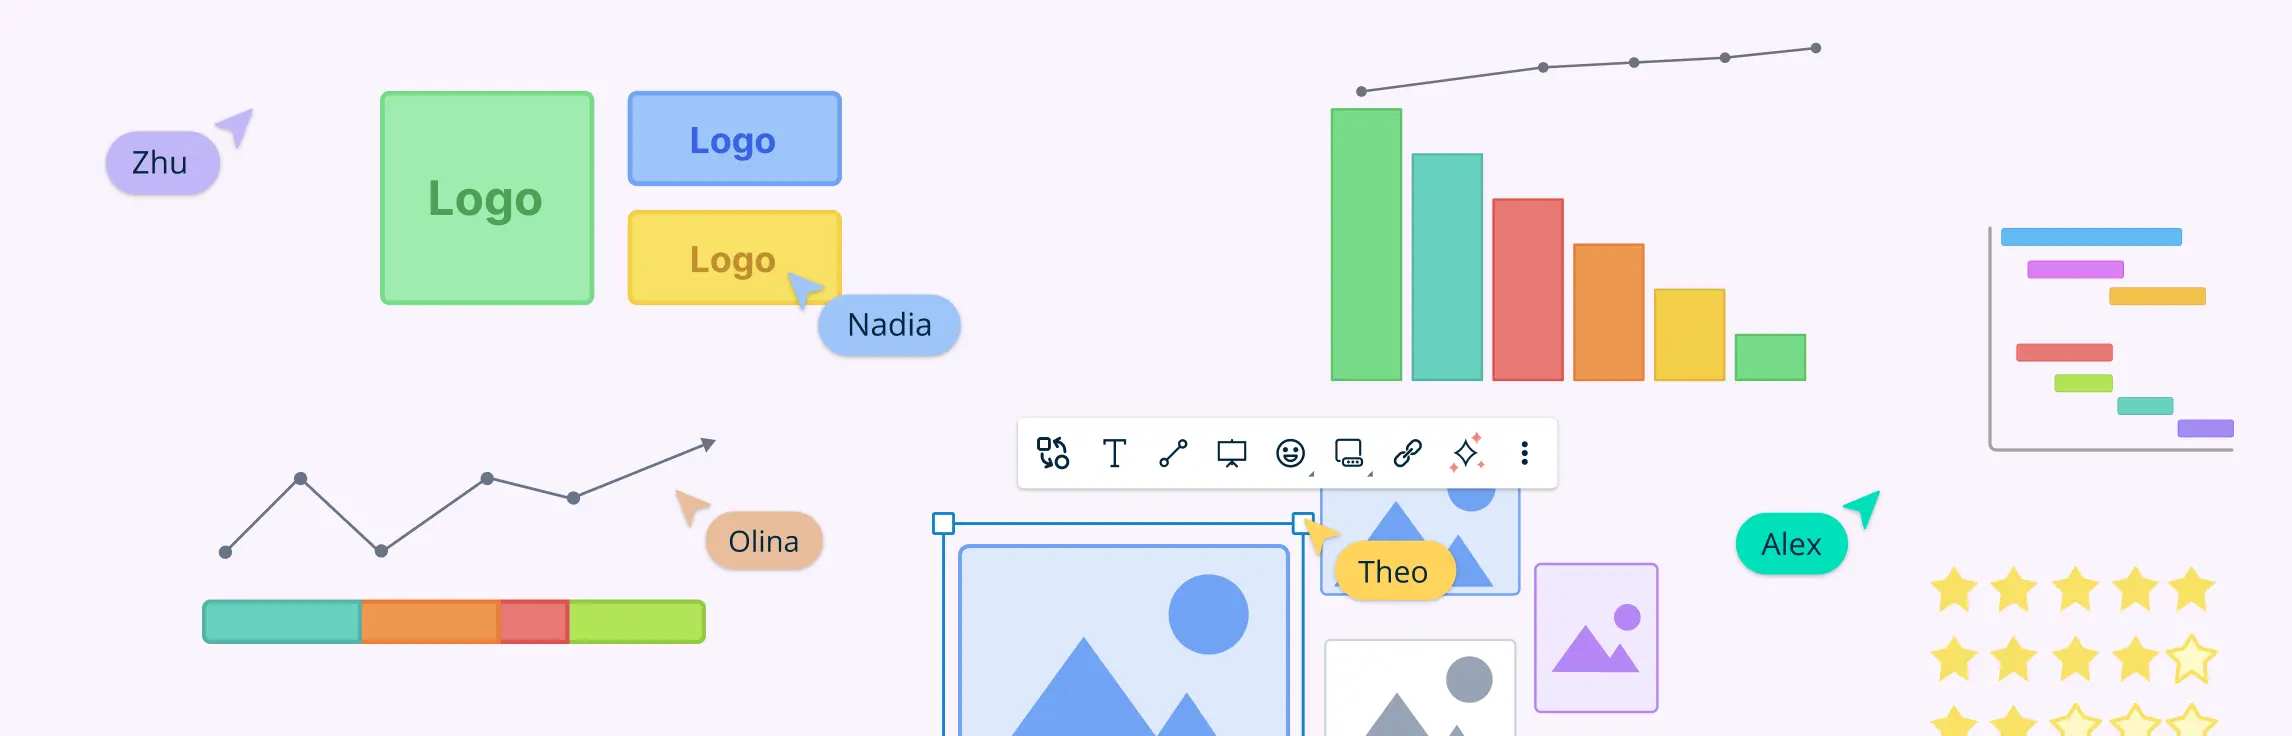
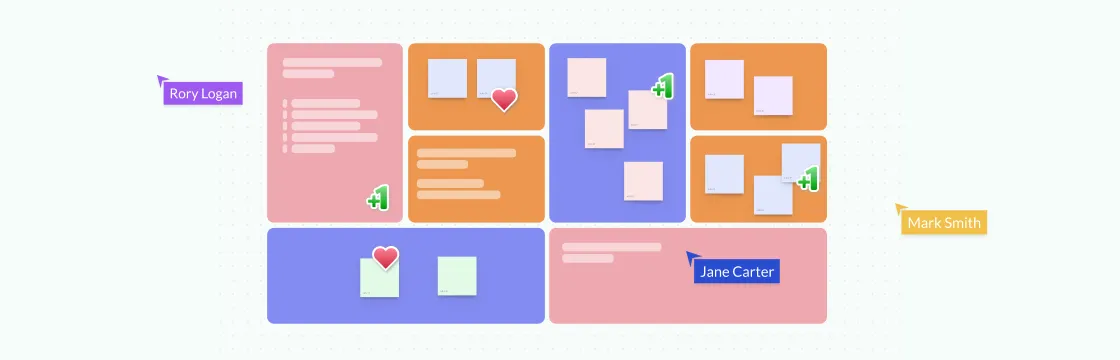
Infinite canvas to add diagrams, images, sticky notes and more.
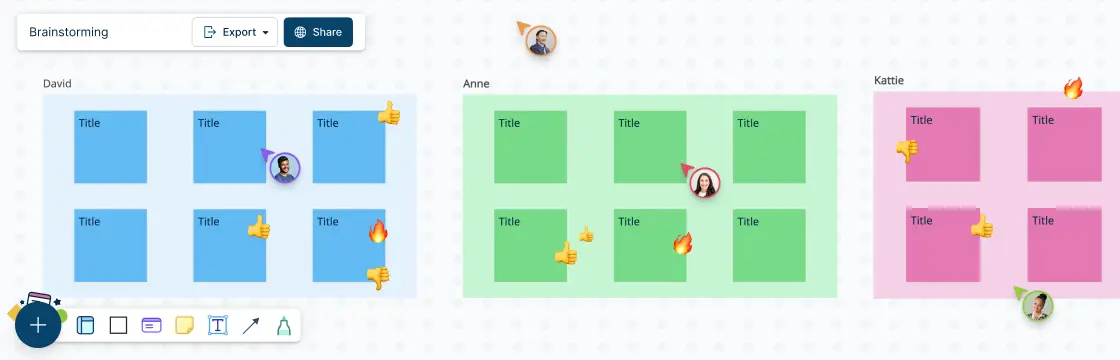
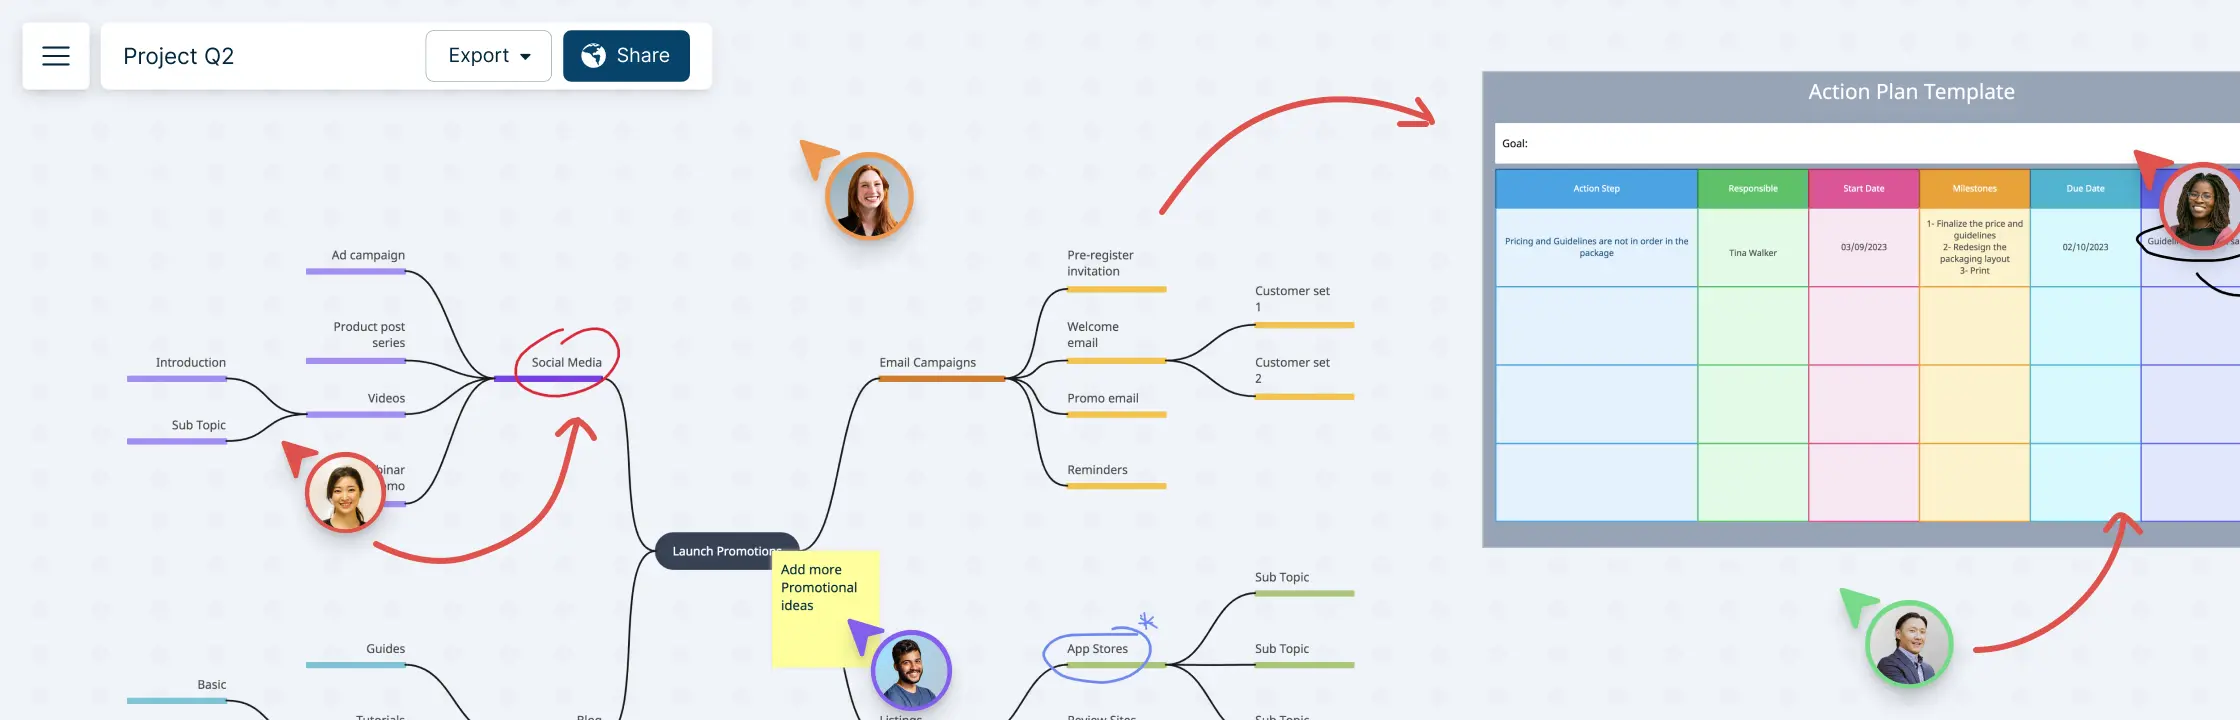
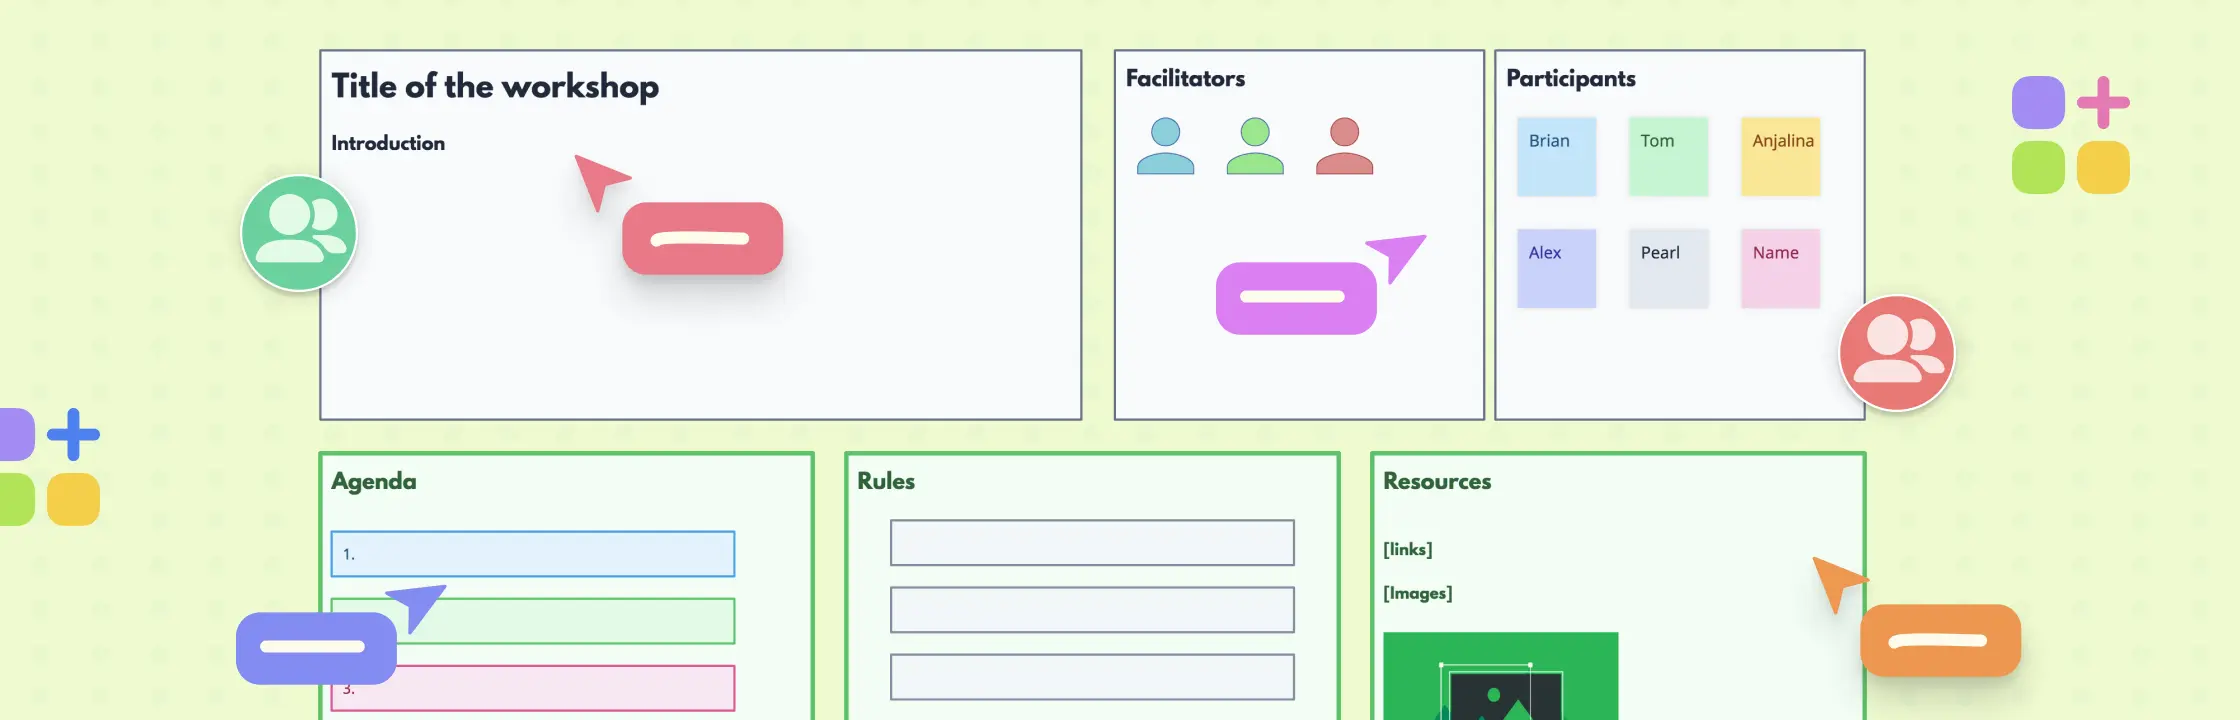
Run collaborative meetings, workshops or brainstorming sessions.
Collaborative diagramming for educators and students at discounted rates.
Generate customizable diagrams with a simple prompting tool.
Log In
Sign Up Free
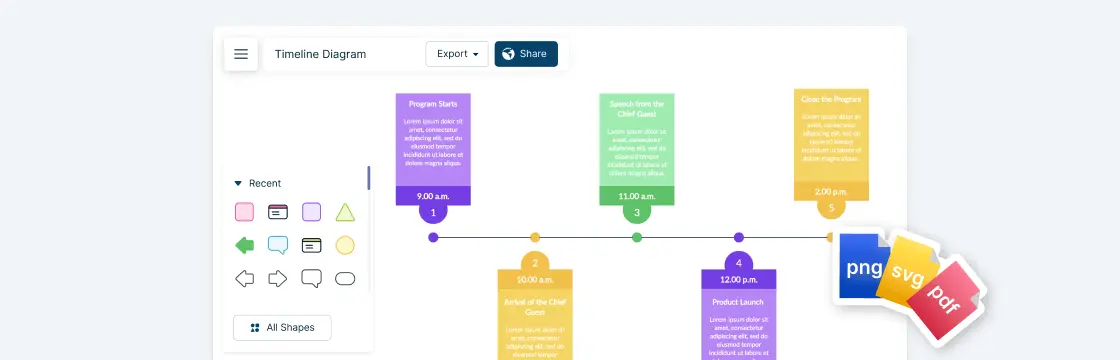
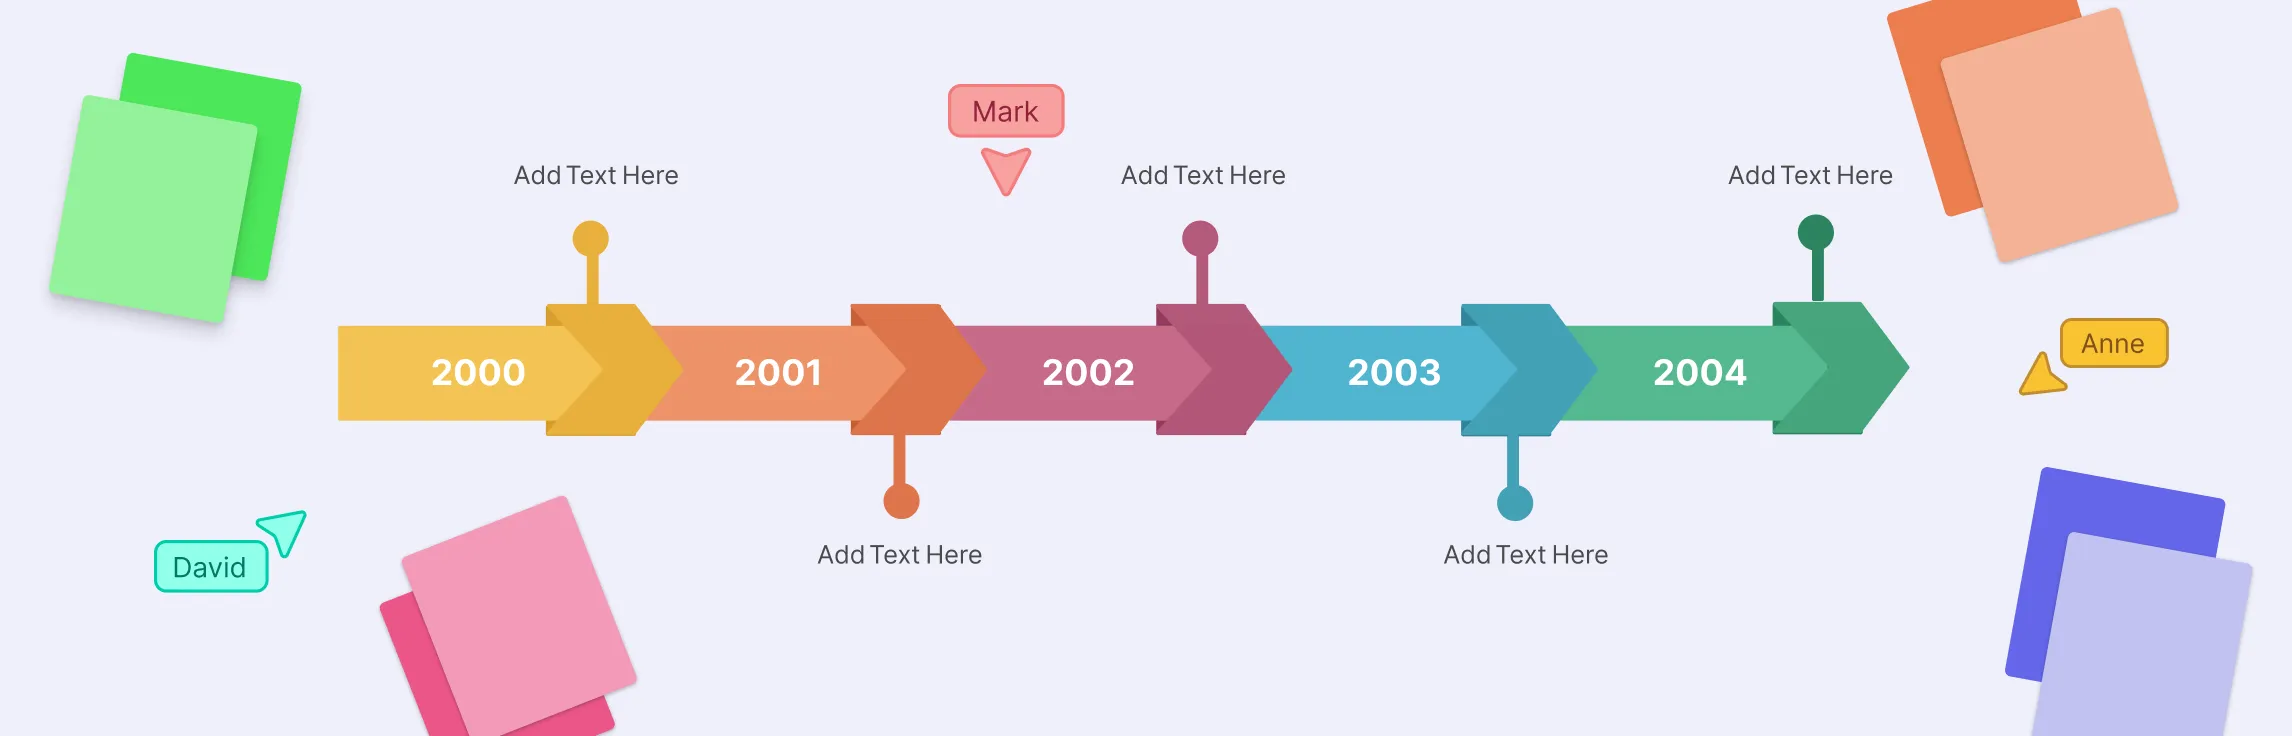
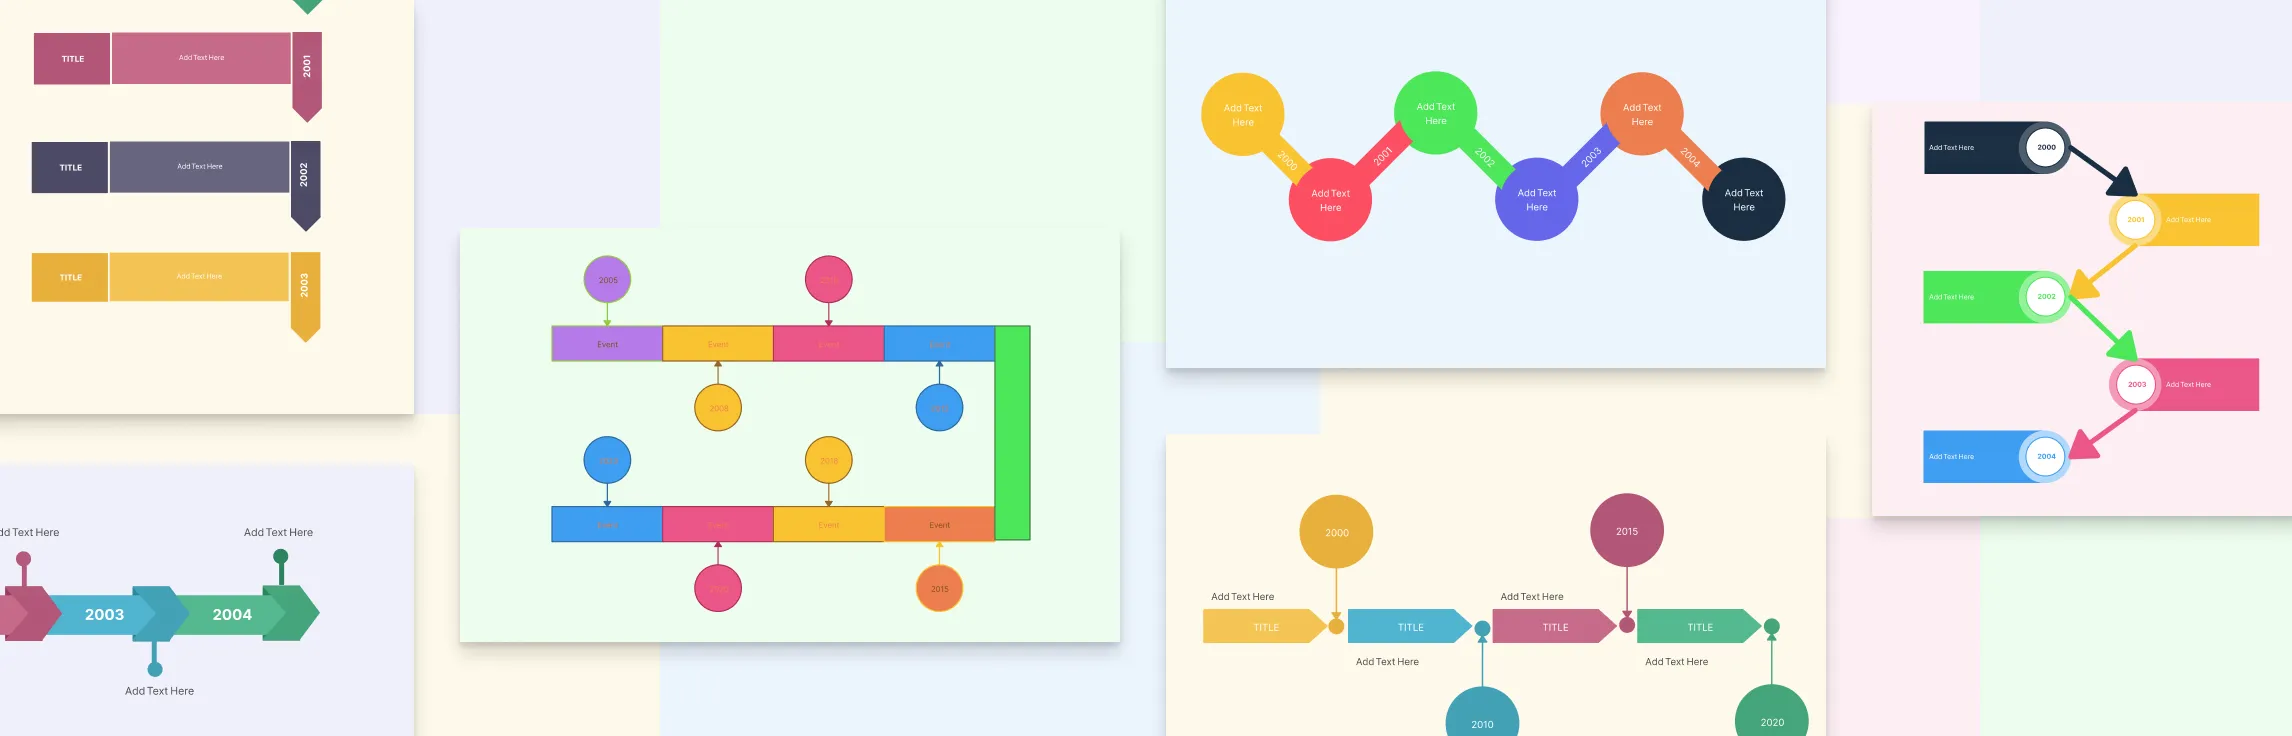
A timeline is a simple but powerful way to show how events unfold over time, whether you’re mapping a project plan, telling a historical story, or tracking milestones for a presentation. By laying information out in chronological order, timelines make complex sequences easier to follow at a glance. In this guide, we’ll walk you through everything you need to know on how to make a timeline. From gathering your information to choosing the right layout and styling your timeline for impact, you’ll learn step by step how to make your timelines both informative and easy to understand.
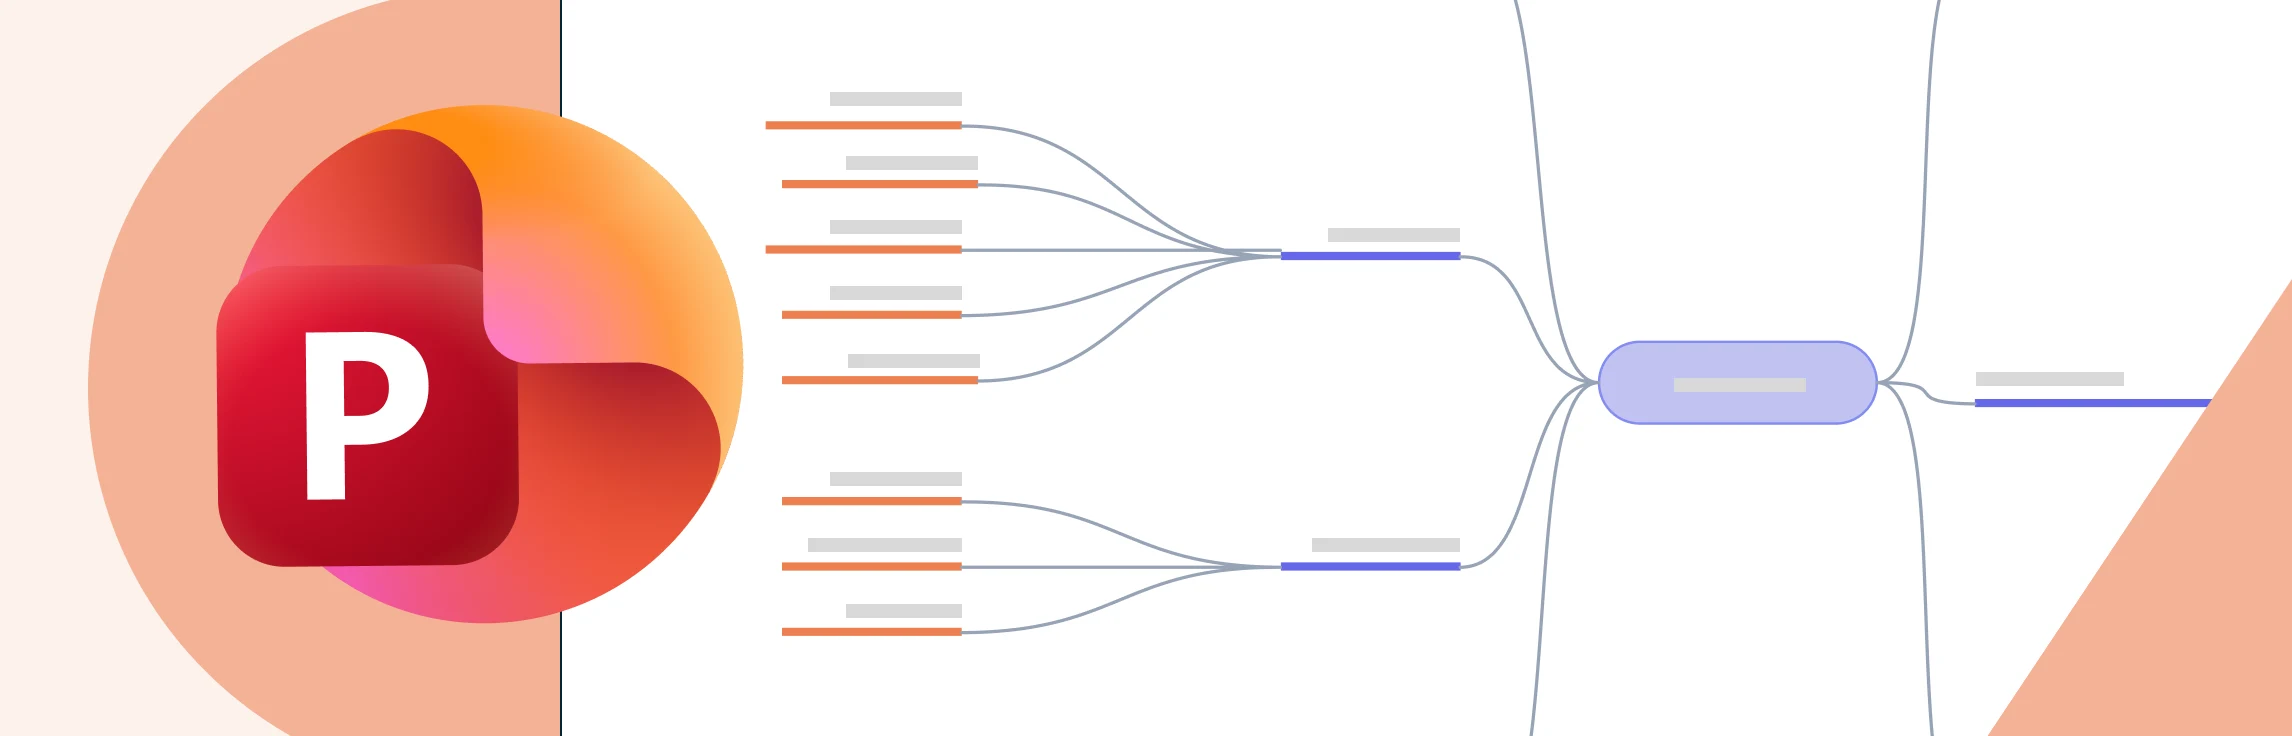
This guide shows you how to draw a mind map in PowerPoint in a clear, approachable way, helping you turn scattered ideas into a structured visual. You’ll get a quick overview of what a mind map is, learn the step-by-step process to build one using PowerPoint, understand where the tool starts to feel challenging, and explore an easier alternative. By the end, you’ll feel confident organizing your ideas into a mind map that’s clean, clear, and presentation-ready.
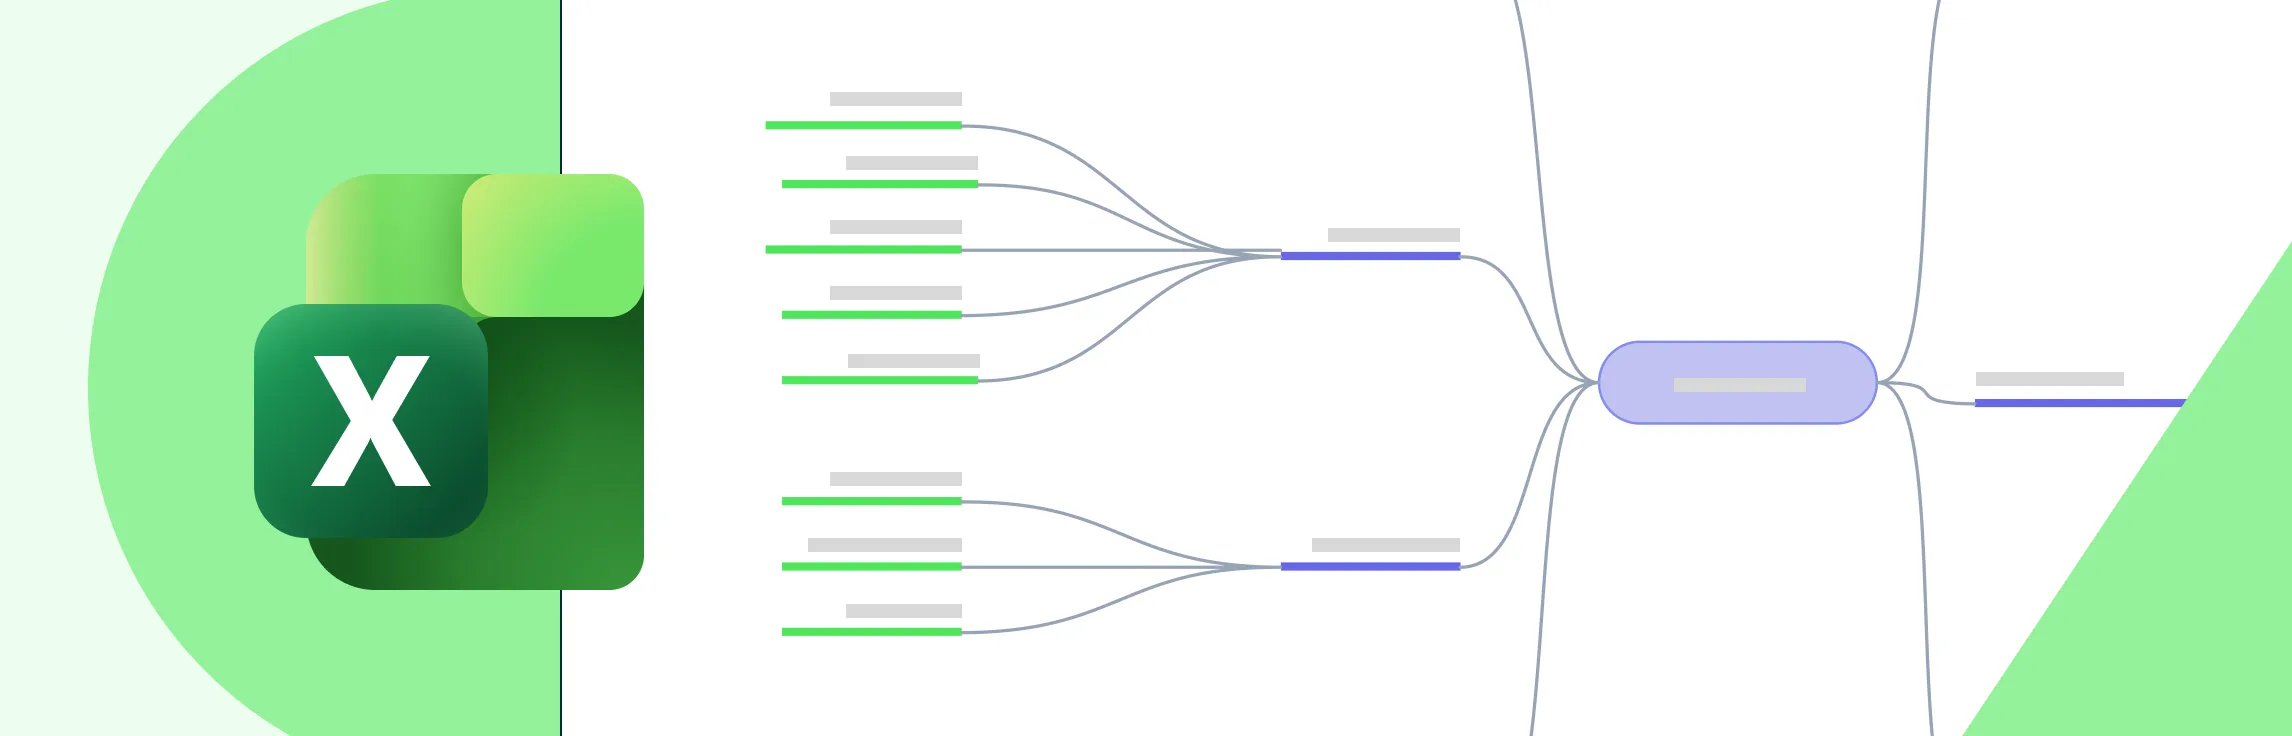
This guide walks you through how to create a mind map in Excel in a simple, friendly way so you can turn scattered thoughts into a clear visual plan. You’ll learn what a mind map is, the exact steps to build one using Excel’s tools, where the method starts to feel limiting, and the smarter alternatives available. By the end, you’ll know exactly how to structure your ideas quickly and confidently.
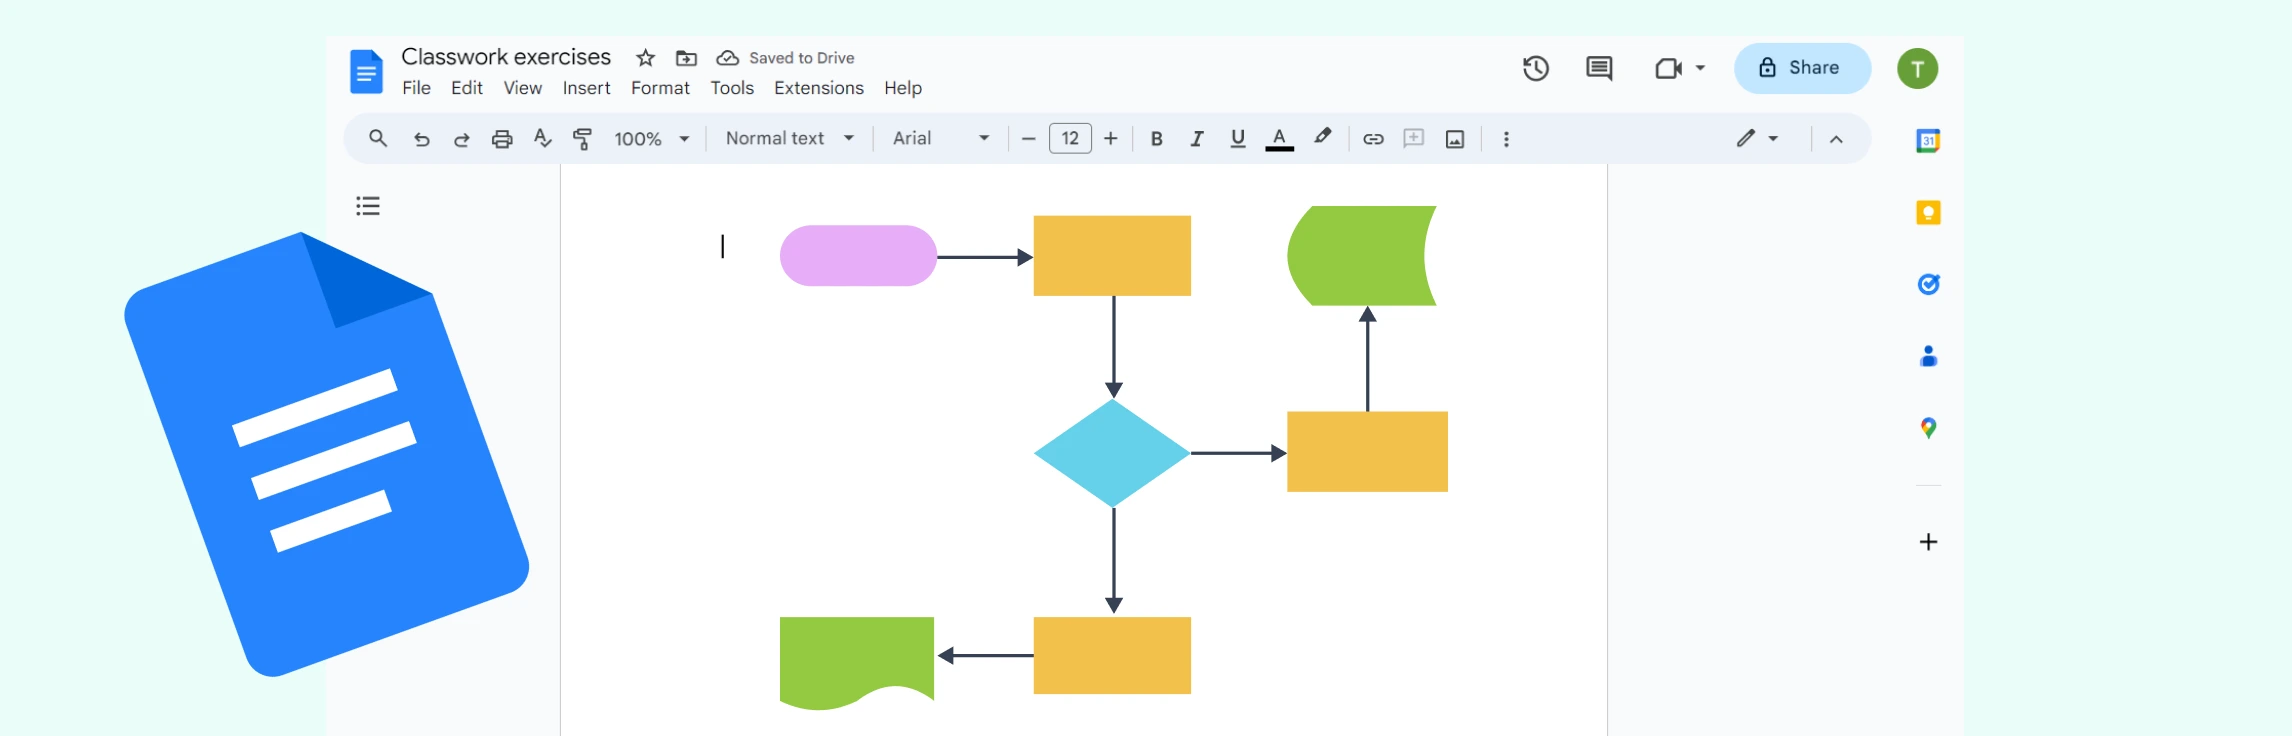
If you’ve been wondering “how do I make a flowchart in Google Docs”, then this is the guide for you. This tutorial covers how to build a flowchart in Google Docs in just six simple steps, go through the limitations, explore a better alternative, and compare its features to Google Docs.
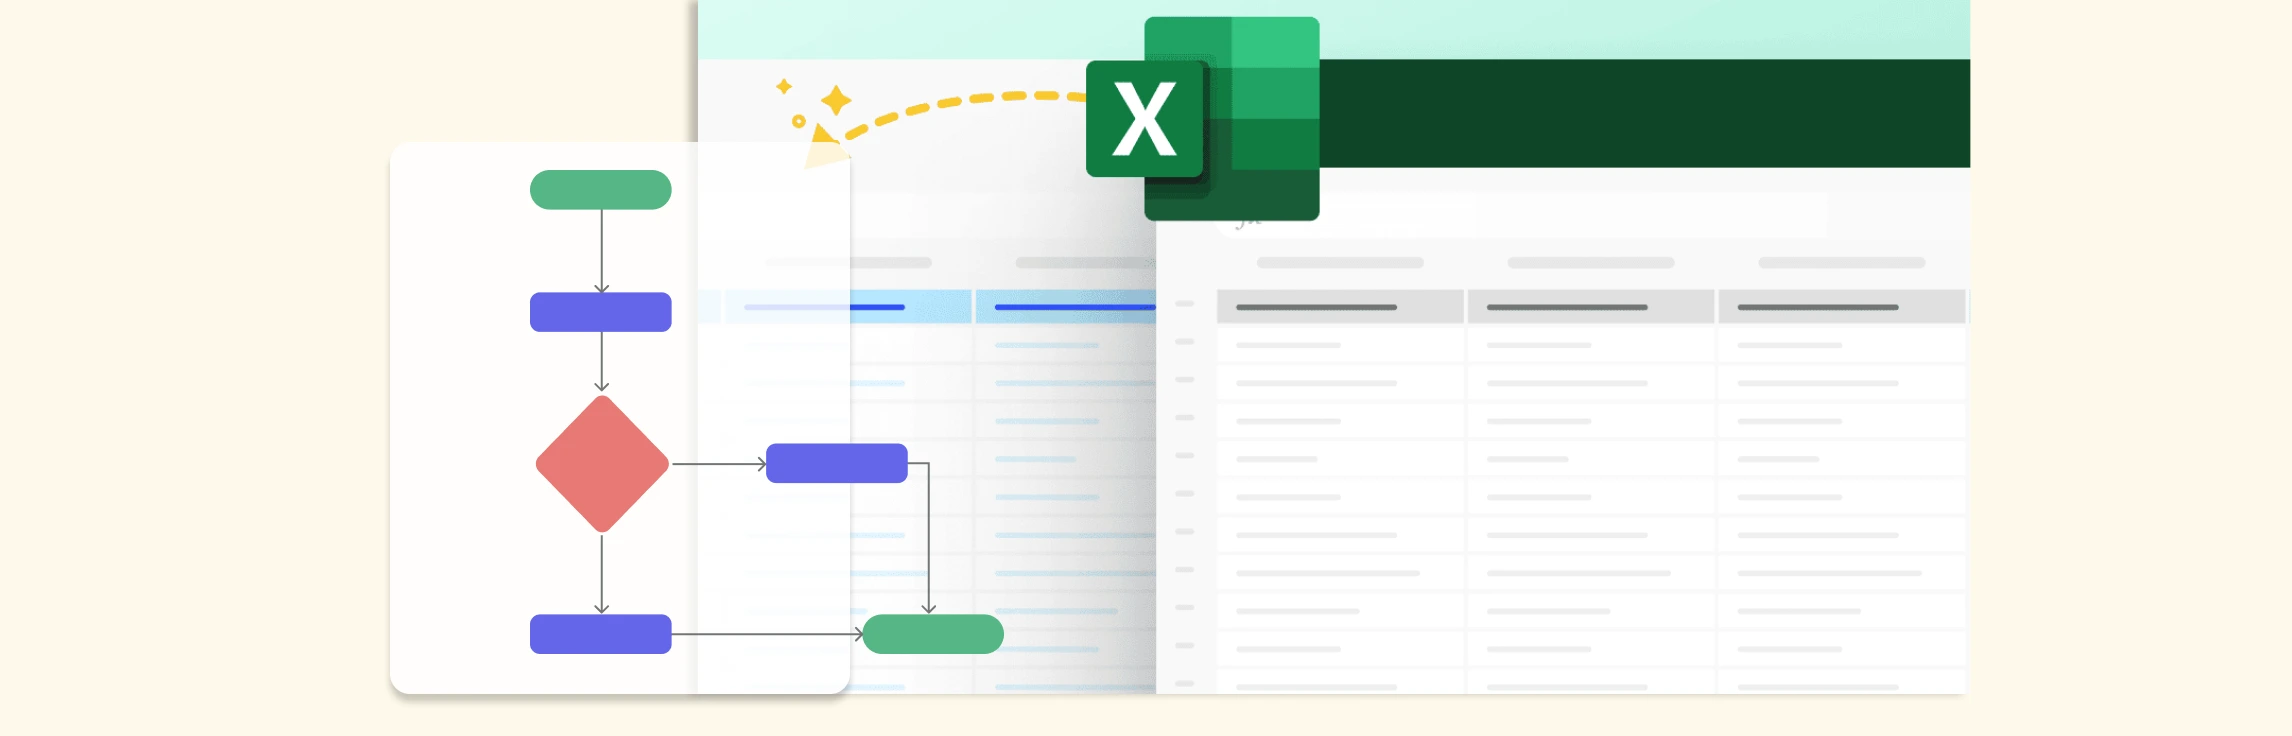
If you want to learn how to make a flowchart in Excel, then this guide is for you. Learn how to build a flowchart in Excel, make it interactive, explore its limitations, and discover a better alternative and free templates to get started today.
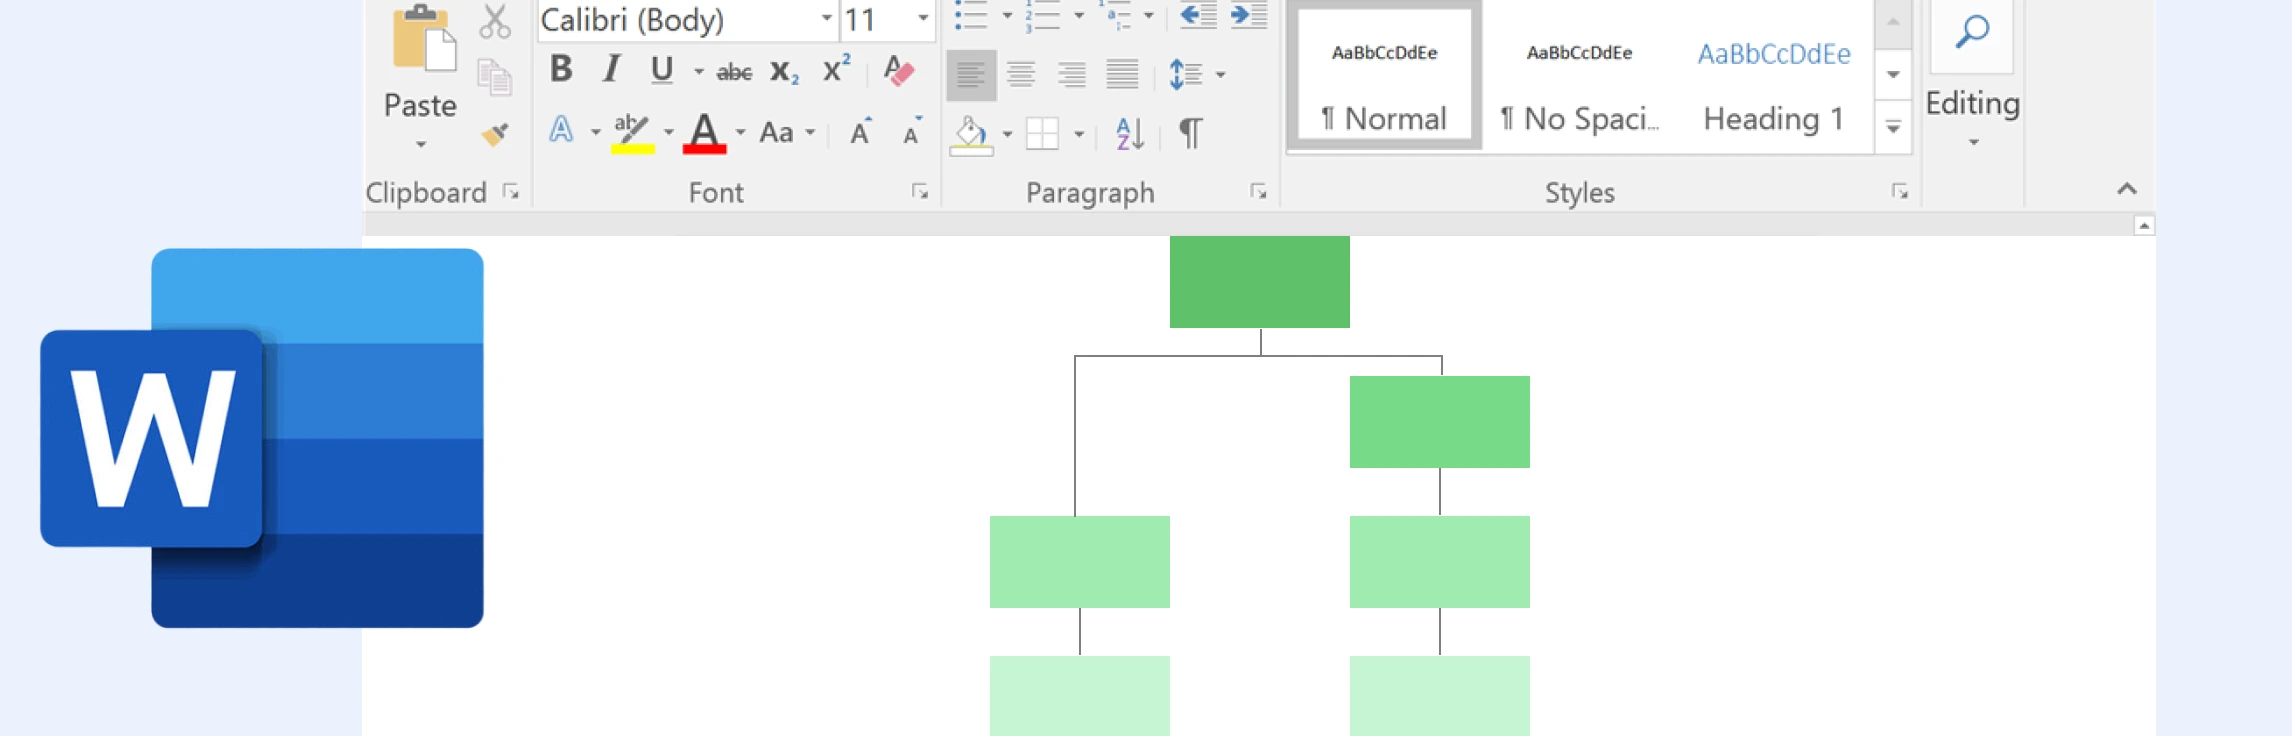
If you want to learn how to do a process map in Word, then this is the guide for you. We cover step-by-step instructions, an understanding of the limitations of Microsoft Word, an alternative for making process maps, and a features comparison to help you choose the best option.
This guide walks you through the steps for how to create a process map in Excel, highlights the challenges you may encounter on the platform, and introduces a more efficient alternative for teams that need faster, clearer, and more scalable process mapping.
A timeline diagram is a simple but powerful way to show how events unfold over time. Whether it’s used to track project milestones, visualize historical events, or map a product’s journey, timelines make it easy to see progress and relationships at a glance. In this guide, we’ll explain the timeline meaning, its key elements, and why it’s such a useful tool for organizing information clearly.
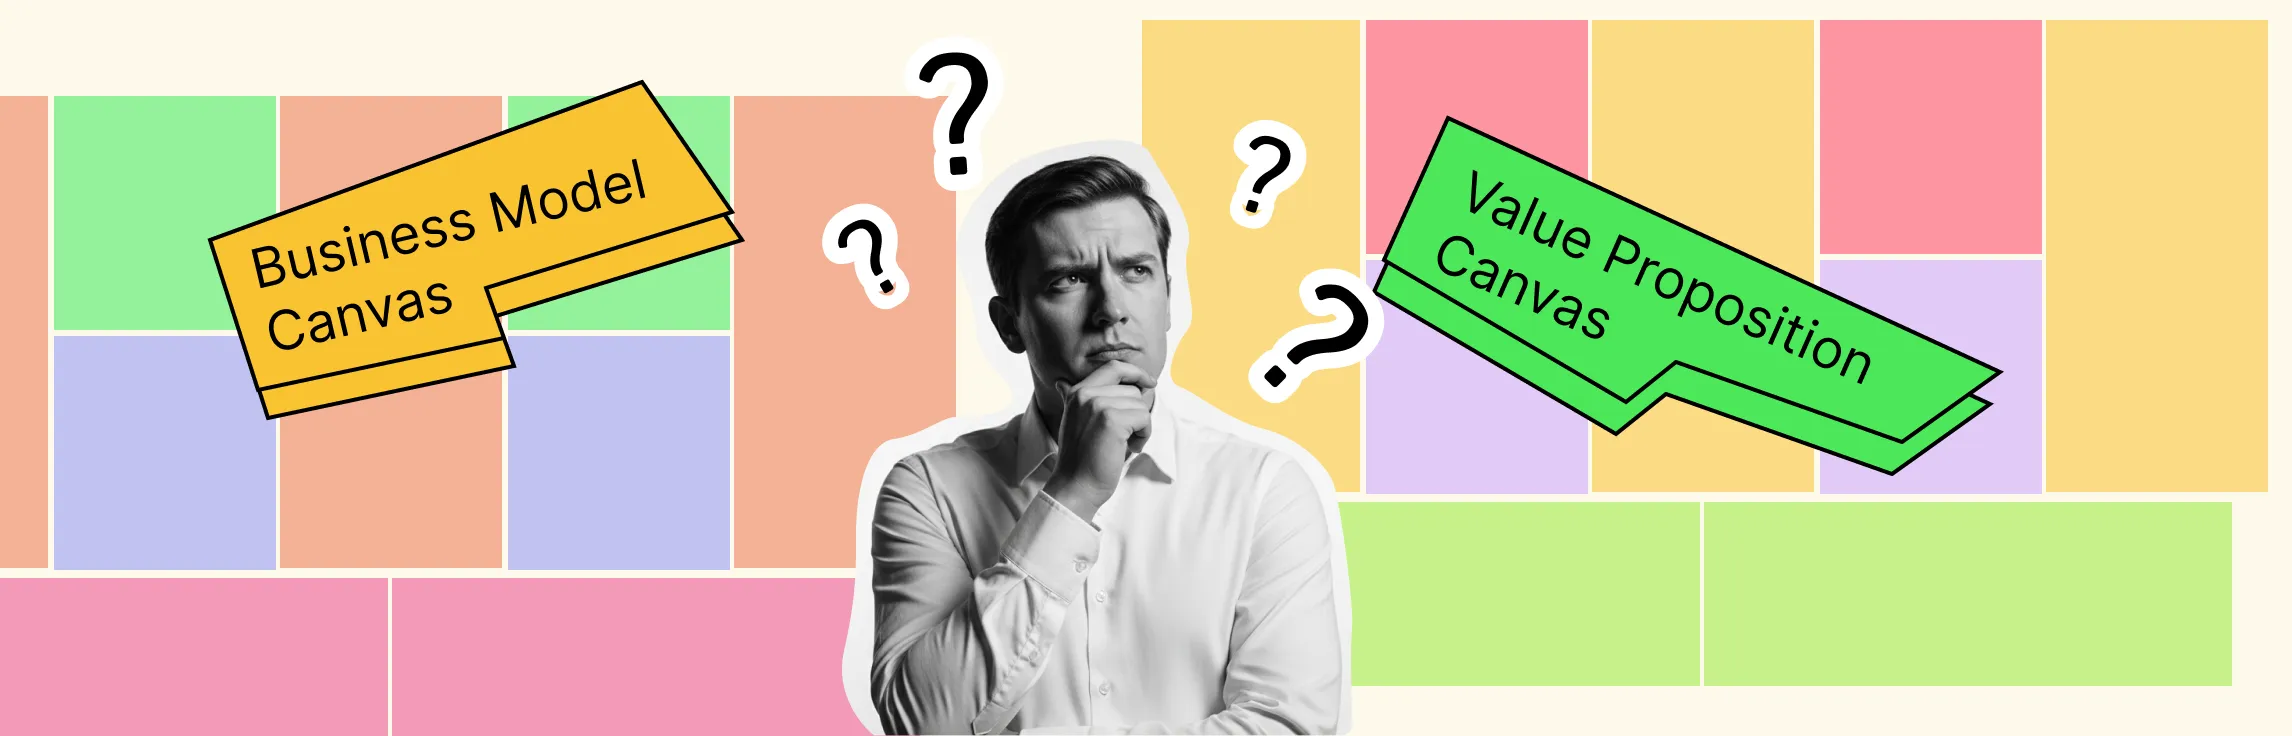
Every great business starts with a clear plan—and a clear plan starts with the right tools. The business model canvas and value proposition canvas are two of the most powerful frameworks to help you map your business, uncover opportunities, and understand what truly matters to your customers. In this guide, we’ll show you how to use both canvases to align your team, test ideas, and turn your vision into a practical plan—all in a simple, visual way.
A timeline is a visual way to display events or tasks in the order they occur, helping you quickly understand how things progress over time. Whether you’re mapping historical events, planning a project, or organizing ideas, knowing the different types of timelines can make your work clearer and more effective. In this guide, we’ll explore the main types of timelines, their uses, and how you can easily create them using a visual tool like Creately.
Lean UX is a practical way to design and improve products faster. Instead of spending weeks creating detailed designs or long reports, it focuses on learning quickly through collaboration and small experiments. This guide will help you understand what Lean UX is, how it works, and how you can use it to build better experiences with your team. Whether you’re new to UX or just looking for a faster, more flexible approach, this is the perfect place to start.
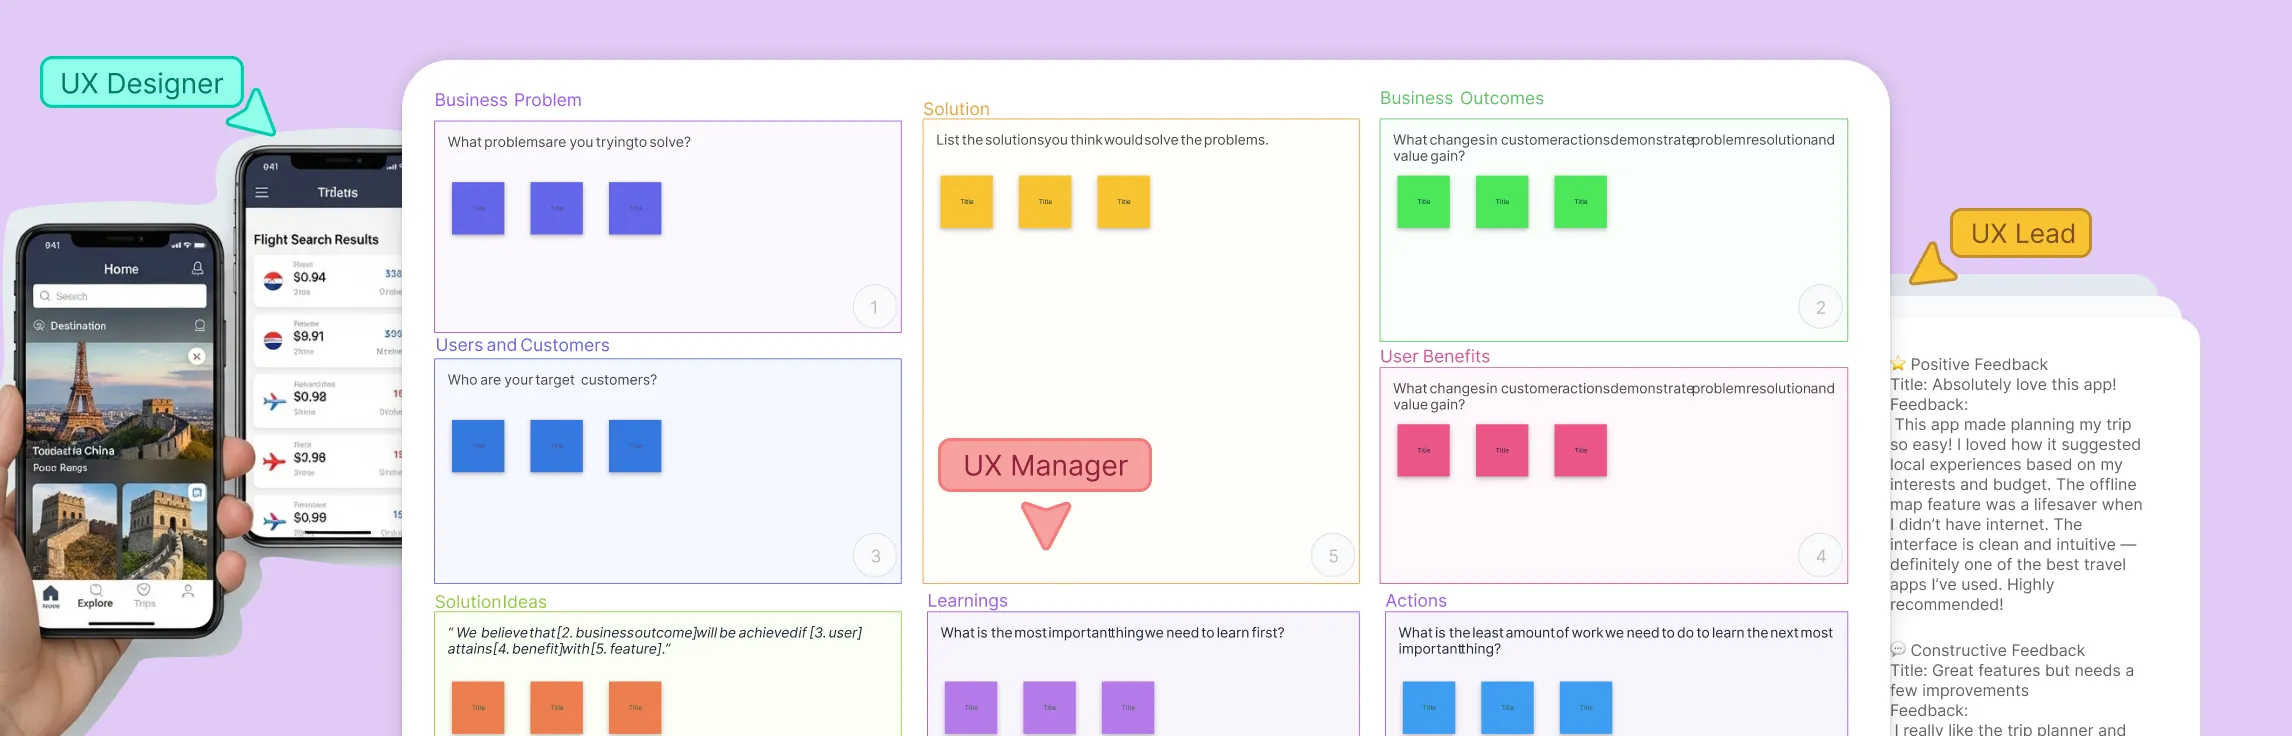
The Lean UX Canvas is a practical tool that guides teams through the Lean UX process — from framing problems and identifying assumptions to designing experiments that lead to real insights. It helps teams stay focused on outcomes, align around user needs, and make evidence-based decisions. In this guide, you’ll learn how to use the Lean UX Canvas step by step to validate ideas faster and build products that truly solve user problems.
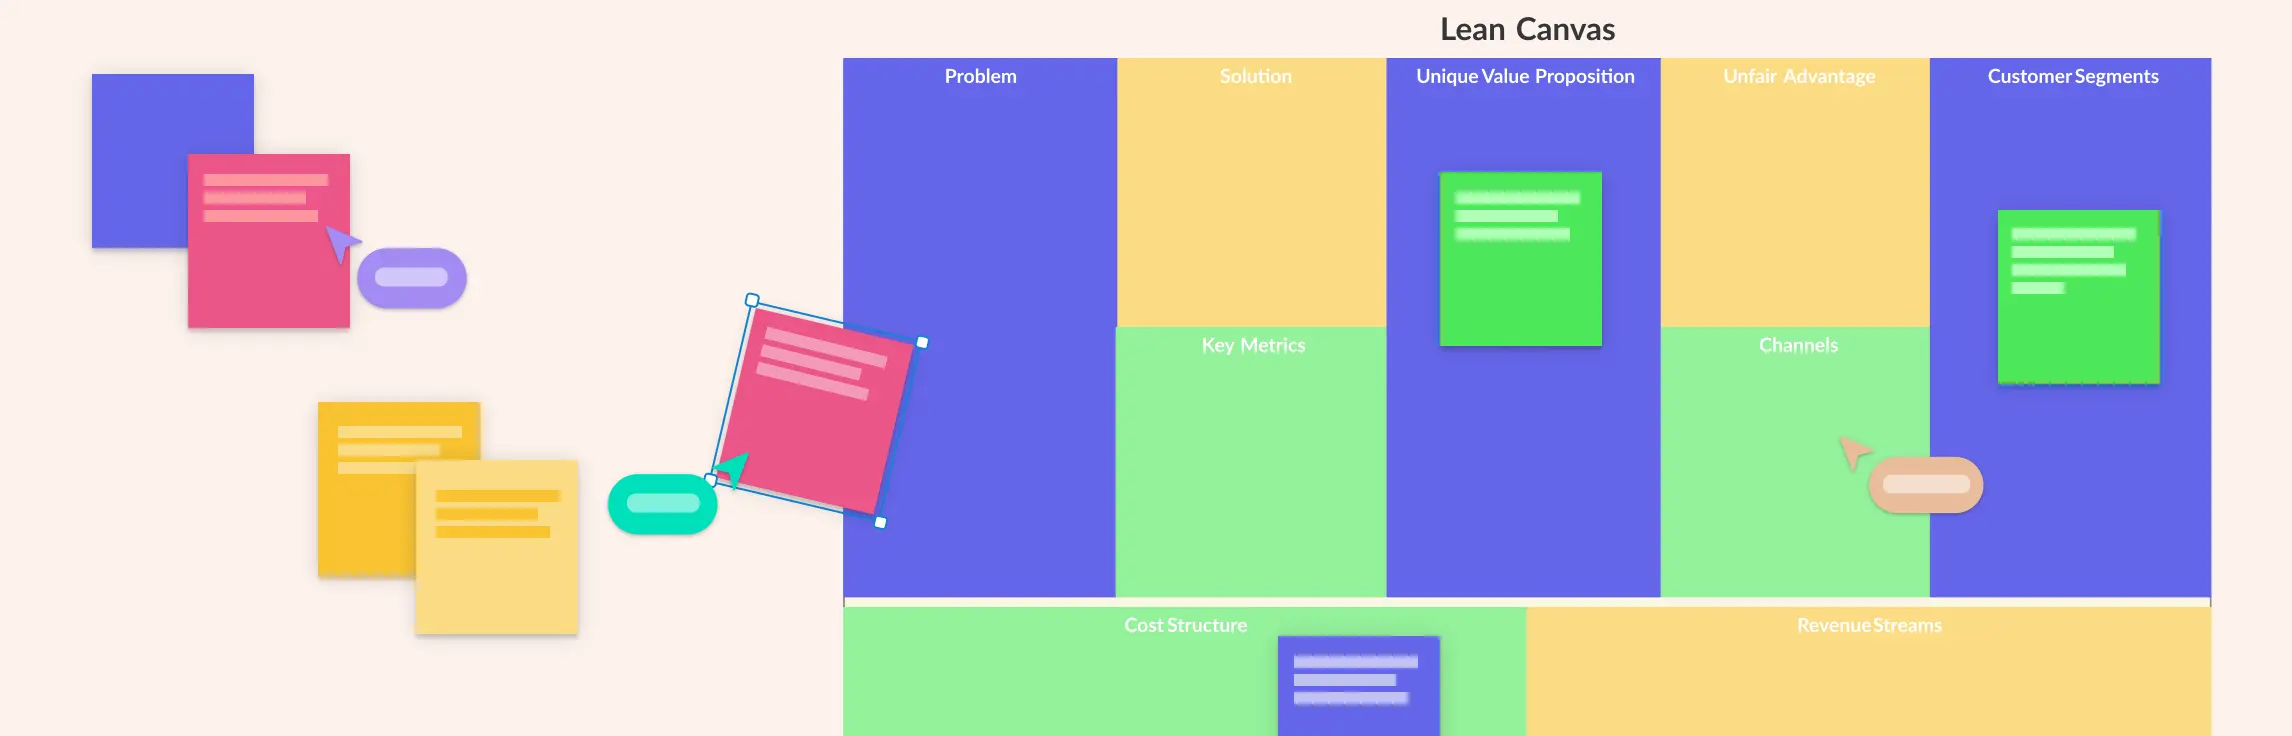
Starting a business is exciting, but turning an idea into a working business model can feel overwhelming. That’s where the Lean Canvas comes in—a simple, one-page tool that helps you map out your idea, identify key problems, and plan how to deliver value to your customers. In this guide, we’ll walk you through real-world Lean Canvas examples from successful startups, showing you exactly how to structure your own canvas.
Starting a business can feel overwhelming, with countless decisions to make and uncertainties to navigate. The Lean Business Model Canvas helps entrepreneurs focus on what truly matters—understanding customers, testing ideas quickly, and iterating on solutions without wasting time or resources. In this guide, we’ll walk you through a practical approach to using the canvas effectively, offering tips, examples, and strategies to turn your ideas into actionable plans.
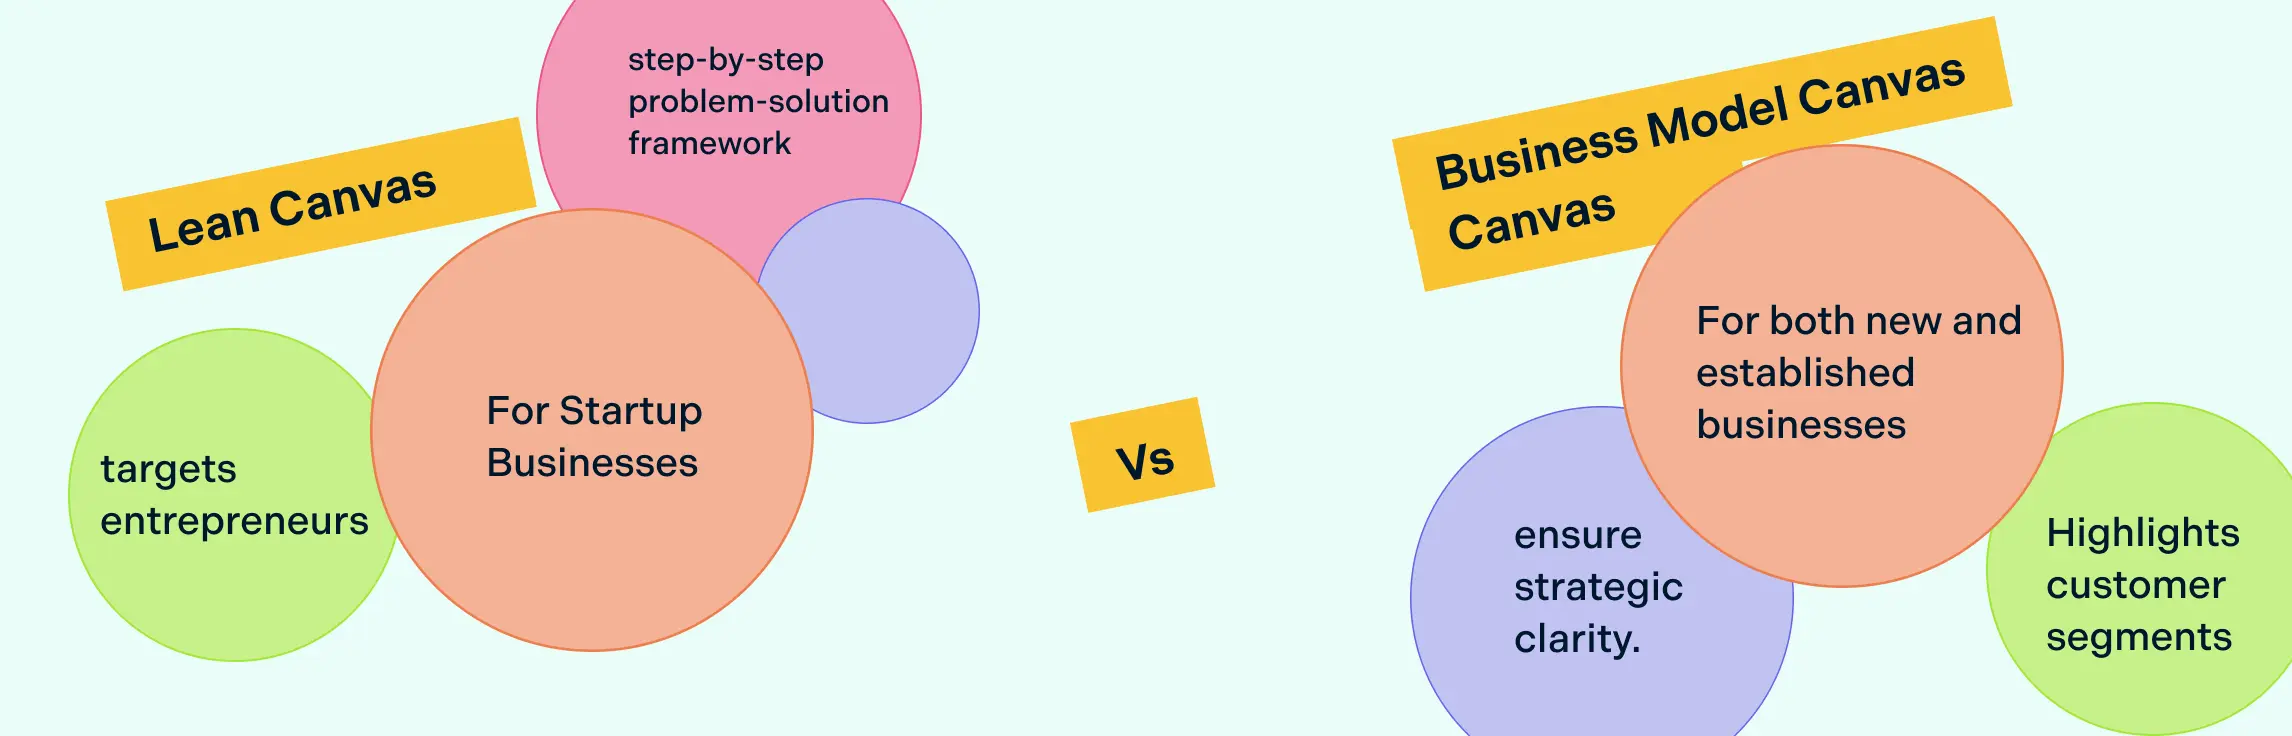
Building a business idea doesn’t have to start with a long, complicated plan. Single-page canvases like the Lean Canvas and the Business Model Canvas help you quickly map out how your idea creates value and works as a business. In this guide, you’ll learn what makes each canvas unique, when to use them, and how to choose the right one for your stage. We’ll also look at lean canvas vs. business model canvas examples and ready-to-use templates to help you put your ideas into action fast.
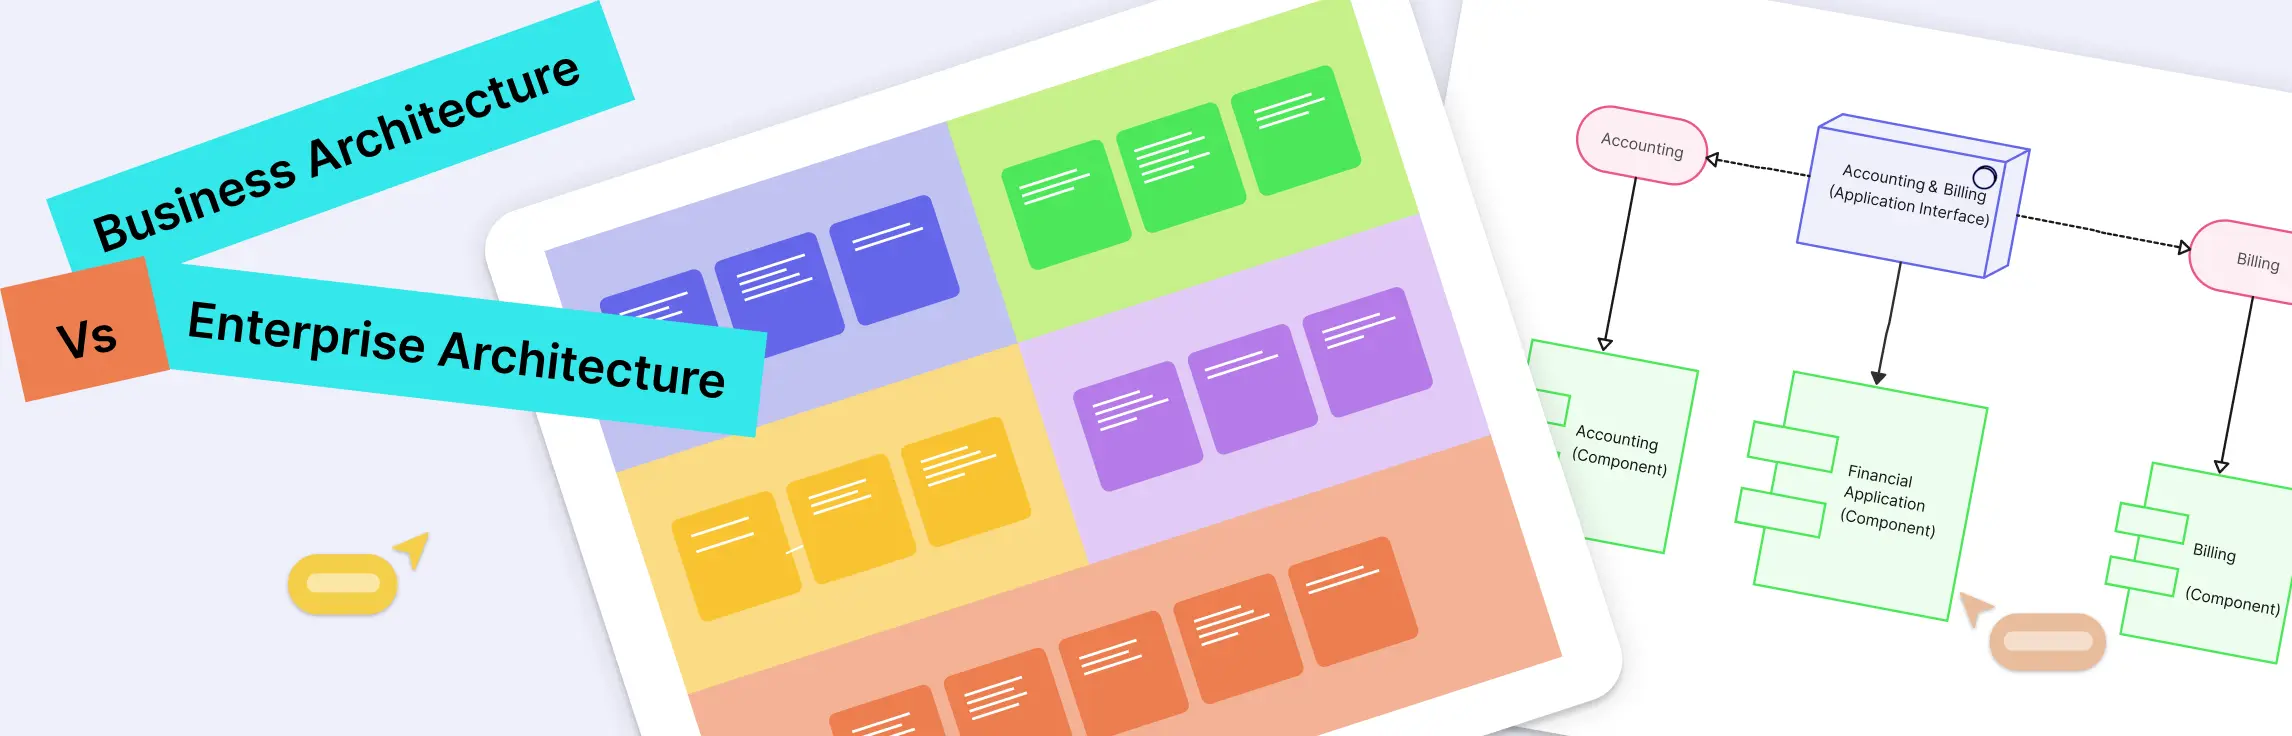
In today’s fast-changing business landscape, success depends on how well strategy aligns with technology. Yet many organizations struggle to connect big-picture goals with the systems that power them. This is where understanding business vs enterprise architecture becomes critical. By distinguishing how business architecture defines organizational capabilities and how enterprise architecture enables them through technology, teams can bridge the gap between vision and execution. In this guide, we’ll break down the differences, explore examples, and share practical templates to help you build a strong business enterprise architecture foundation for long-term success.
In today’s fast-paced business environment, aligning strategy with execution is more critical than ever. Business architecture modelling provides a clear, structured view of an organization’s capabilities, processes, information flows, and stakeholders, helping leaders make informed decisions and drive operational excellence. Whether you’re a startup, an enterprise, or a growing e-commerce business, understanding and visualizing your business architecture can unlock clarity, efficiency, and strategic alignment, turning complex operations into actionable insights.
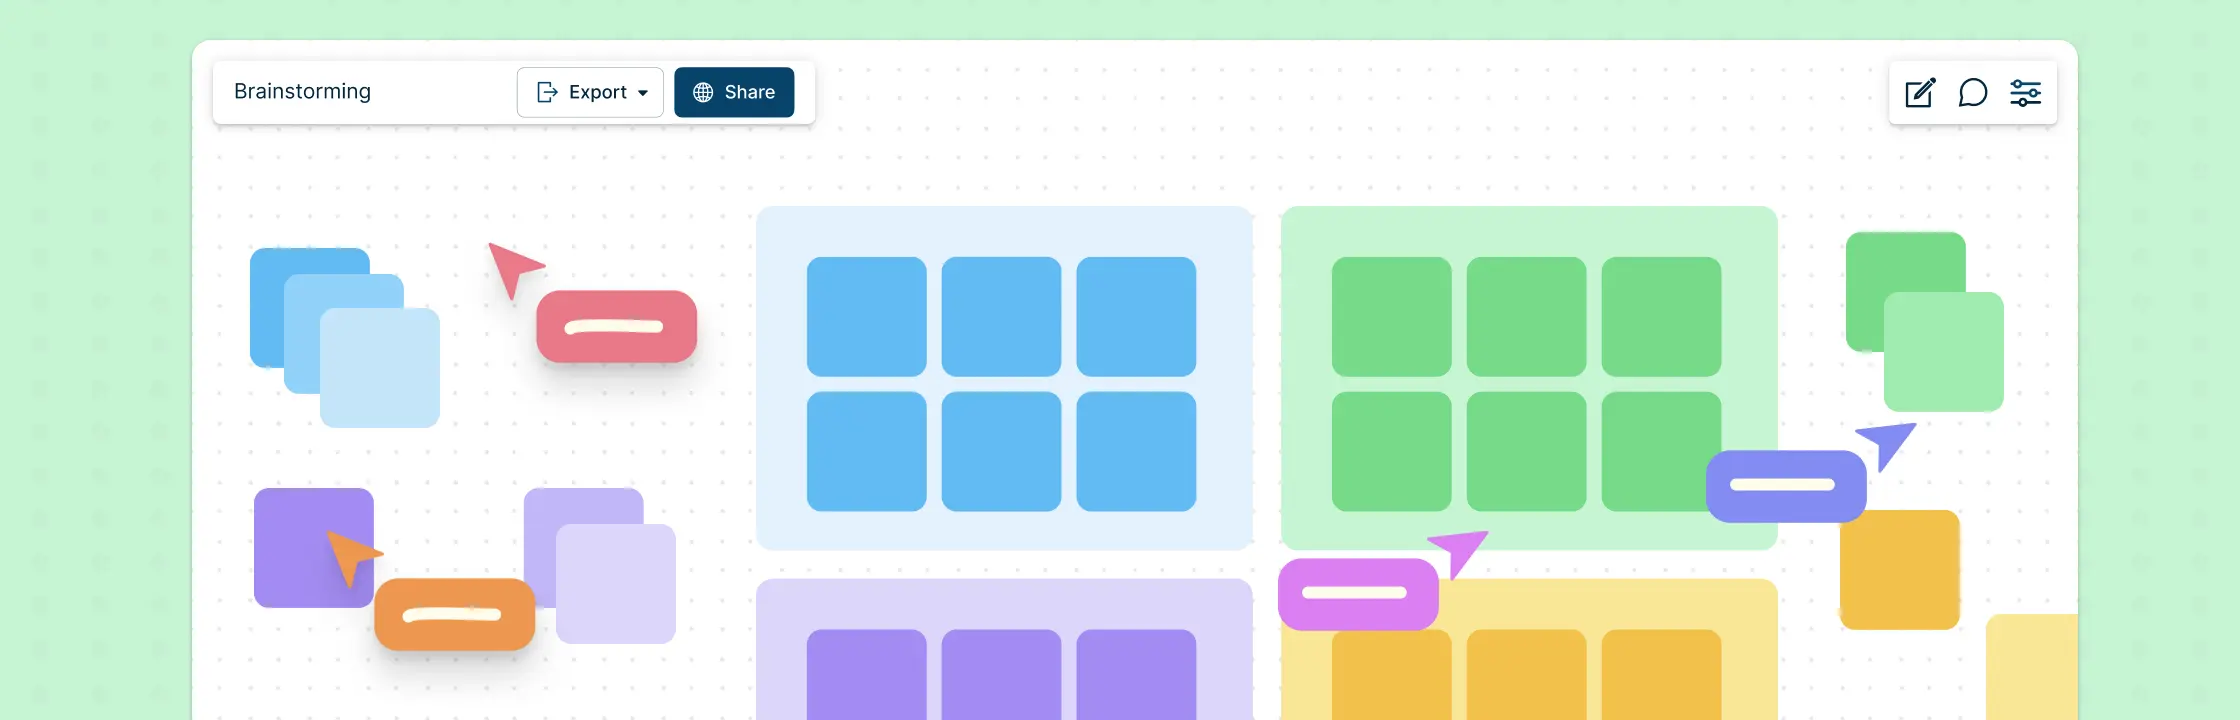
Generate new ideas and creative solutions by brainstorming online with your team. Bring different perspectives together on a single space.
Ever feel like your organization’s strategy lives in one place, but execution happens somewhere completely different? Misaligned goals, unclear responsibilities, and disconnected processes can turn even the best strategies into missed opportunities.
A design sprint is a fast, structured way to solve problems and test ideas in just a few days. Instead of spending months on guesswork, the design sprint process helps teams quickly prototype and learn from real users. It matters because it speeds up decisions, reduces risk, and aligns everyone around clear next steps.
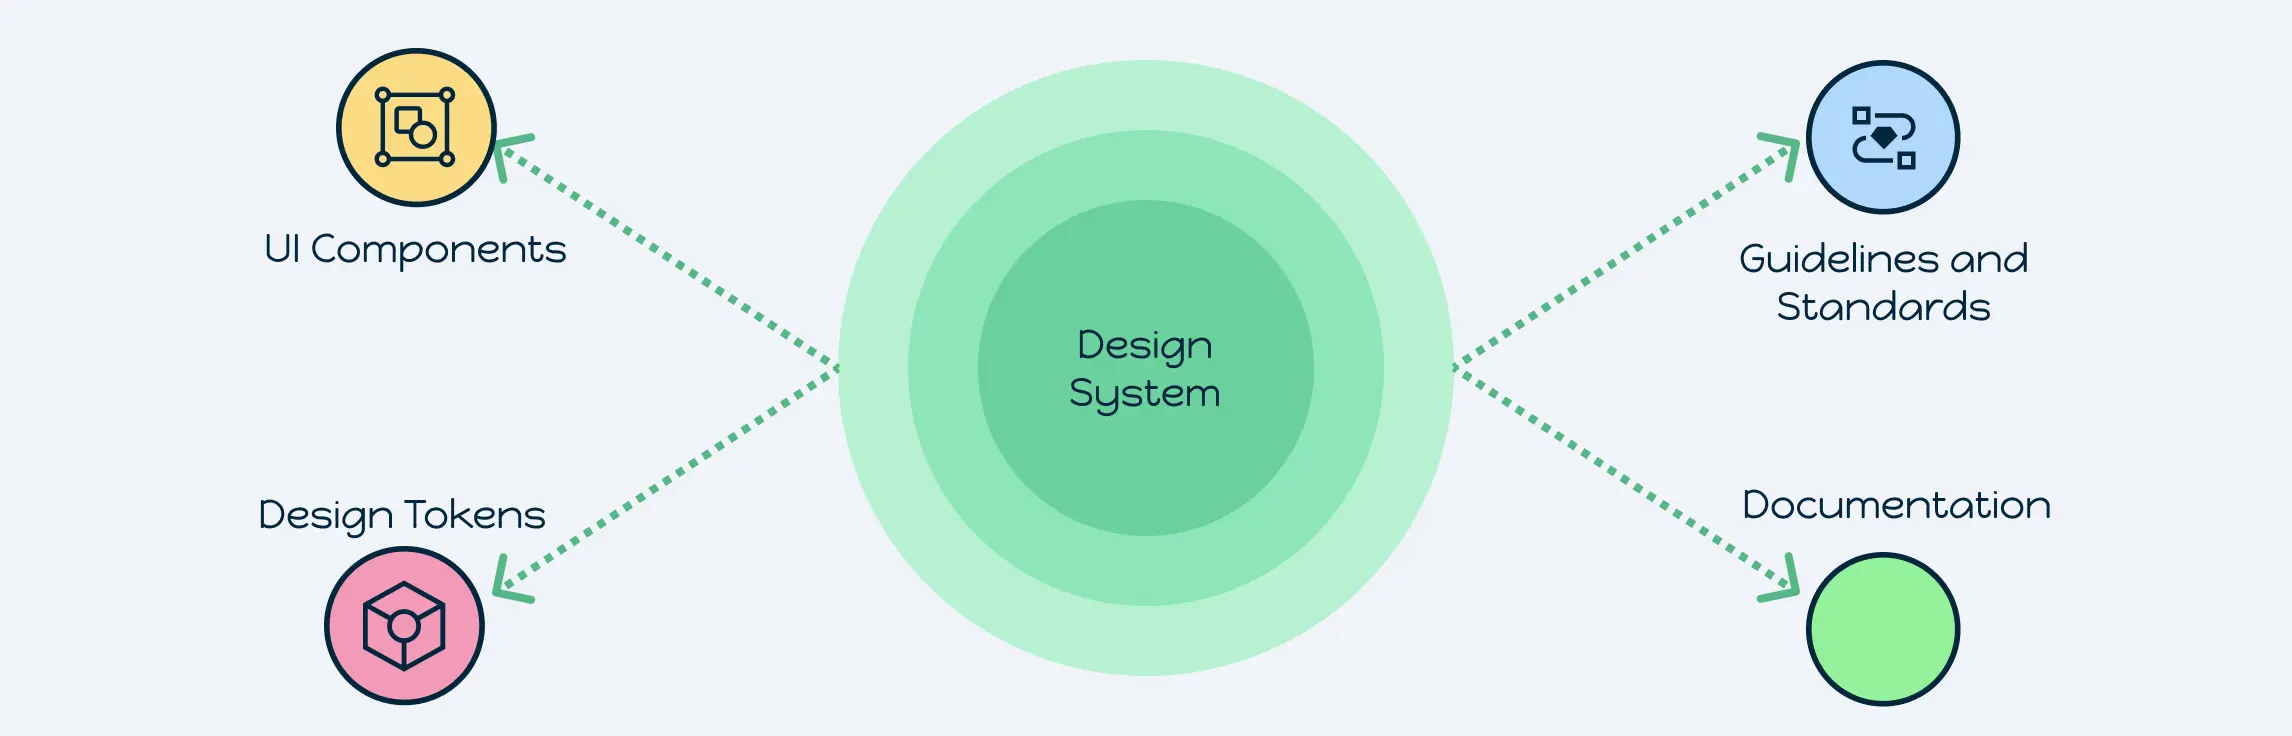
Struggling with inconsistent designs, repeated work, and misaligned teams? A design system is the solution. It’s a centralized framework that brings together reusable UI components, design tokens, and clear guidelines to create consistent and scalable digital products. Unlike standalone style guides, design systems go beyond visuals by providing governance, documentation, and standards that align design and development teams. In modern product design, they matter because they save time, reduce inconsistencies, and improve collaboration across teams. By using a shared design system, organizations achieve consistency in branding, efficiency in workflows, and smoother collaboration between designers, developers, and stakeholders.
Are your design teams struggling with inconsistent interfaces, slow development cycles, or endless revisions? A digital design system can solve these pain points by centralizing your UI/UX assets, standardizing components, and creating a single source of truth for your entire organization. From design tokens to component libraries and governance workflows, a digital design framework ensures your products are consistent, scalable, and easier to manage, helping teams save time, reduce errors, and deliver superior user experiences across platforms.
Struggling with inconsistent interfaces, duplicated design work, and misaligned teams? That’s a common challenge when products grow without a unified system. Design system components solve this by providing reusable UI elements, standardized styles, and clear guidelines that bridge design and development. With a well-structured design system components library, teams can reduce errors, accelerate feature delivery, and maintain a cohesive user experience, ensuring every designer and developer references the same source of truth
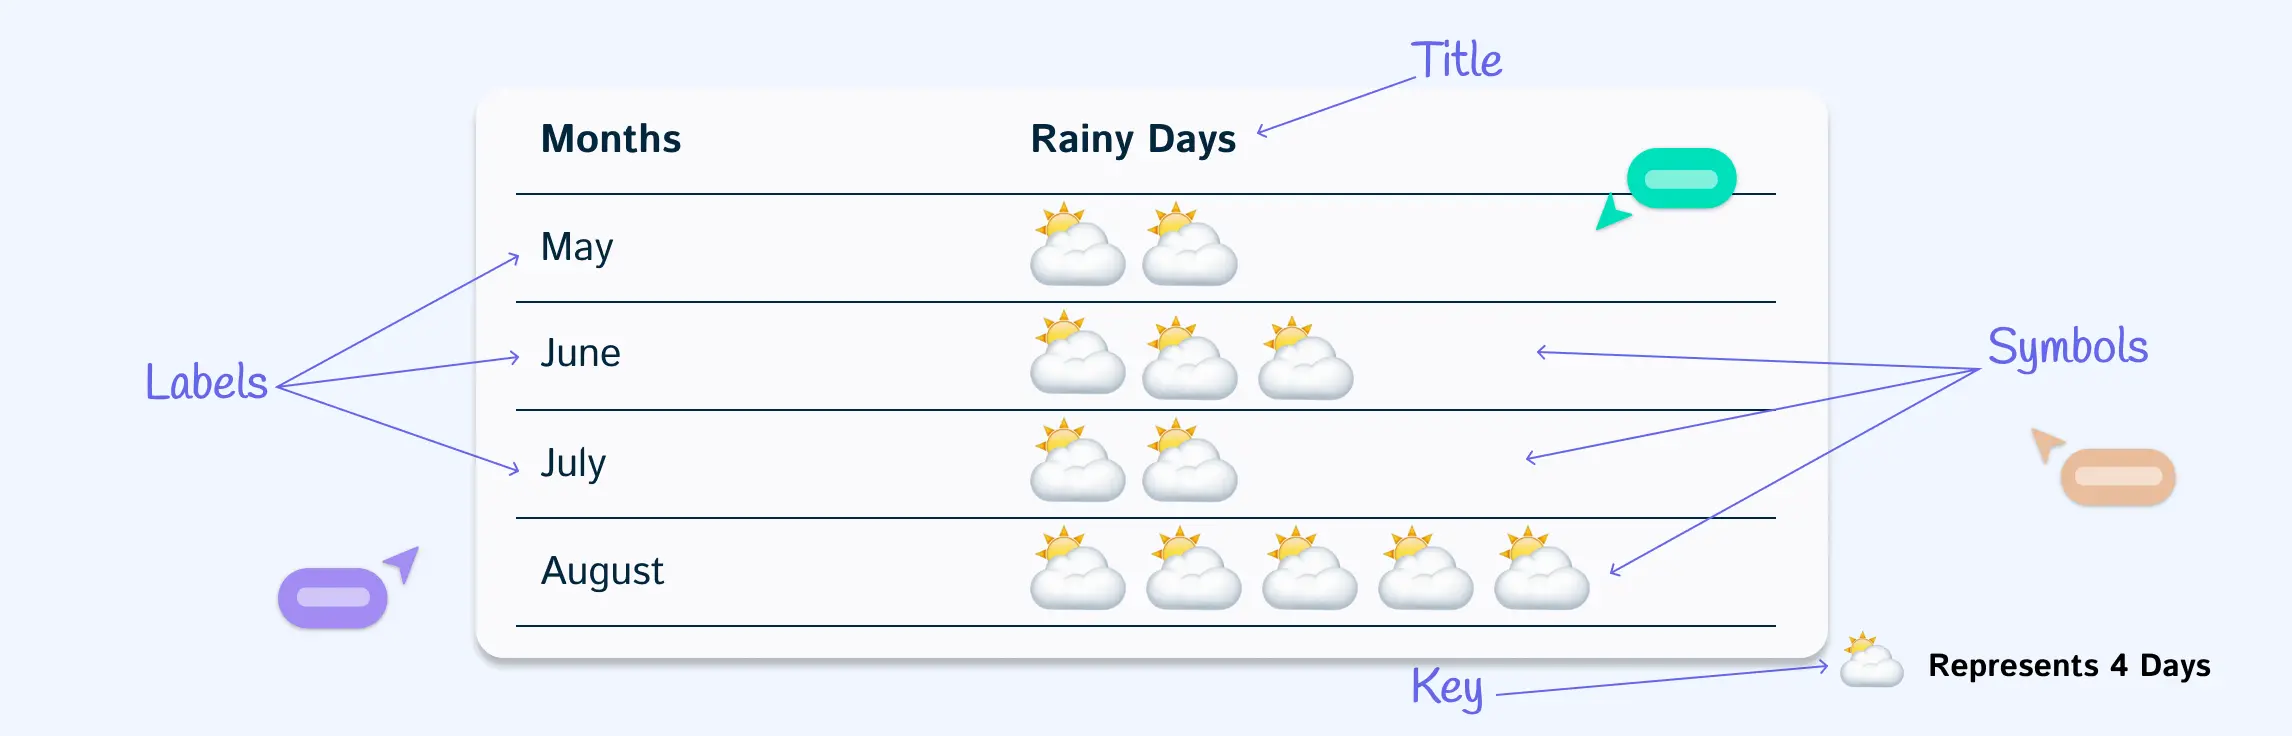
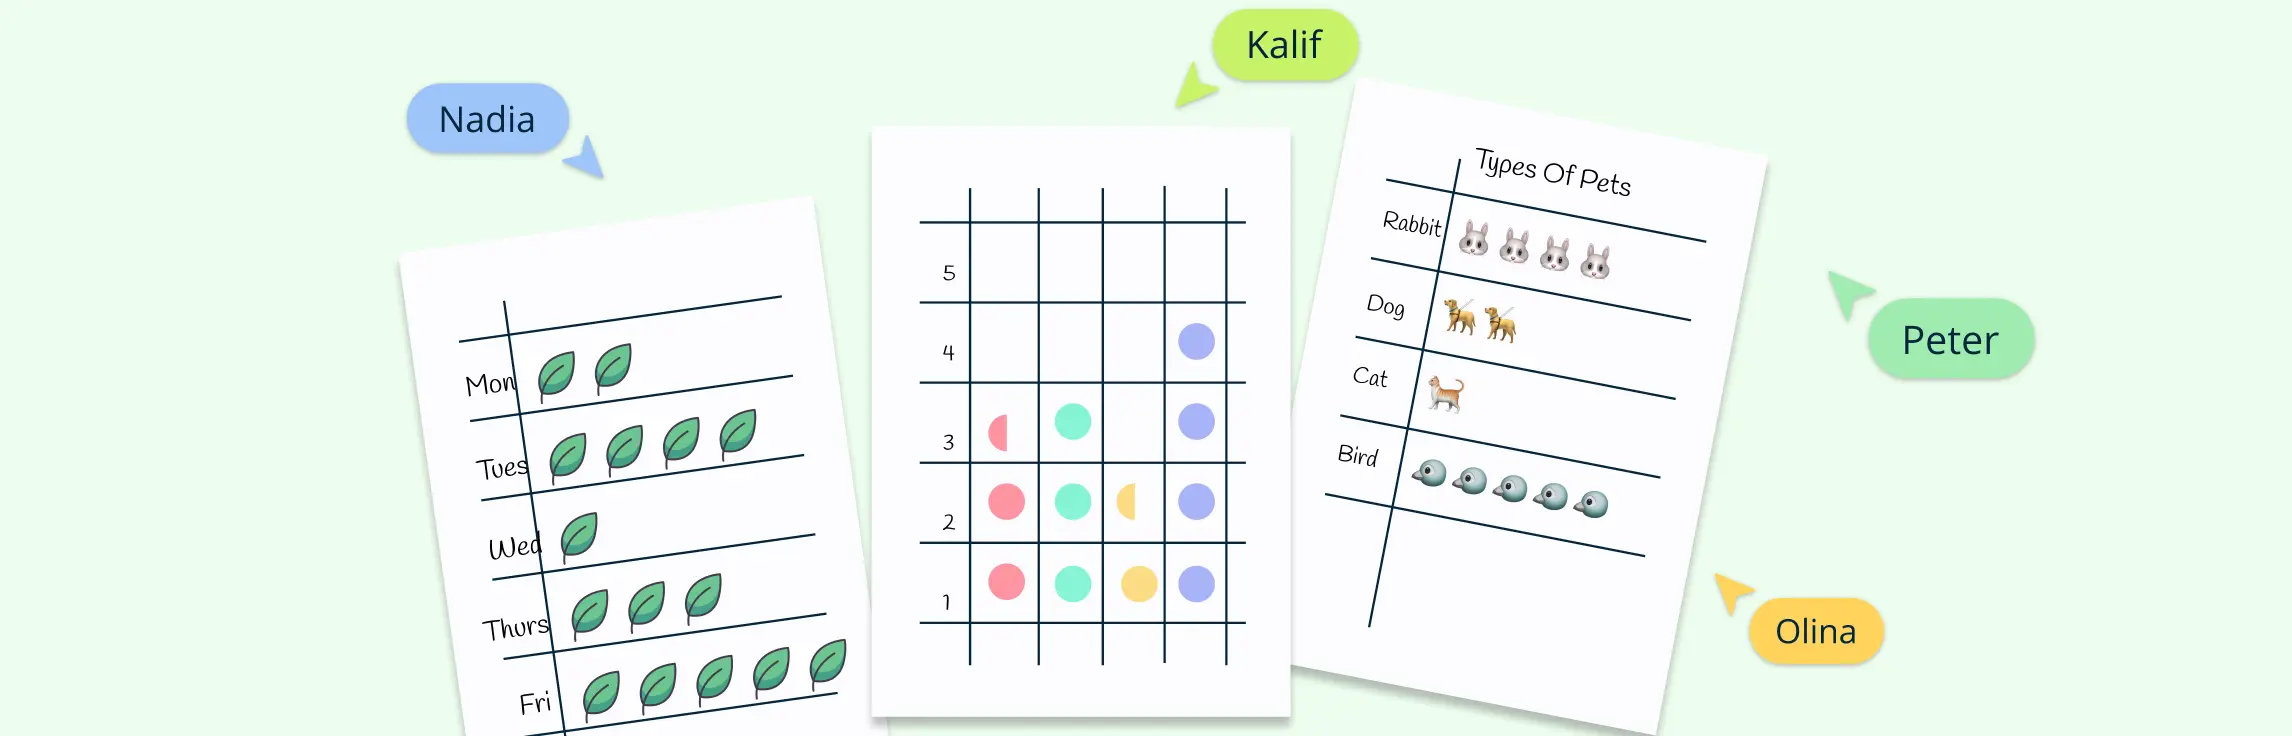
This guide will explain what a pictograph is and break down its key parts. You’ll also learn how to read pictograms, when to use them, and the advantages and disadvantages of using pictograms for visualizing data.
Pictographs turn numbers into pictures, making data easier to read and more fun to explore. Instead of plain figures, you can use icons—like apples for fruit, trees for planting projects, or people for population.
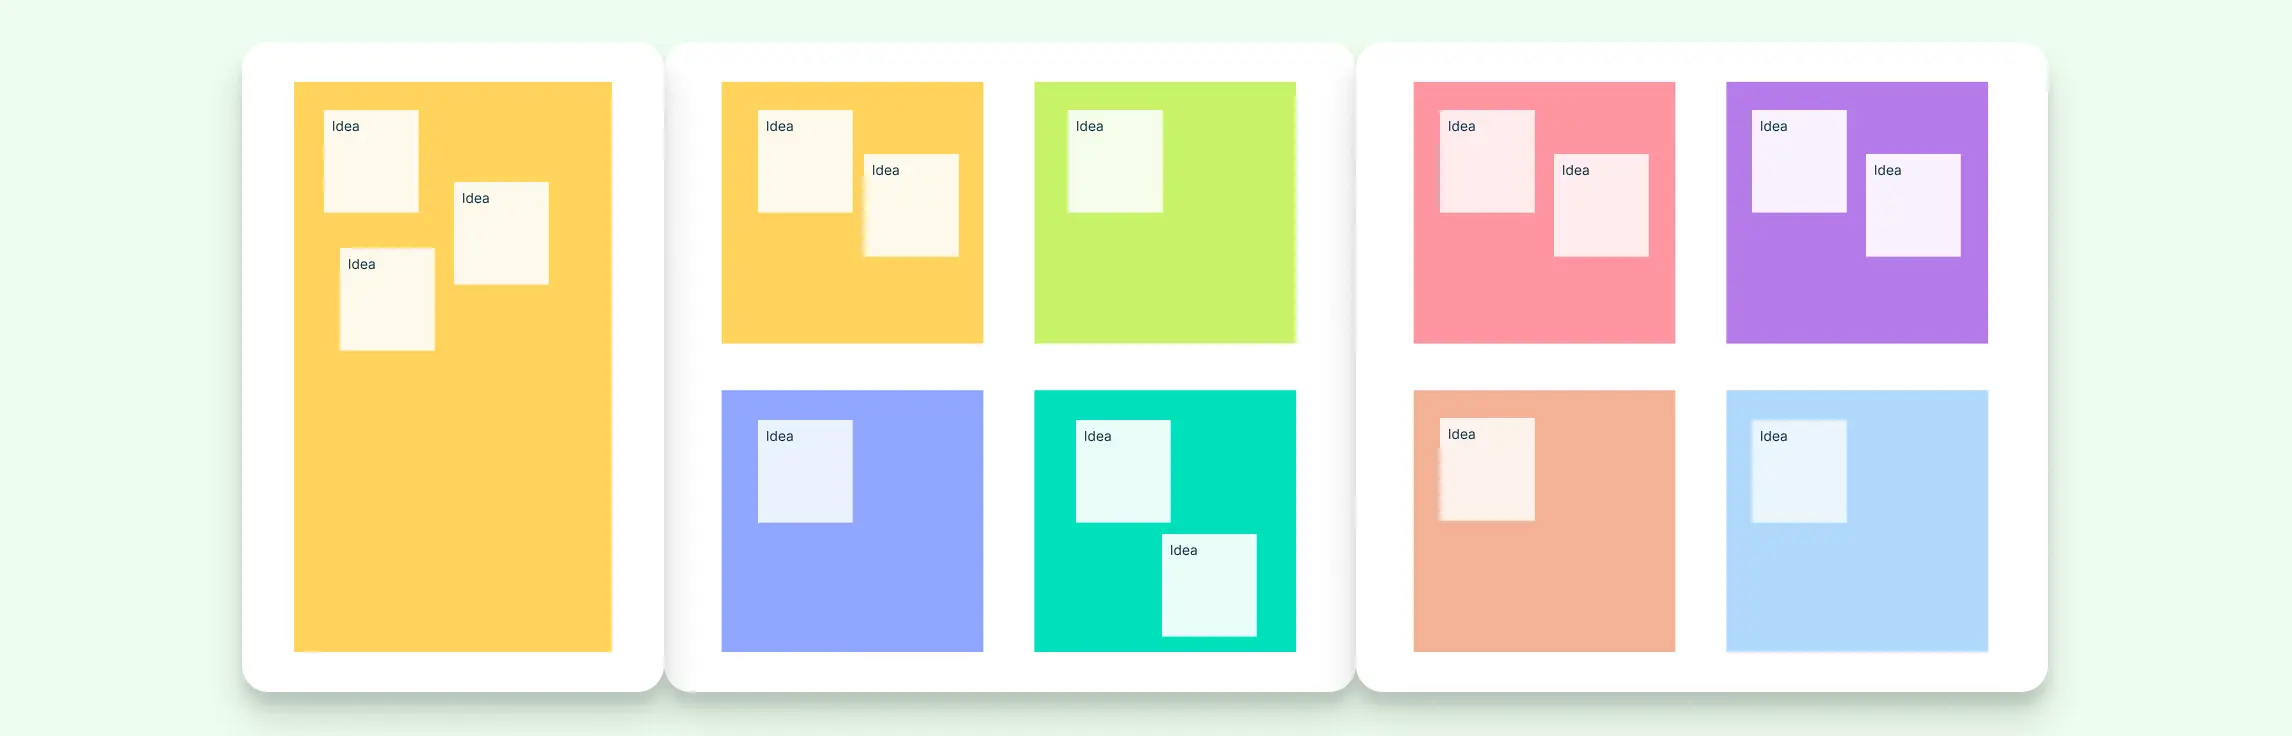
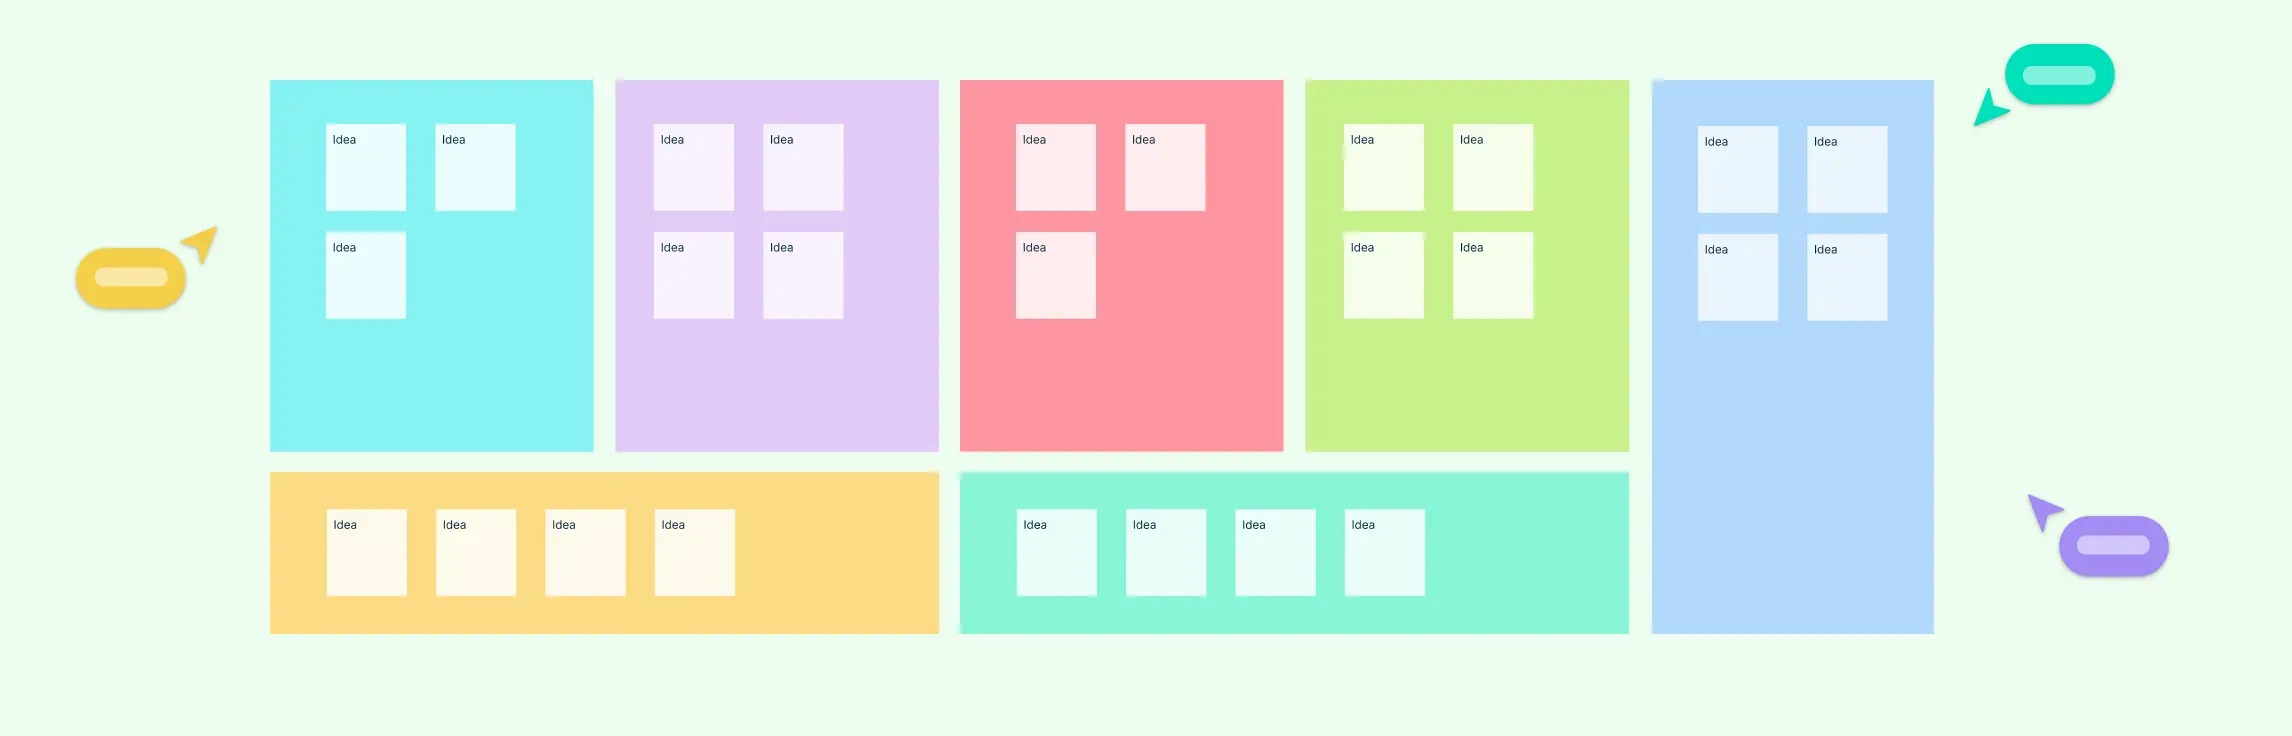
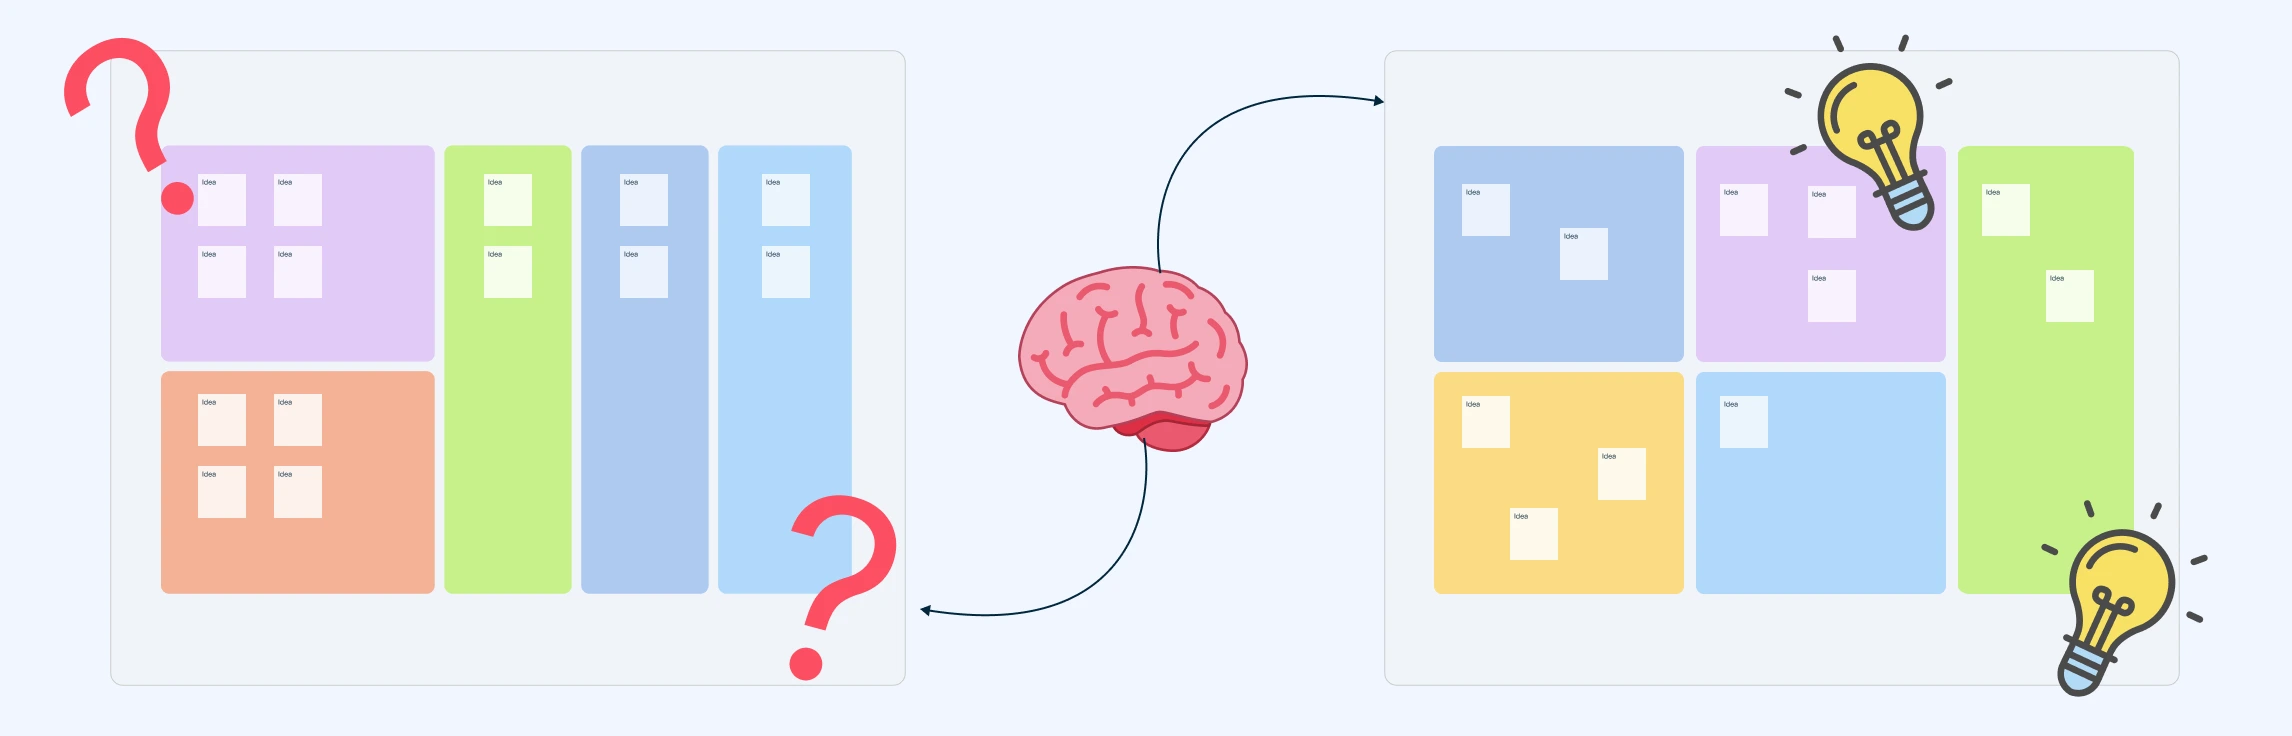
Ever feel like your ideas get lost in a jumble of sticky notes, spreadsheets, or scattered documents? That’s where an idea board comes in a simple, visual tool that brings clarity to creativity. Whether you’re brainstorming alone, collaborating with a team, or managing a complex project, a creative idea board or visual management board helps you see the big picture, organize thoughts, and turn concepts into actionable plans.
In today’s fast-paced world, keeping project ideas organized and turning them into actionable plans can be a challenge, especially for remote and hybrid teams. An idea whiteboard offers a simple yet powerful way to capture, visualize, and collaborate on ideas all in one place. Whether you’re brainstorming, planning, or tracking progress, this digital tool helps teams stay aligned and creative. In this guide, you’ll learn what an idea mapping whiteboard is, why it’s essential for projects, how to use it effectively, and discover ready-to-use templates that make getting started easy.
Innovation starts with a single spark — a great idea. But turning that spark into a breakthrough requires more than just creativity; it demands a clear, collaborative space where ideas can grow, connect, and evolve. That’s where a Board of Ideas comes in. Whether you’re leading a startup, managing a team, or driving strategic change, a well-structured ideation board acts as the foundation for capturing and shaping innovation. In this guide, we’ll explore what an idea generation board is, how to set one up effectively, and how to use proven frameworks and tools to unlock your team’s creative potential. Let’s dive in and transform the way you innovate.
In fast-moving hybrid work environments, capturing and prioritizing ideas across teams can be chaotic. That’s why more teams today are asking: What is an idea board?
In today’s fast-paced, collaborative environments, having a structured space to capture and grow ideas is essential. Idea boards for work provide that space, serving as a digital hub where teams brainstorm, organize thoughts, and align on next steps. Whether you’re planning a product roadmap, leading a workshop, or ideating a new campaign, idea boards keep your team focused, engaged, and moving forward.
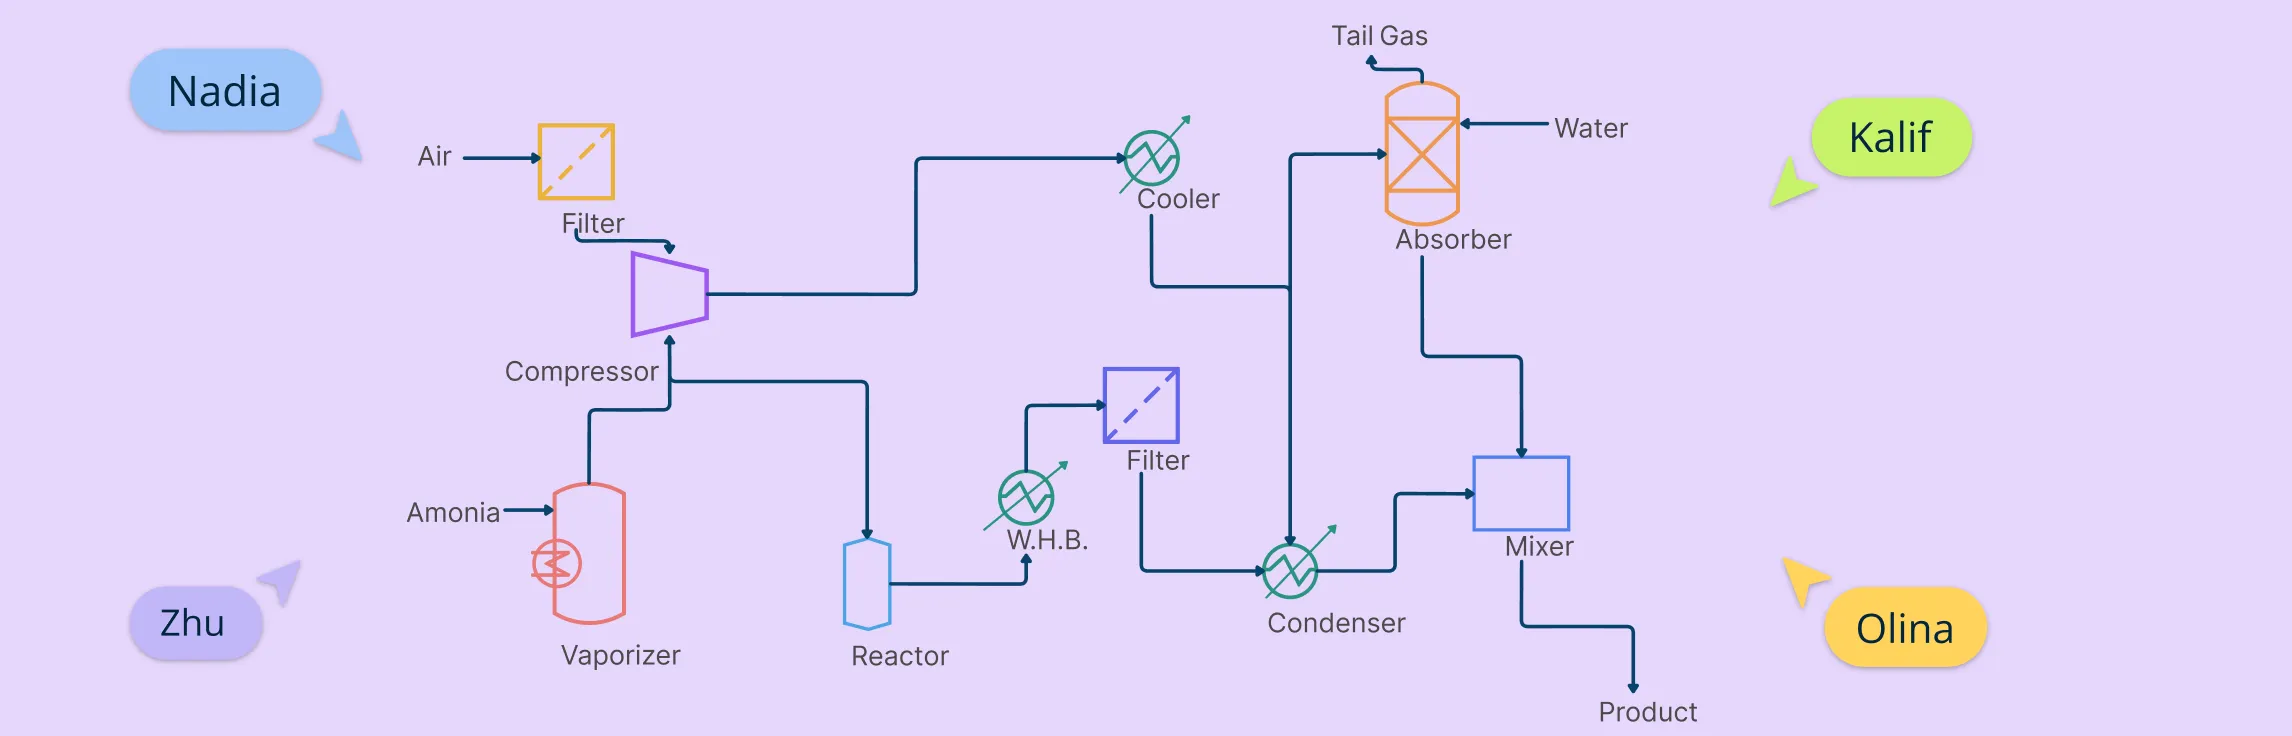
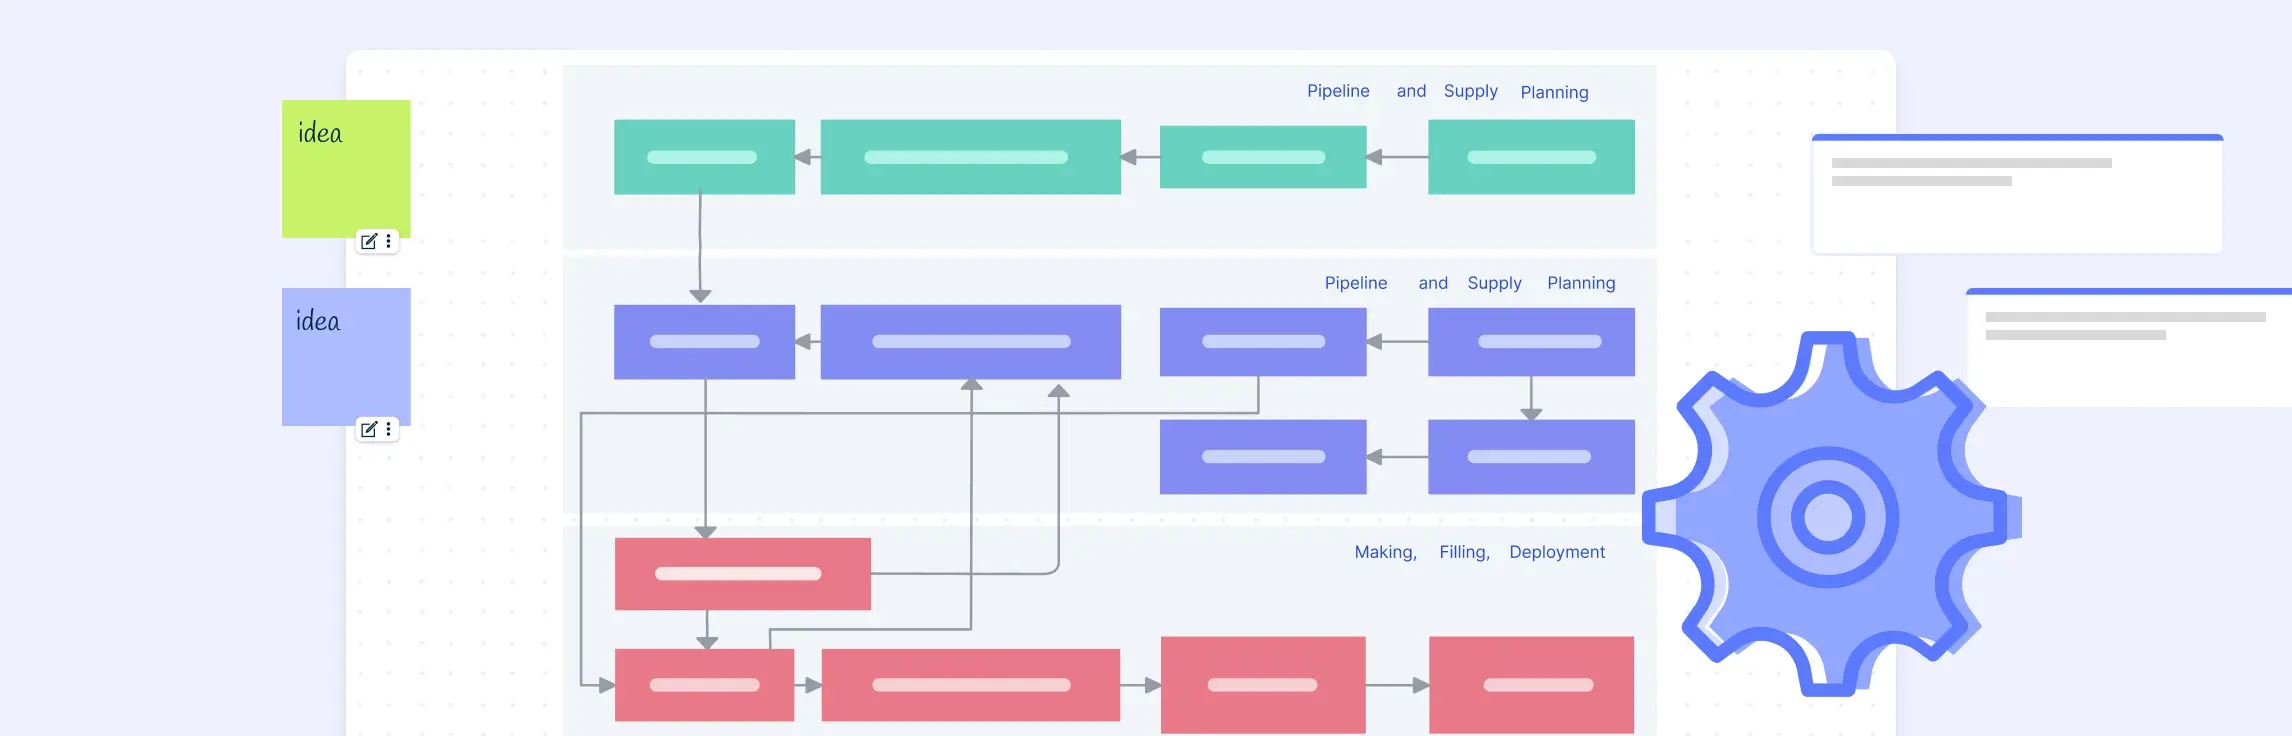
If you work in chemical, mechanical, or process engineering, chances are you’ve come across a process flow diagram (PFD). These aren’t your everyday business flowcharts—they’re high-level technical blueprints that show how materials and energy move through a system. In this guide, we’re going beyond the theory. You’ll learn how to create a process flow diagram, step by step.
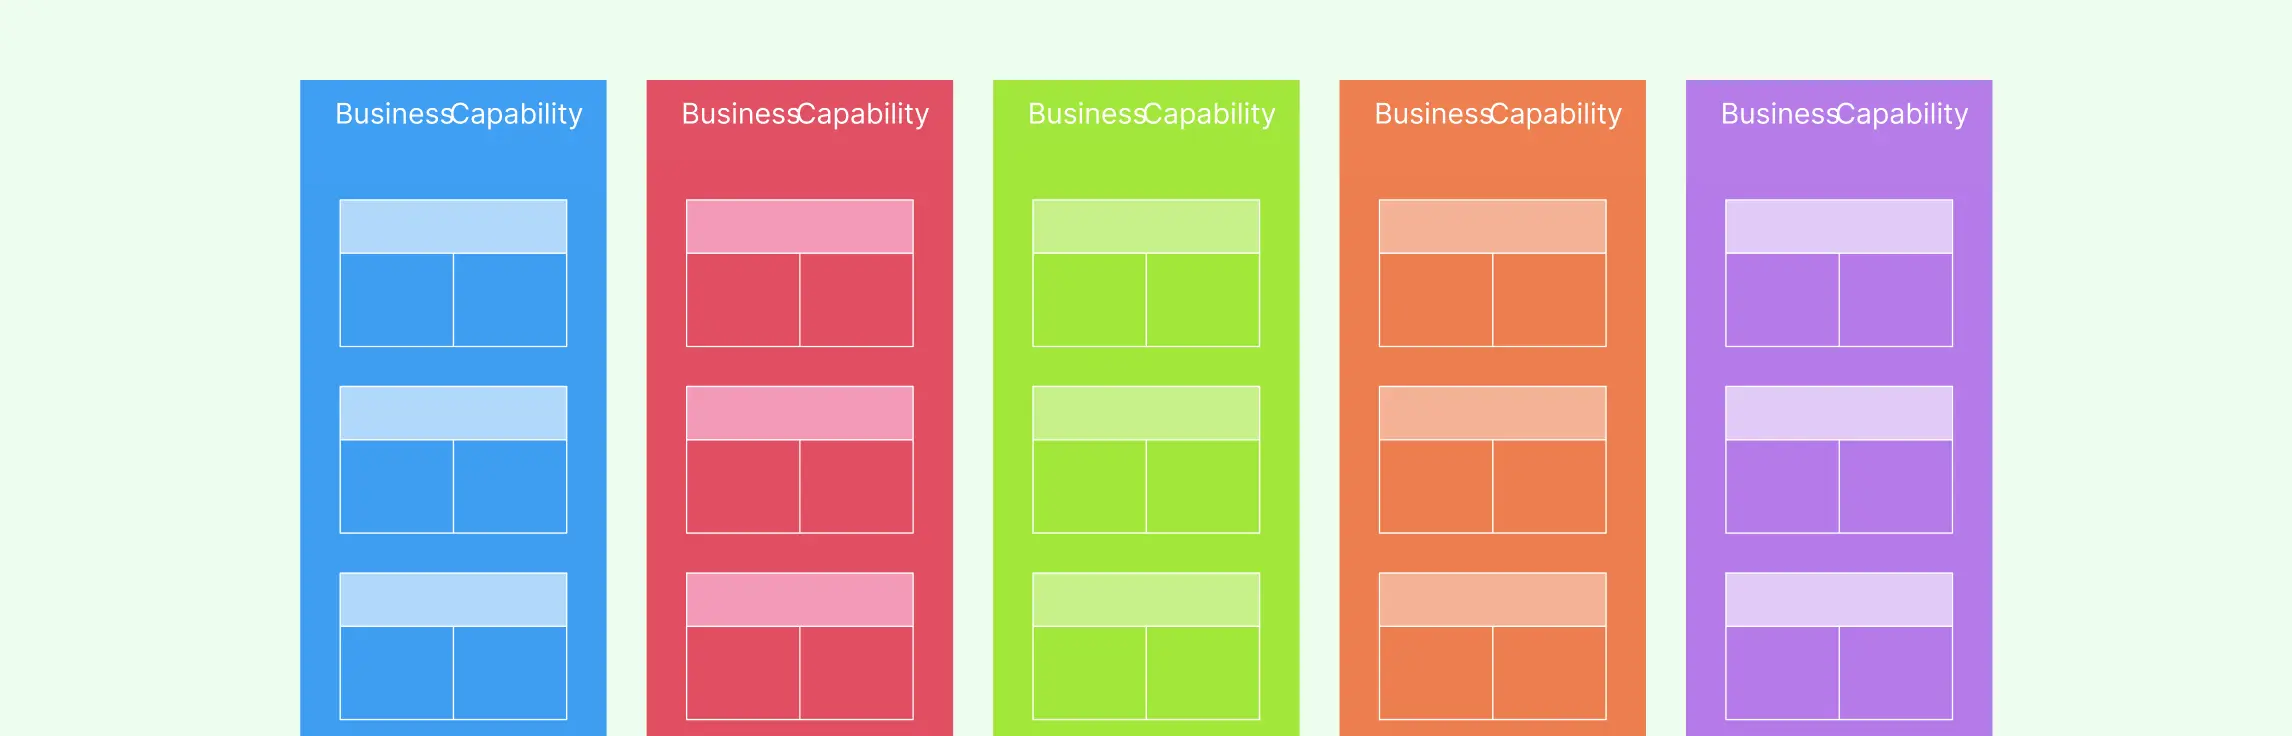
What Is an Enterprise Capability Model An enterprise capability model is a structured, hierarchical representation of what an organization does, independent of how, where, or by whom the work is performed. It defines an organization’s capabilities—the core functions or outcomes it must deliver to succeed—without tying them to specific processes, systems, departments, or people.
What Is a Business Capability Model? A business capability model is a visual representation of what a business does to deliver value, completely independent of how it’s done, who does it, or what systems are used.
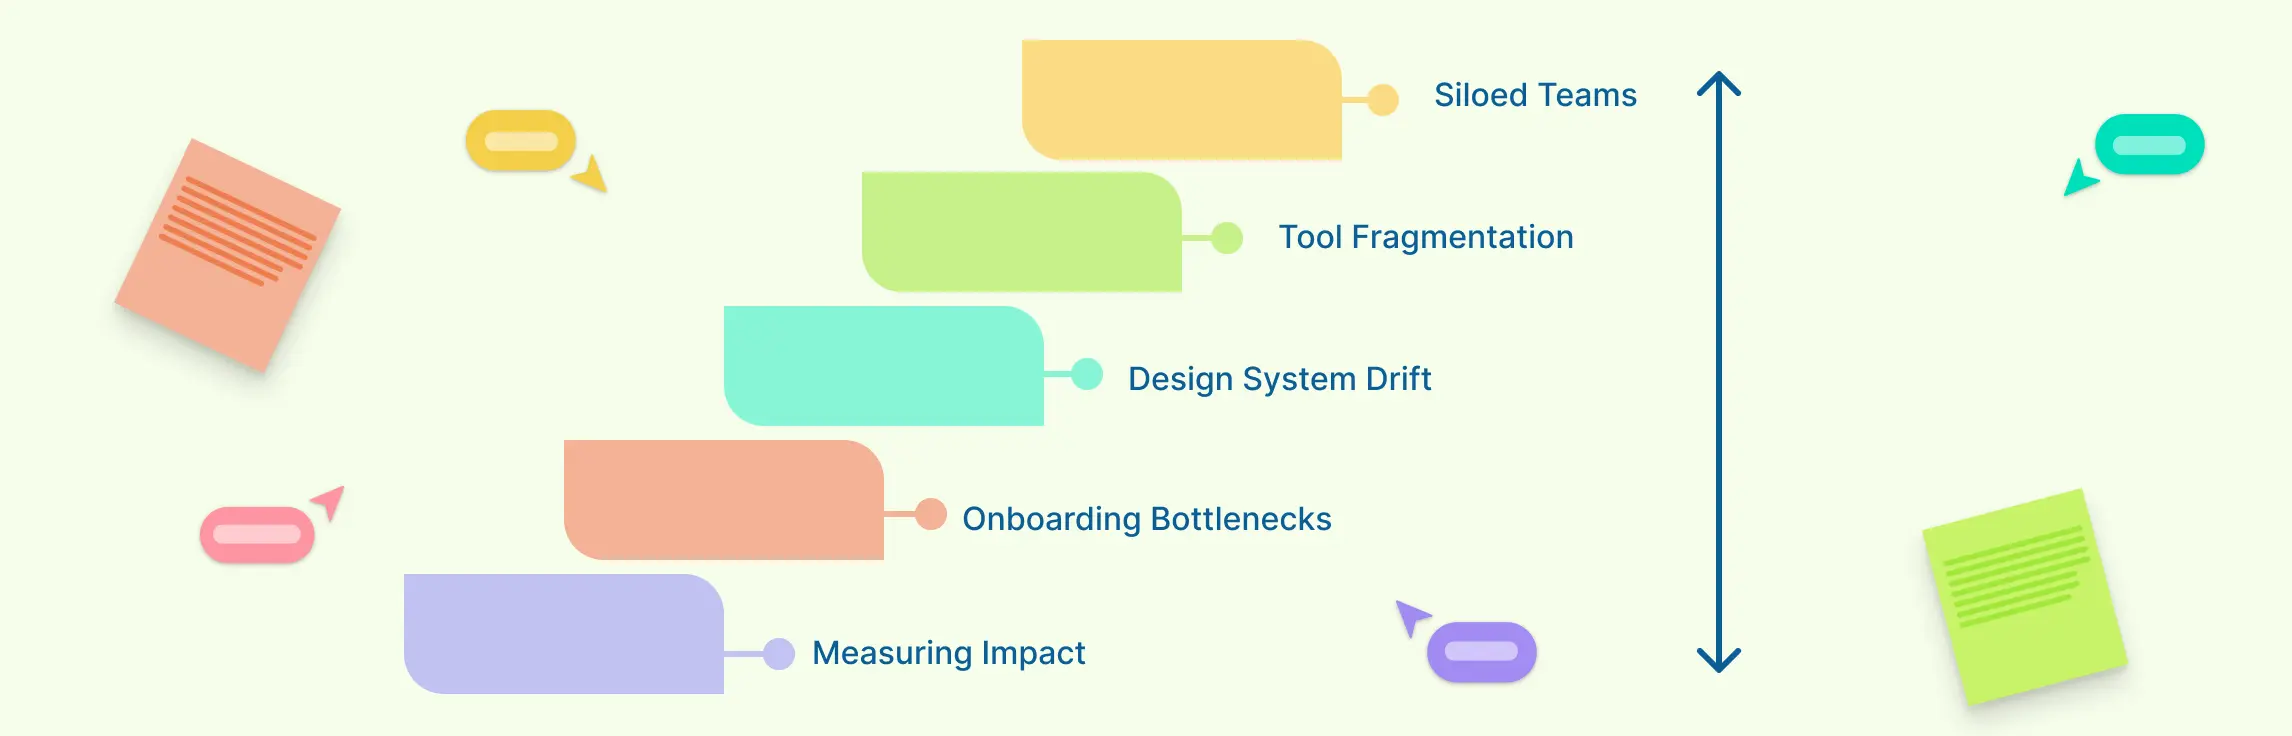
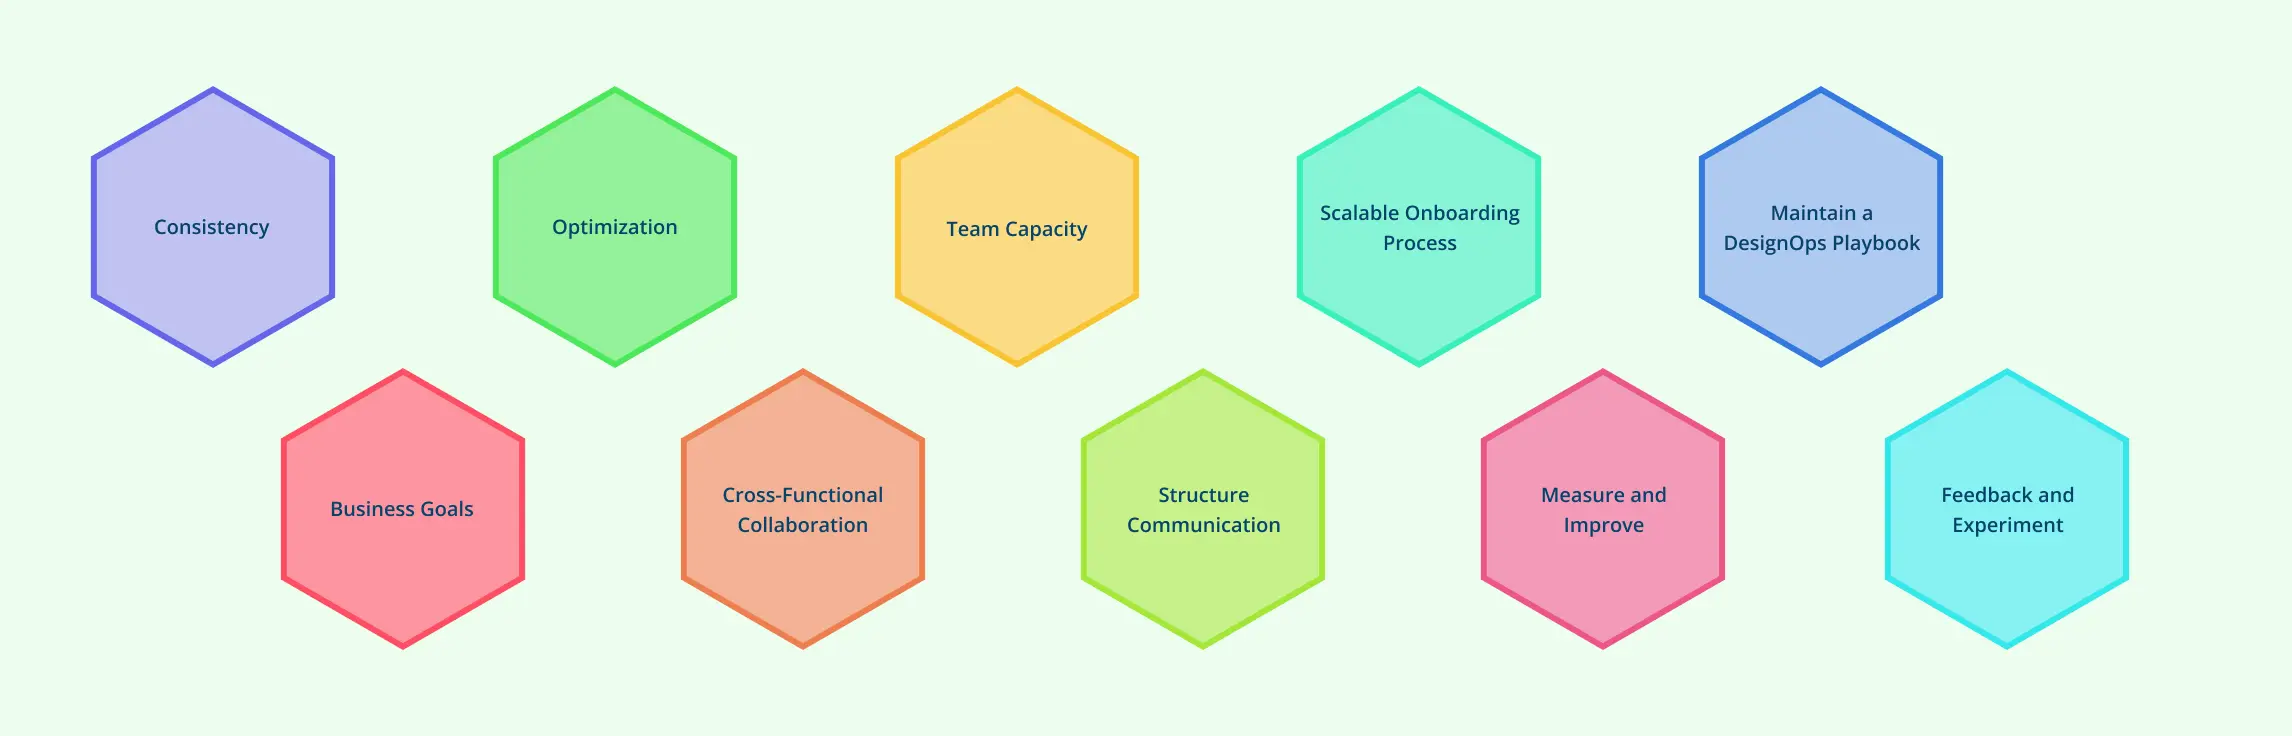
What Is Scaling Design Operations? Scaling design operations means orchestrating people, tools, workflows, and metrics to help design teams deliver consistent, high-quality outcomes across products, regions, and teams. Unlike traditional DesignOps, which focuses on optimizing for individual teams, scaling design operations supports growth by integrating governance, standardization, and measurement into the design process, ensuring brand consistency and operational efficiency across the enterprise.
In today’s fast-moving product environment, managing design at scale requires more than talent and creativity. As teams grow and workflows become more complex, organizations are turning to design operations tools to bring structure, consistency, and speed to the design process.
1. Standardize Workflows for Consistency Use playbooks, templates, and process maps to define how work flows from discovery to delivery. This ensures alignment and reduces confusion across teams.
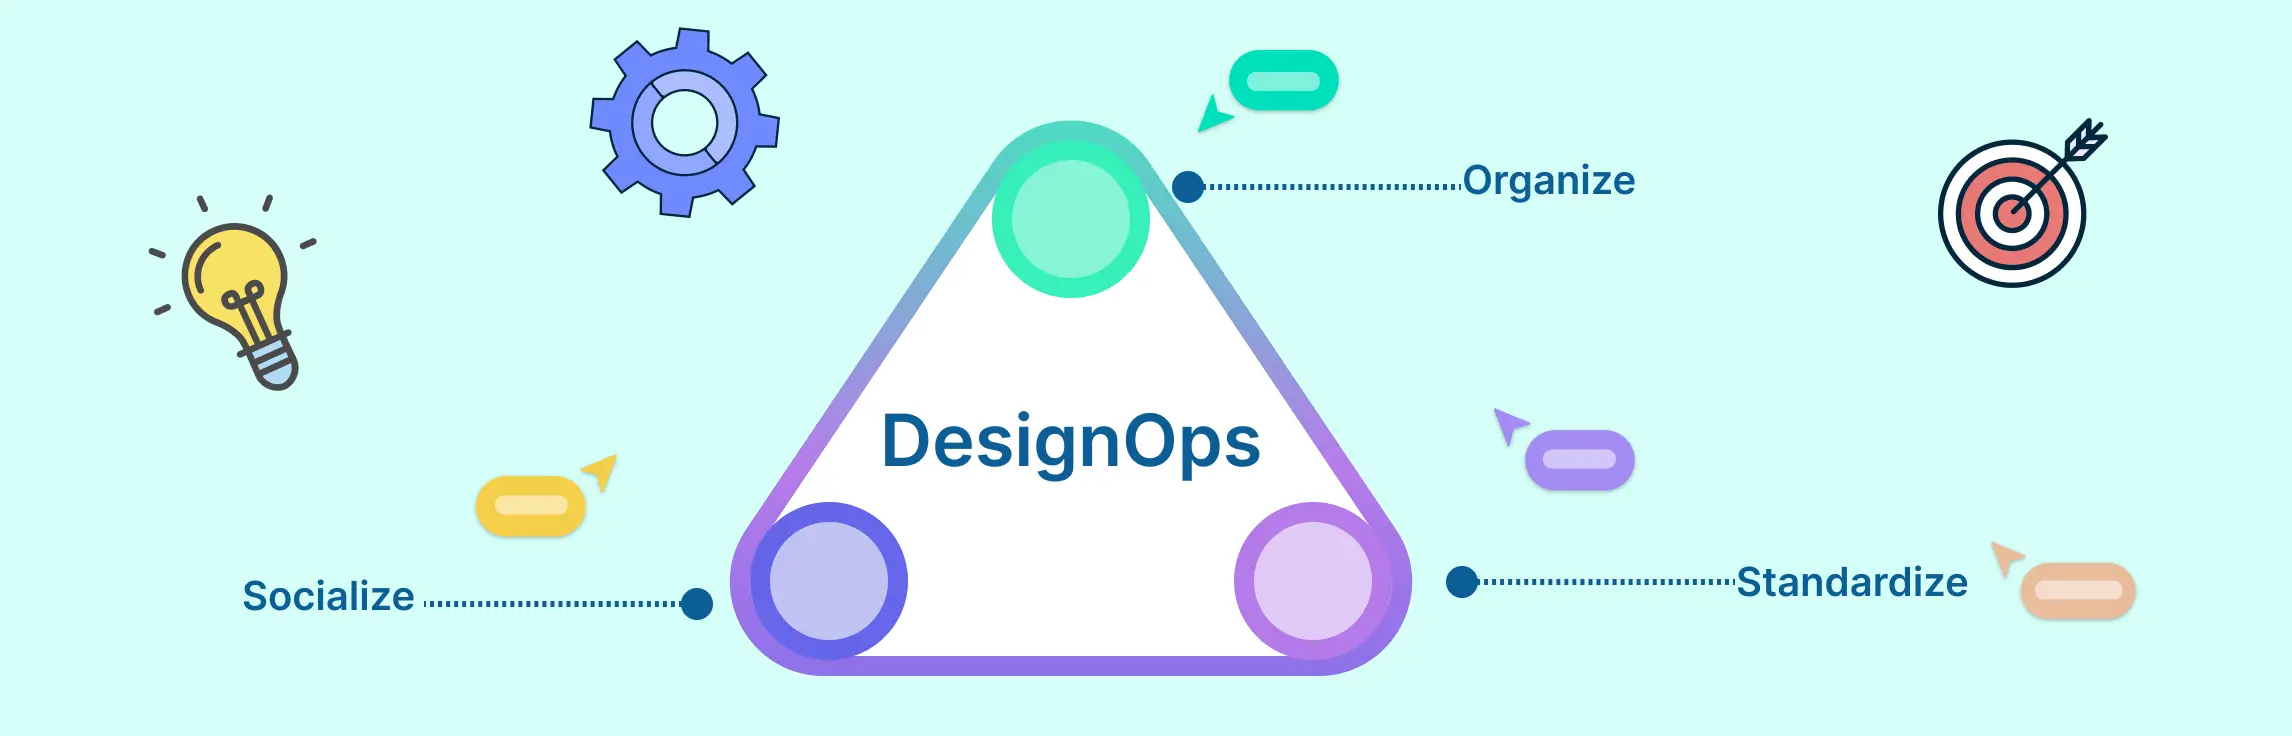
Design teams are growing, tools are multiplying, and deadlines are shrinking. Sound familiar? That’s where DesignOps steps in. Design Ops is the operational foundation that supports design teams. It standardizes tools, processes, people, and metrics to streamline collaboration between design, product, and engineering.
What is Reverse Thinking Reverse thinking is a problem-solving approach derived from classical inversion logic. Instead of pursuing direct solutions, you simply flip challenges on their head, asking: “How could this fail?” or “What would make this worse?” This method uncovers hidden assumptions and unseen risks that traditional forward thinking often overlooks.
A business capability map is a high-level view of what your organization does to deliver value, focusing on core areas like customer management, product development, or logistics. It strips away the complexity of roles and processes to highlight the actual capabilities that drive the business. In strategic management, capability maps help leaders see where the organization is strong, where it needs improvement, and where to invest. They provide a clear, shared view that connects strategy with real execution. Let’s see how to use business capability maps for strategic management.
Creating a business capability map might sound complex, but it’s really about stepping back and taking a thoughtful look at what your business needs to be able to do — not how it does it or who does it. The goal is to create a big-picture view of your organization’s abilities so you can plan better, make smarter decisions, and stay aligned. Let’s see how to create a business capability map.
Organizations seeking a competitive advantage are increasingly adopting the Design Thinking Model—a structured, user-centered framework that fuels innovation. This iterative methodology breaks innovation into six phases: Empathize, Define, Ideate, Prototype, Test, and Implement.
Is your design team seen as a strategic powerhouse—or just a cost center? Design teams today face mounting pressure to justify their impact. As creative work scales across products and channels, measuring design ops has become crucial for proving value, securing budgets, and optimizing processes. This guide breaks down how to measure ROI in design operations, track meaningful KPIs, and use frameworks and templates to maximize business outcomes.
What Are the Principles of Design Thinking? Design thinking principles are human-centered mindsets that guide iterative problem-solving and innovation. Rather than following strict, linear steps, these core values—such as empathy and collaboration—promote flexibility, faster adaptation, and deeper team alignment. This approach reduces waste and drives meaningful solutions by focusing on real user needs. As demand for design thinking skills soars, professionals like product managers and UX designers use these principles to enhance impact and career growth. This guide explores the five key principles and shows how Creately’s tools help teams apply them effectively for better outcomes.
Design is no longer just about pixels and prototypes—it’s a strategic force behind every successful product. But as teams grow and projects scale, creativity alone isn’t enough. Without the right structure, even the best design teams risk chaos, duplication, and delays. That’s where a Design Operations Framework comes in. It brings the order, efficiency, and alignment needed to turn great ideas into consistent, high-impact outcomes—fast.
Stuck solving the same problems the same way? Design thinking flips the script. It’s a human-centered approach to innovation that helps teams uncover real user needs, spark fresh ideas, and test solutions fast. In this guide, we explore what design thinking is, why it matters, and how it’s used across industries.
Traditional problem-solving often hits roadblocks in ambiguity and shifting user needs. That’s where design thinking methodology stands out—offering a flexible, human-centered approach to uncovering insights, prototyping quickly, and delivering solutions that truly resonate.
What Is Reverse Brainstorming? Reverse brainstorming is a creative methodology that starts by asking participants to identify ways to worsen a problem or obstruct a desired outcome. By deliberately generating negative actions, causes, or scenarios, teams can later flip each idea into constructive, positive solutions. This inverse approach of reverse brainstorming encourages deeper exploration of pain points and uncovers hidden factors that might never emerge during conventional brainstorming.
Problem-solving tools are methods, techniques, or visual aids that help individuals and teams understand problems, find their causes, and identify effective solutions. These tools organize thinking, guide the decision-making process, and improve how people approach challenges—whether simple or complex.
Ever wondered how the world’s most innovative teams consistently solve problems that truly matter? It all starts with the design thinking process—a user-centered, repeatable approach that sparks creativity, uncovers real needs, and leads to solutions that make a difference.
A business capability map is a visual representation that shows what an organization is able to do. It doesn’t focus on how the work gets done, who does it, or what tools are used. Instead, it outlines the core abilities that allow the business to operate, deliver value to customers, and achieve its goals. These abilities, called capabilities, are stable over time even when processes, people, or technologies change.
Are you looking for a brand new approach to boost your creative thinking and problem-solving skills? Did you know that reverse brainstorming can be an effective alternative to traditional methods for generating fresh ideas? Would you like to find out how AI-powered reverse brainstorming can simplify your day?
Process Flow Diagram (PFD) software is essential for businesses looking to visualize workflows, map out operations, and improve efficiency. These tools help teams create structured diagrams that simplify complex processes, making it easier to identify bottlenecks, optimize performance, and enhance collaboration.
A screen flow diagram is a visual tool that shows how users move through an app, website, or software. It maps out the different screens, the paths between them, and the decisions users make along the way. By laying out this journey step by step, teams can design smoother, more intuitive digital experiences.
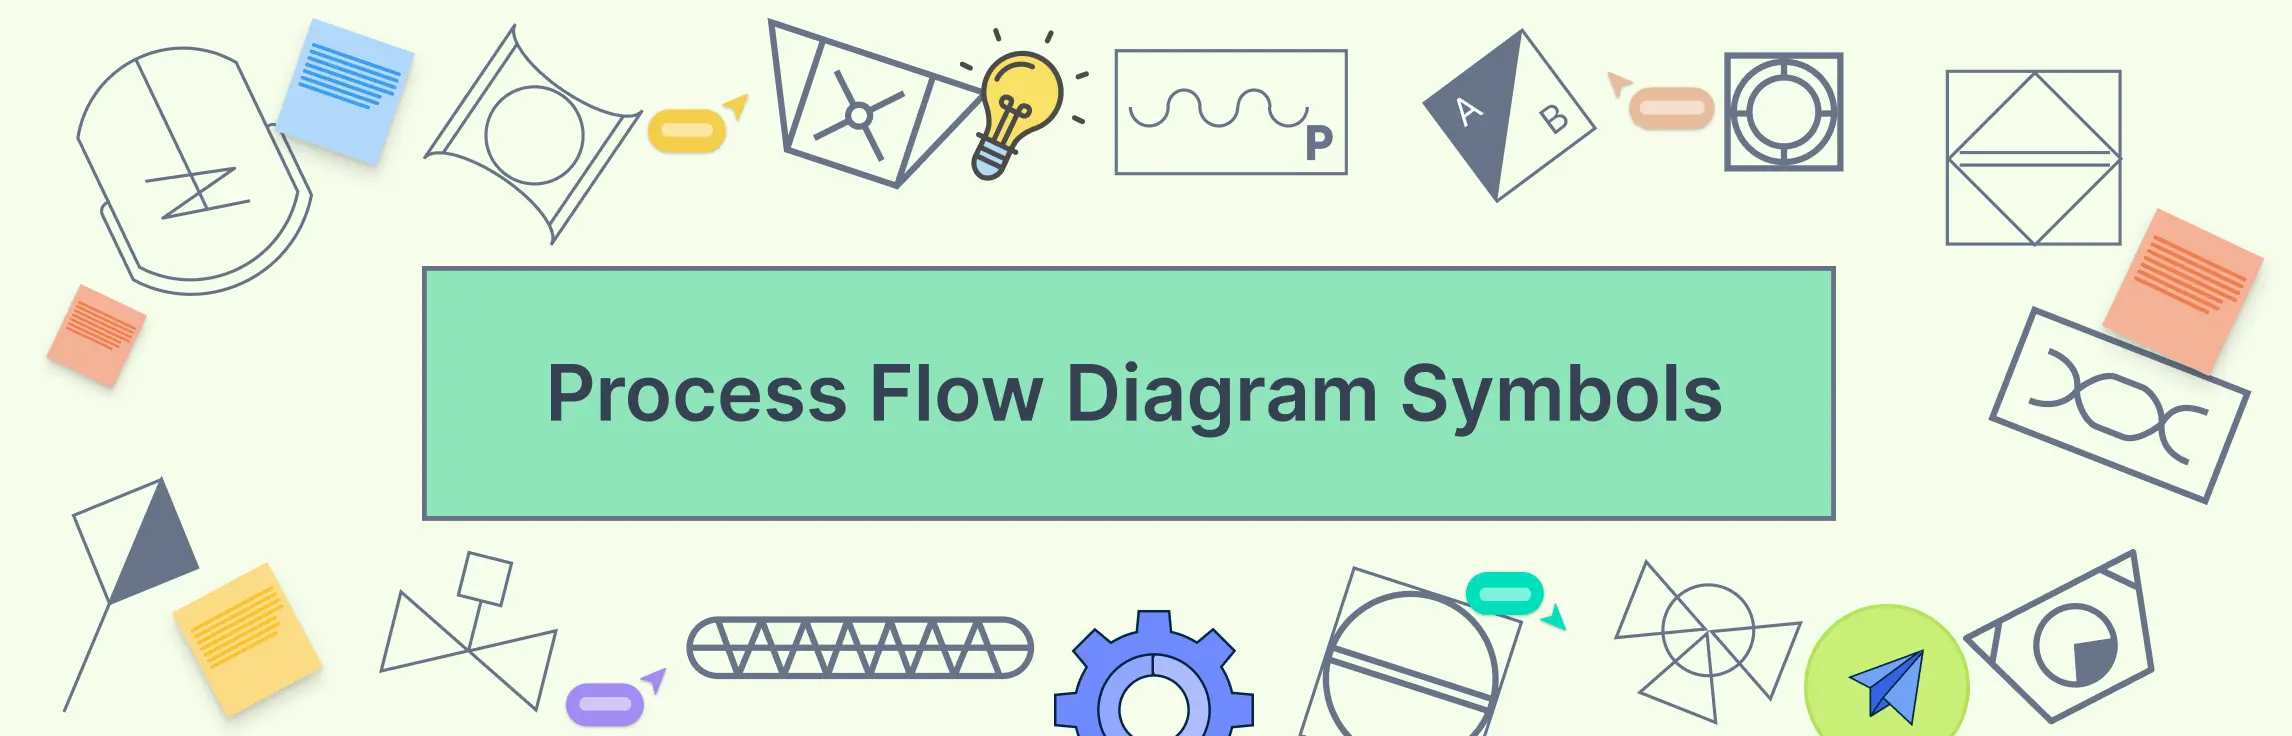
A process flow diagram (PFD) visually maps out the steps in a process from start to finish using standard symbols. It helps teams understand, analyze, and improve workflows across fields like engineering, business, and software. This guide explains what a PFD is, its main components, key symbols, and why it’s useful.
PFD symbols represent the key equipment, lines, and instruments in a process, helping you visualize how materials flow through a system. Knowing these symbols makes reading and creating PFDs easier.
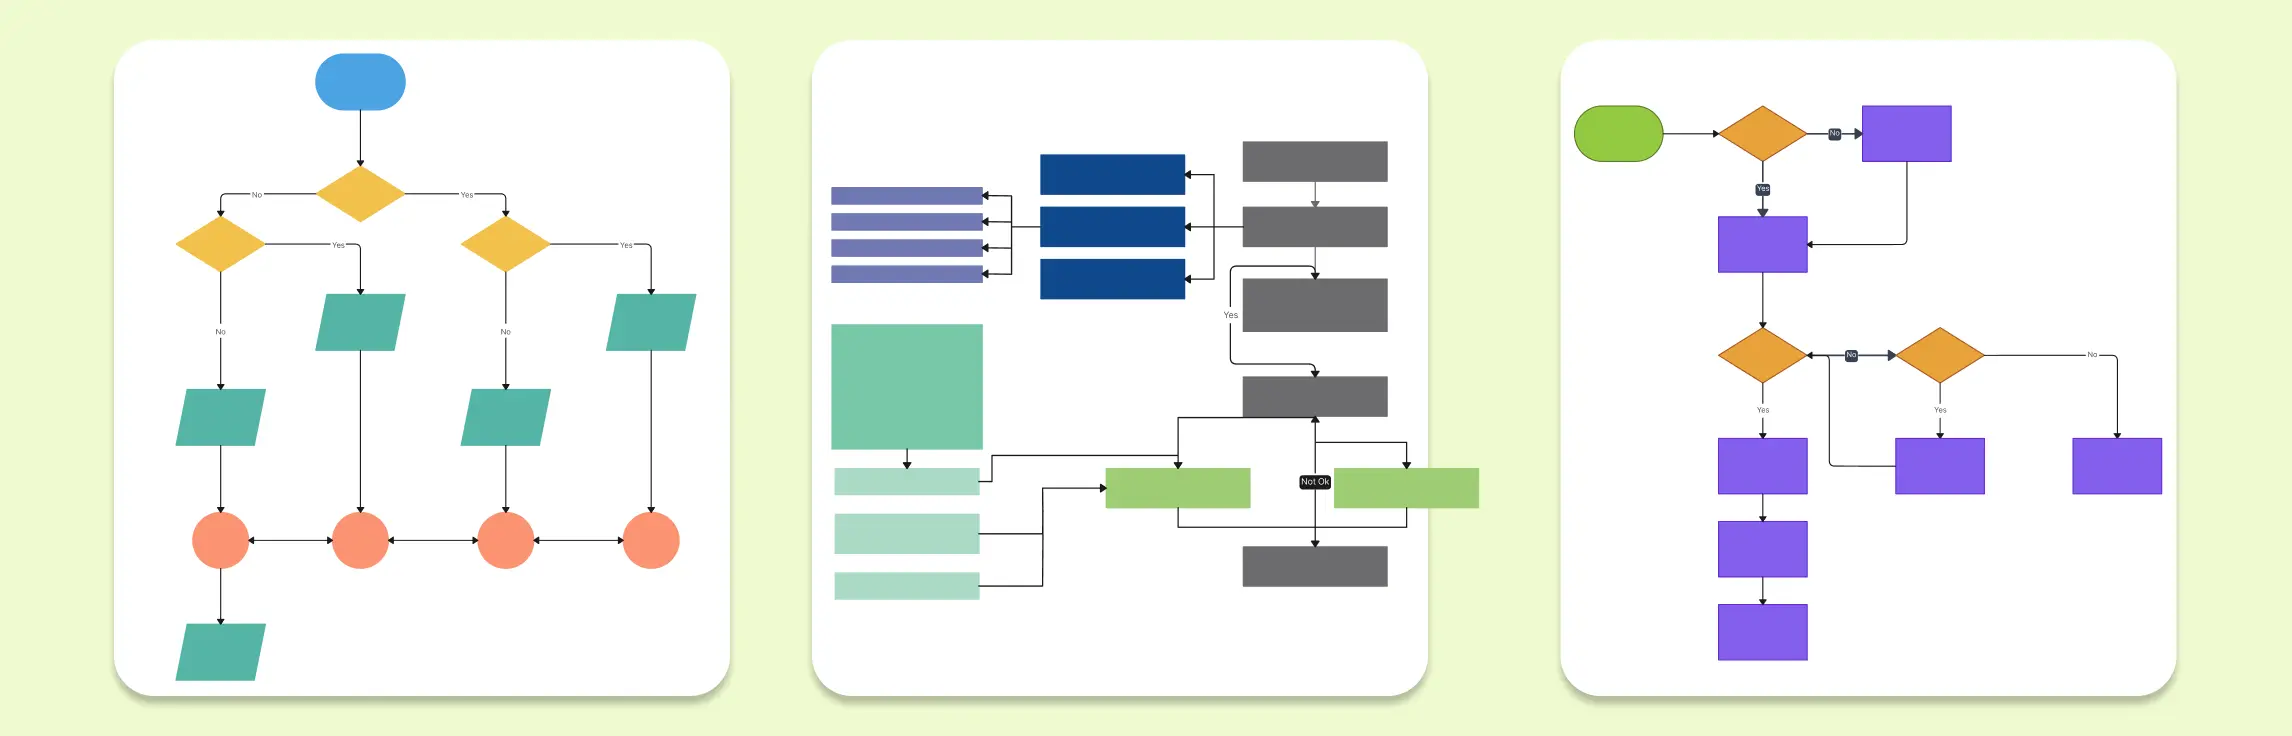
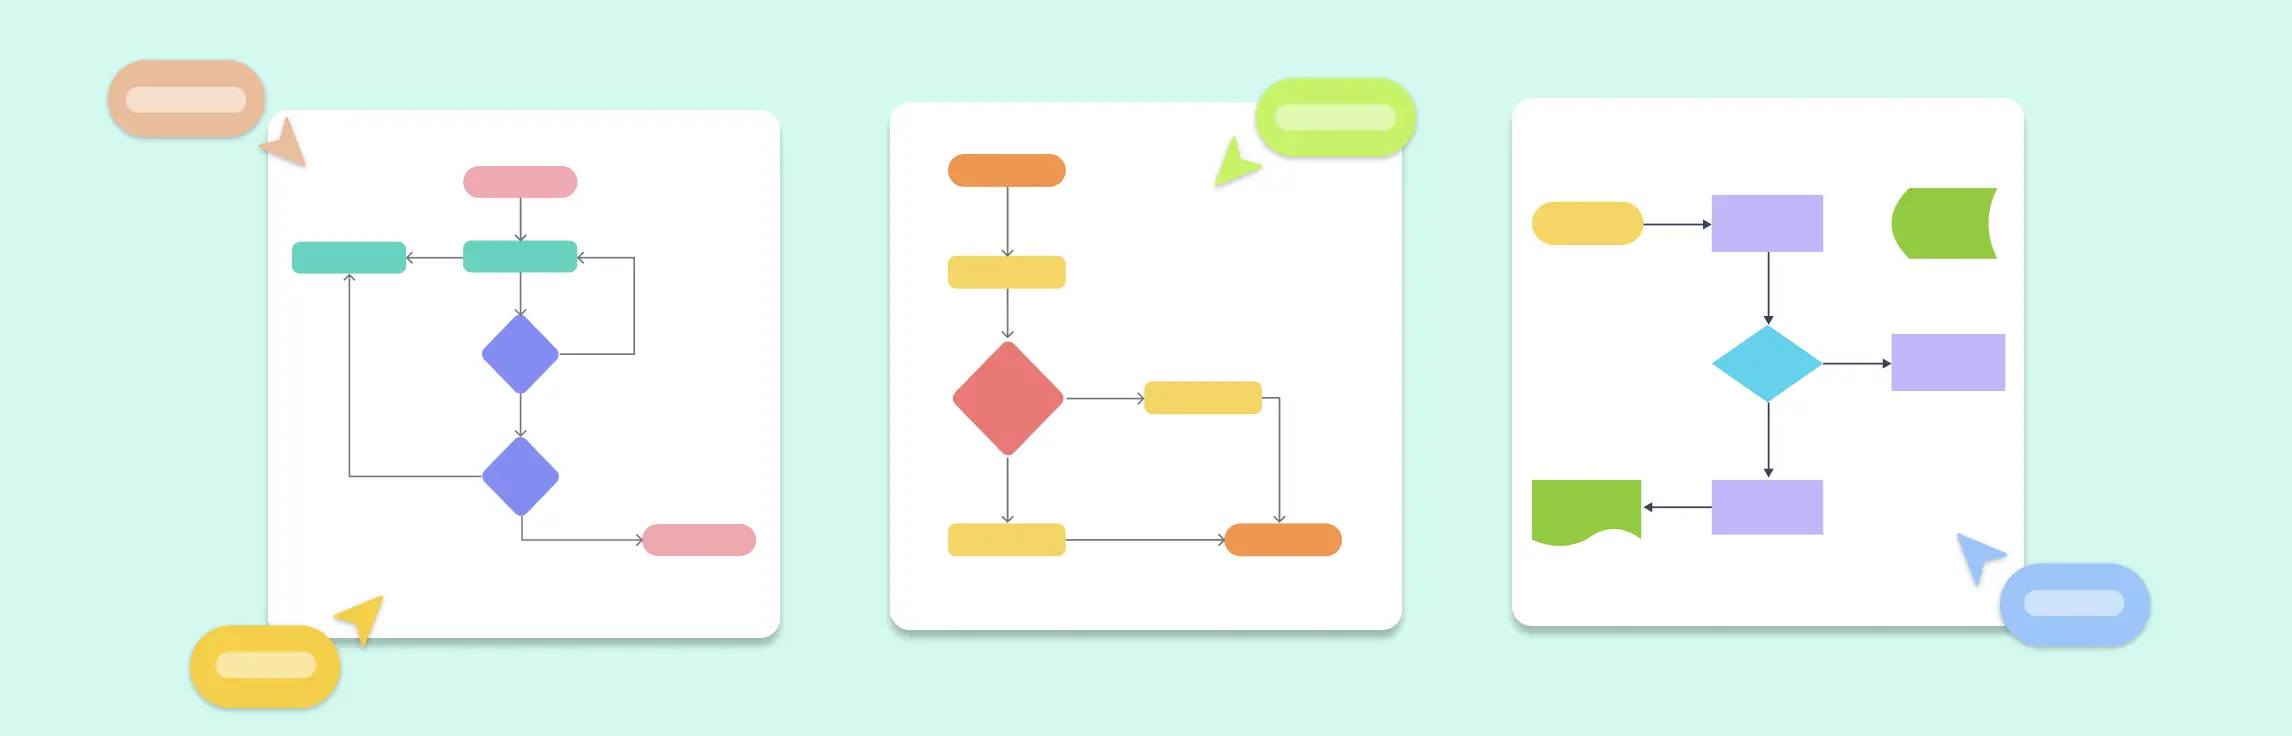
Flowcharts are one of the simplest yet most powerful tools for visualizing processes, making them easier to understand and optimize. In this guide on flowcharting basics, we’ll walk you through the essential symbols, best practices, and ready-to-use templates to help you create clear and effective flowcharts.
Flowcharts play a crucial role in programming by offering a structured way to represent algorithms, decision-making processes, and logic flow. Whether you’re designing an if-then statement, outlining a program structure, or developing an application workflow, flowcharts provide clarity and improve debugging efficiency. This guide presents a comprehensive collection of programming flowchart examples, helping developers, students, and professionals streamline coding processes.
Flowcharts are powerful tools that simplify complex processes, visualize workflows, and aid in decision-making. Whether you’re designing a customer journey, mapping out business processes, or planning project tasks, flowcharts help present information in a clear and structured format. This guide presents a collection of flowchart examples for business, offering templates that cater to diverse operational needs.
An action plan for career growth provides a structured roadmap to help individuals set, track, and achieve their professional goals. Whether you’re advancing in your current role, switching industries, or developing new skills, a well-defined plan ensures steady progress. Here are 10 examples of career action plans to help you succeed:
An Affirmative Action Plan (AAP) is a structured strategy that helps organizations promote diversity, equity, and inclusion by ensuring fair hiring, promotion, and workplace policies. These plans are essential for businesses committed to eliminating discrimination and fostering equal opportunities for all employees. Below is a list of 10 key affirmative action plan templates to guide organizations in creating a more inclusive workforce.
A Business Action Plan is a structured framework that helps organizations outline their goals, define strategies, and execute tasks efficiently. Whether launching a startup, expanding into new markets, or improving financial management, a well-designed action plan ensures clarity, accountability, and measurable progress. In this guide, we will share 10 Business Action Plan Templates to help businesses achieve their objectives effectively.
Every day, businesses and organizations handle countless documents—contracts, invoices, reports, and more. Keeping track of how these documents move from one step to another can get complicated. That’s where a document flowchart comes in.
A cross-functional flowchart is a simple but powerful tool that helps businesses and teams visualize their processes more clearly. Unlike a regular flowchart, it doesn’t just show the steps of a process—it also highlights who is responsible for each step. This makes it especially useful for teams that work across different departments, ensuring everyone understands their role in the bigger picture.
When mapping out processes, whether for business, software development, or everyday workflows, visual diagrams make things clearer. Two commonly used tools for this are flowcharts and activity diagrams. At first glance, they may seem similar—both show steps in a process—but they serve different purposes and are used in different fields.
Flowcharts are powerful tools for visualizing processes and making complex information easier to understand. Whether you’re mapping out a business process, designing software, or planning a project, flowcharts help you break down tasks step by step. However, to create clear and effective flowcharts, it’s important to follow certain flowchart rules.
Flowcharts are a great way for students to organize thoughts, simplify complex tasks, and improve problem-solving skills. In this guide, we’ll explore flowchart examples for students that cover various academic and personal scenarios, from solving math problems to planning study routines.
Flowcharting is an effective way to visualize processes, helping you better understand, communicate, and improve the steps involved. Whether you’re mapping out business processes or personal workflows, flowchart ideas can help streamline tasks and enhance clarity. Below, we’ve compiled 10 flowchart ideas and editable flowchart templates you can test out using Creately’s intuitive diagramming software.
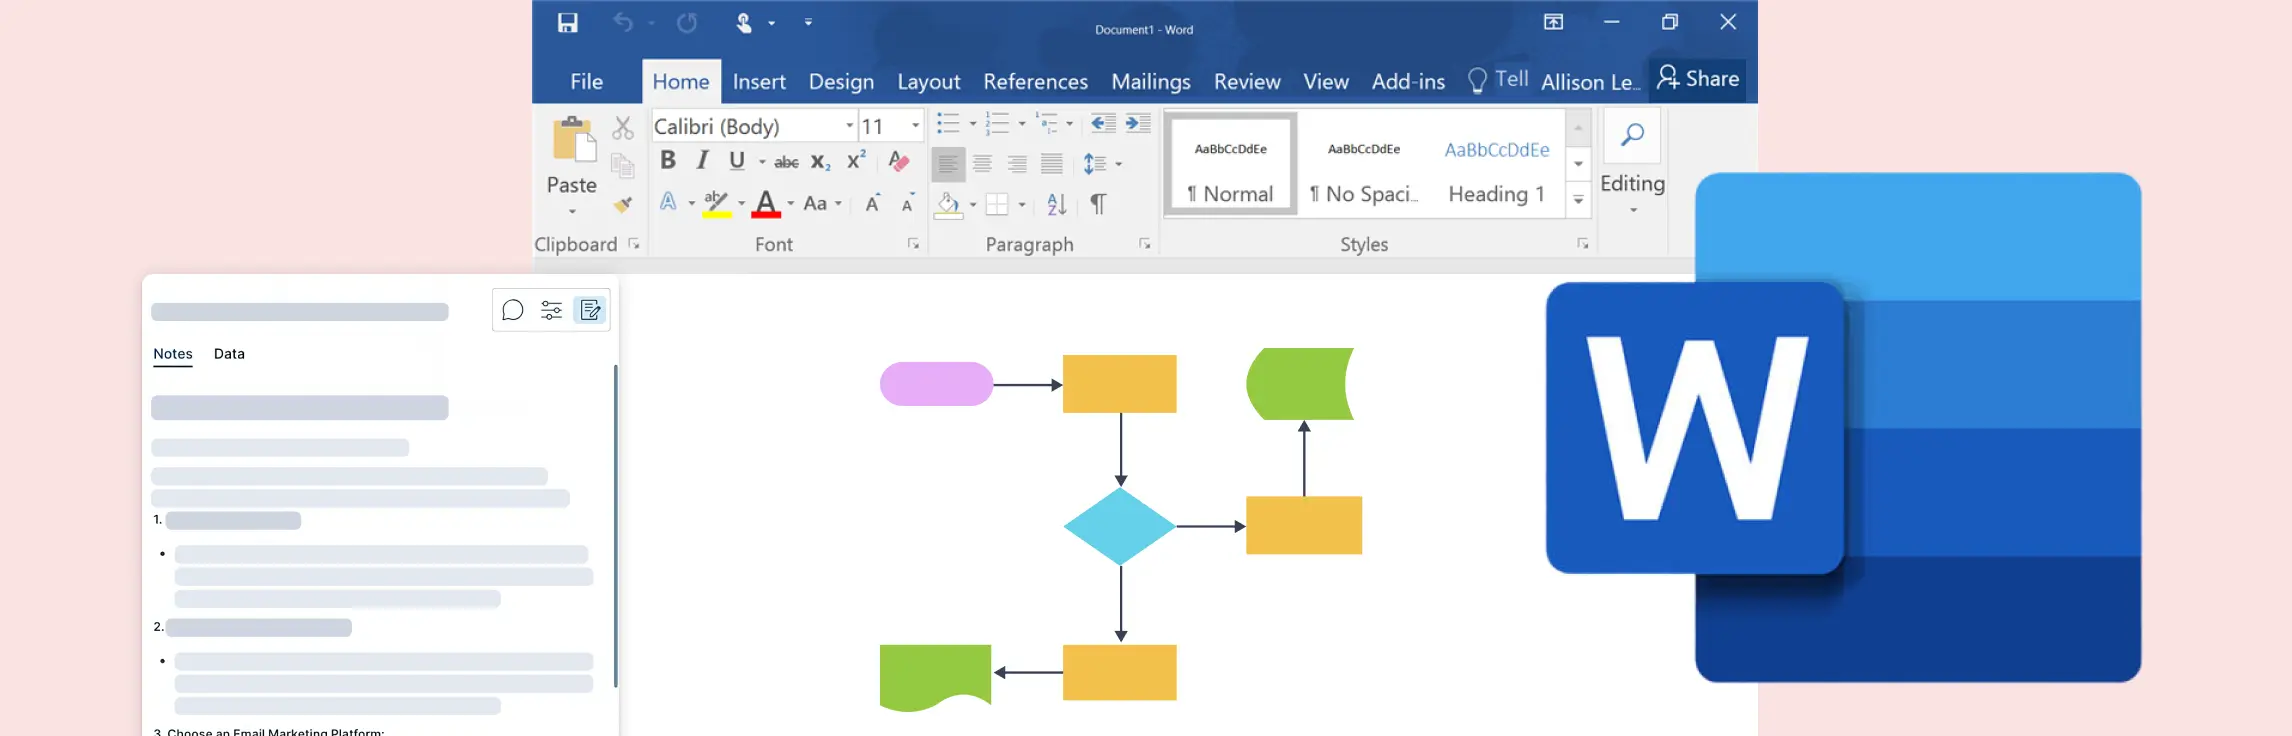
Flowcharts are essential tools for visualizing processes, workflows, and decision-making pathways. While Microsoft Word is primarily used for word processing, it also offers basic features to create flowcharts. This guide will show you how to make a flowchart in Word, covering different methods, tips, and best practices.
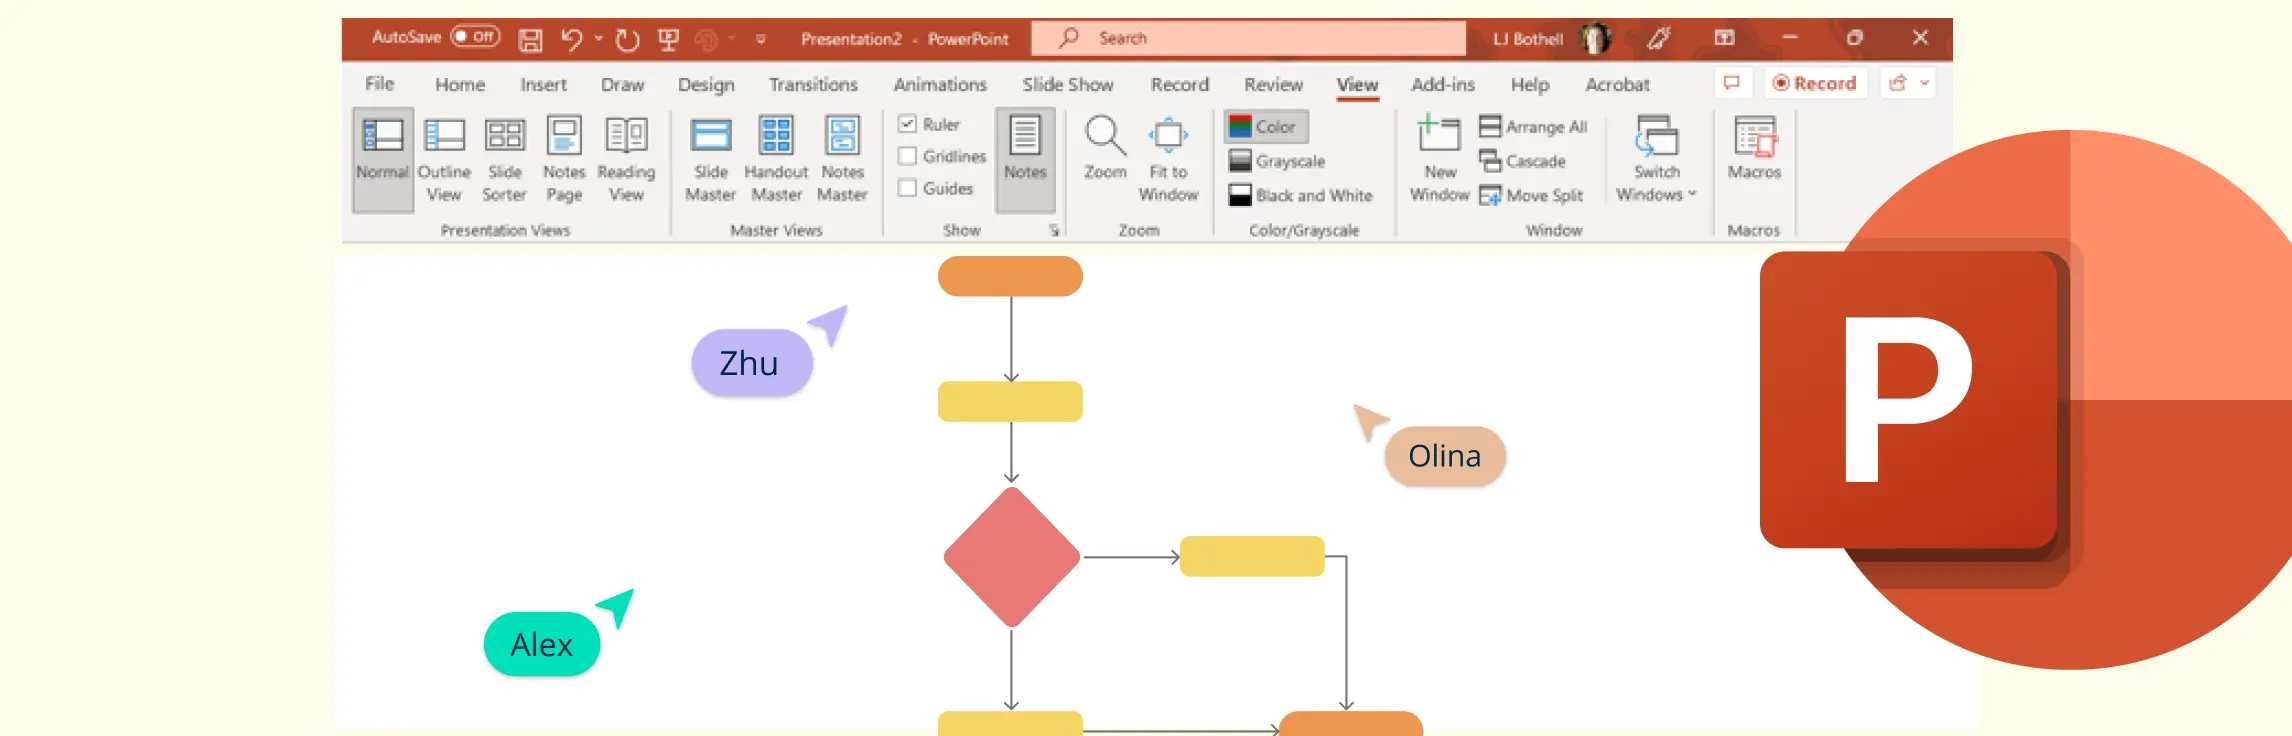
Flowcharts are valuable tools for illustrating processes, streamlining complex tasks, and enhancing presentations. Although PowerPoint is widely recognized for its presentation capabilities, it also provides effective tools for crafting polished flowcharts. This guide offers a step-by-step approach to creating a flowchart in PowerPoint.
Flowcharts are essential for illustrating processes, workflows, and systems. They simplify complex tasks, highlight inefficiencies, and help communicate ideas effectively. Although Excel is primarily recognized as a spreadsheet tool, it also includes features that enable users to craft clear and structured flowcharts.
Google Docs is typically a word processor, it can be adapted for creating basic concept maps. However, it has limitations compared to more specialized diagramming tools.
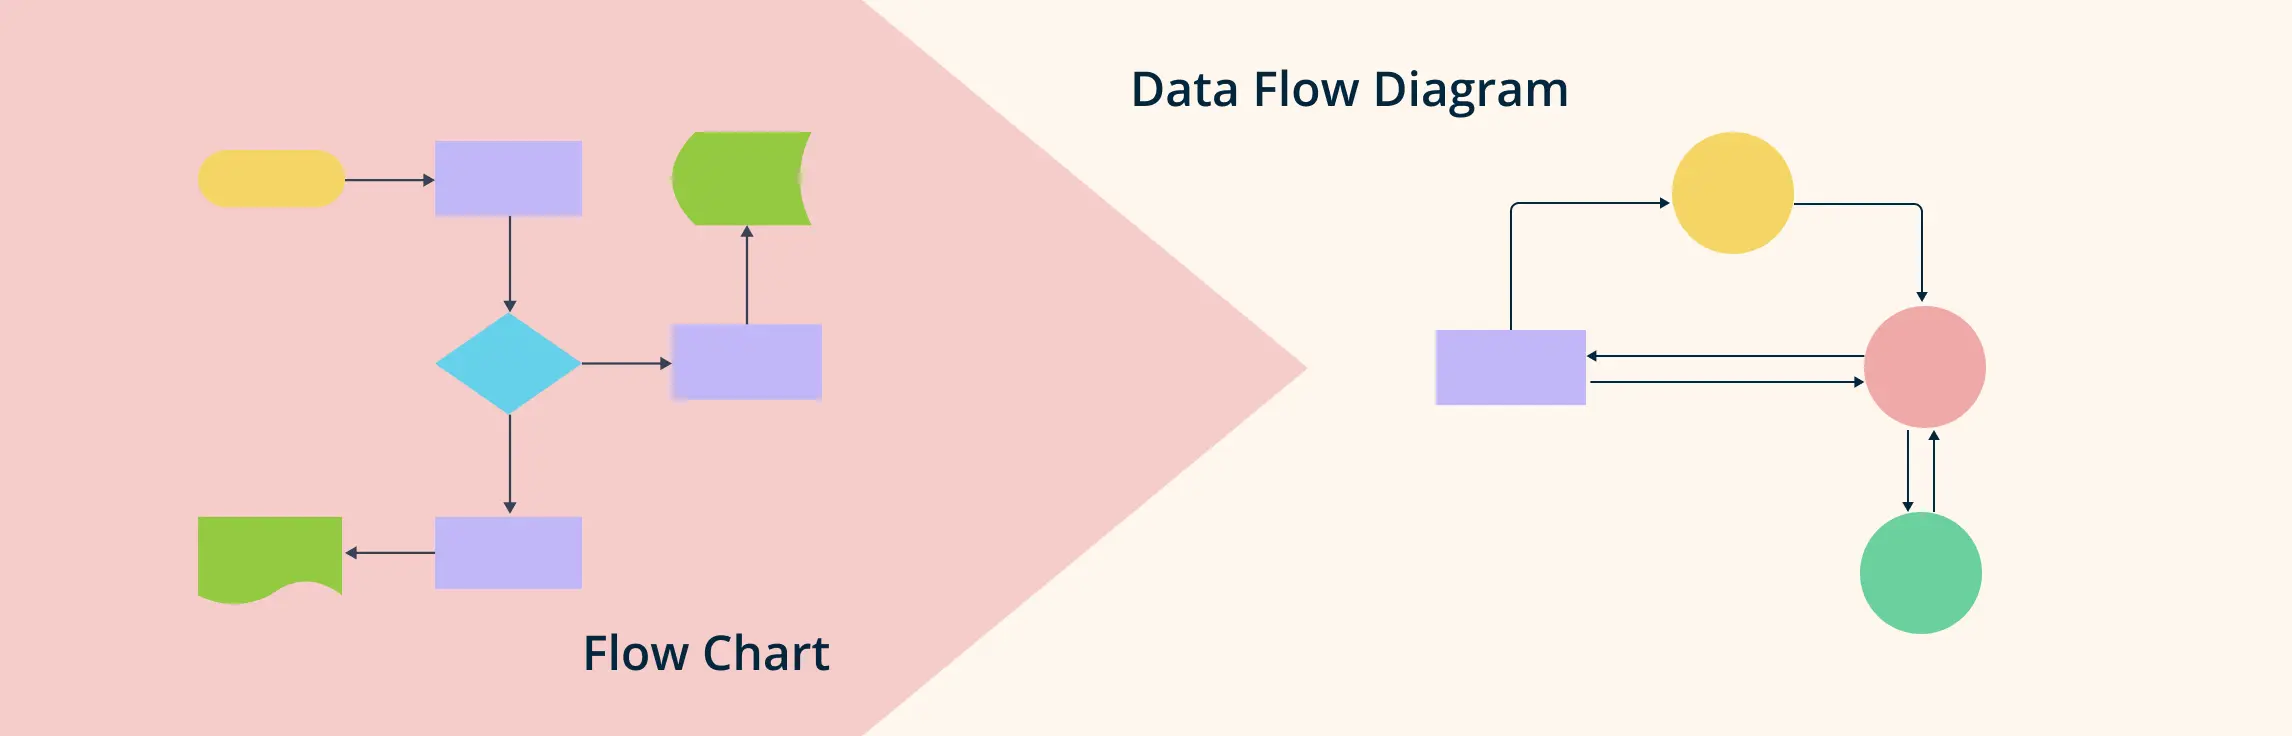
In today’s fast-paced world, visualizing data and processes is essential for clear communication and effective decision-making. Flowcharts and Data Flow Diagrams (DFDs) are powerful tools that help break down complex workflows, making them easier to understand and analyze. Whether you’re looking to map out a business process, analyze a data system, or improve communication within your team, flowcharts and DFDs can simplify the process and enhance collaboration.
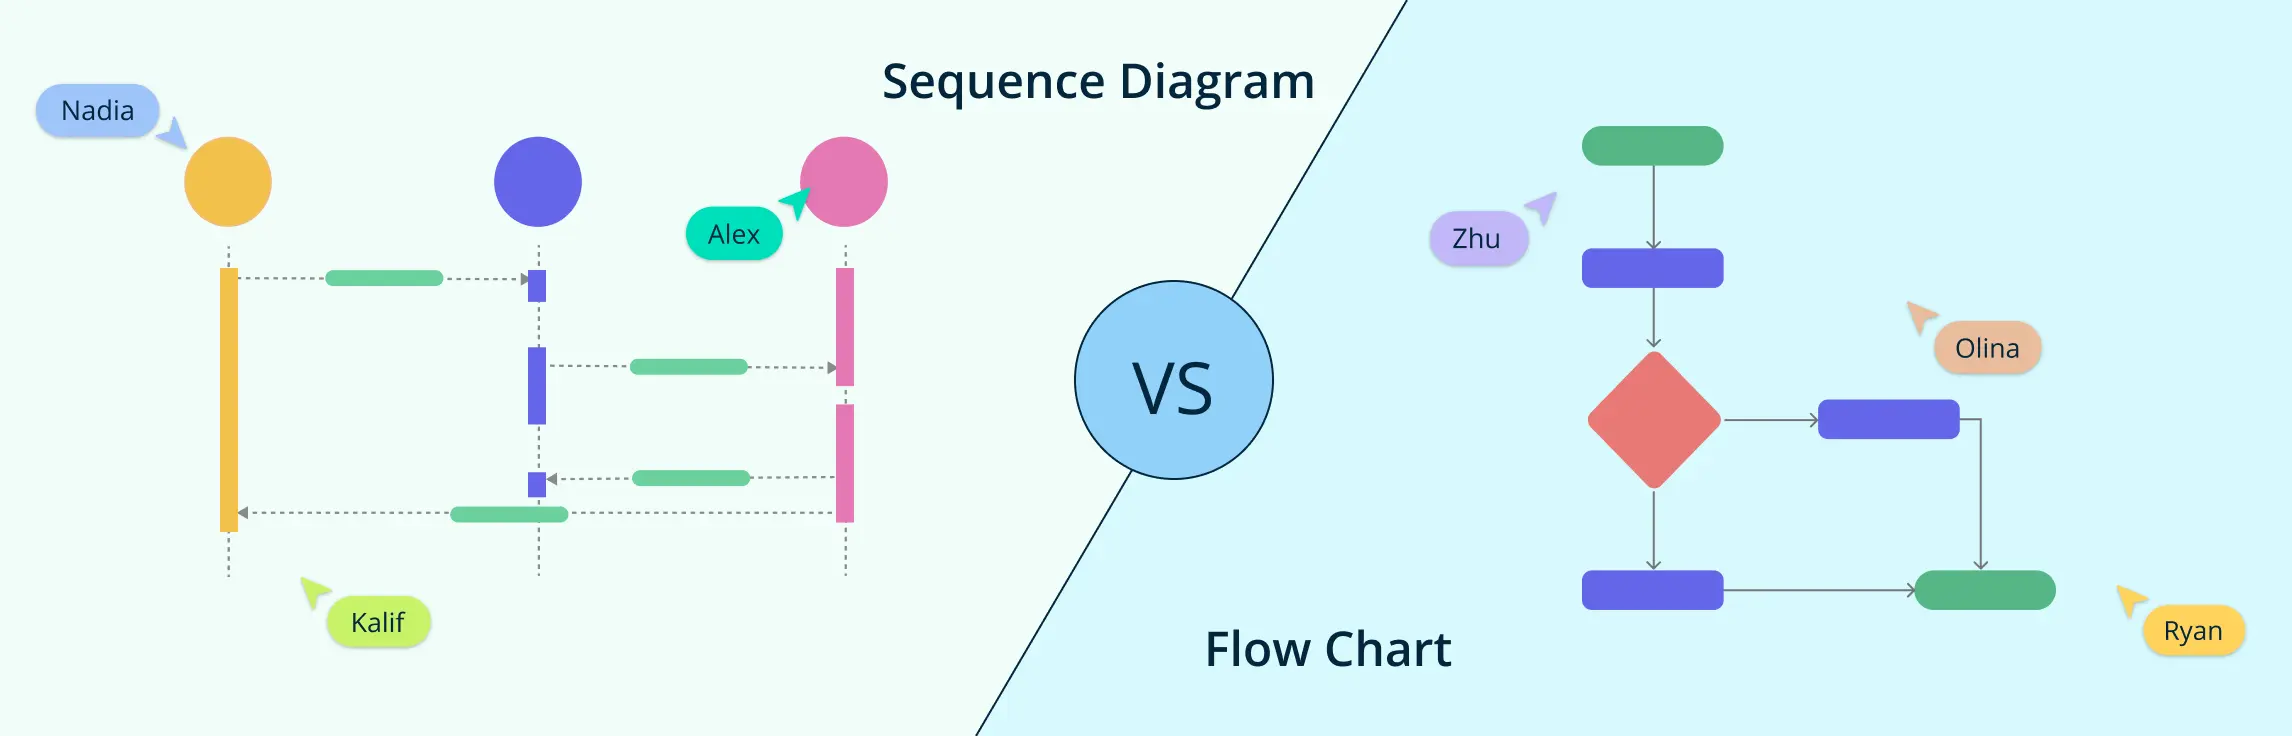
When it comes to visualizing processes and system interactions, two of the most commonly used diagramming methods are flowcharts and sequence diagrams. While both are powerful tools for representing workflows and system behaviors, they serve distinct purposes and follow different structures.
A flowchart loop is a fundamental concept in process automation and programming, allowing tasks to repeat based on a defined condition. Whether used in software development, workflow optimization, or decision-making processes, flowchart loops help visualize repetitive actions clearly and efficiently.
Mathematics can be a challenging subject for many students, and understanding complex concepts often requires a visual approach. Math graphic organizers are powerful tools that help simplify difficult topics, improve understanding, and make problem-solving more efficient. These organizers not only aid in organizing information but also provide a way for students to visualize mathematical relationships, patterns, and solutions. In this article, we will explore 8 essential math graphic organizers that can boost learning, comprehension, and problem-solving skills in mathematics.
A decision flowchart is a simple yet powerful tool that visually maps out choices and outcomes, making decision-making easier. Whether for work, projects, or daily life, a decision-making flowchart helps clarify options and improve efficiency.
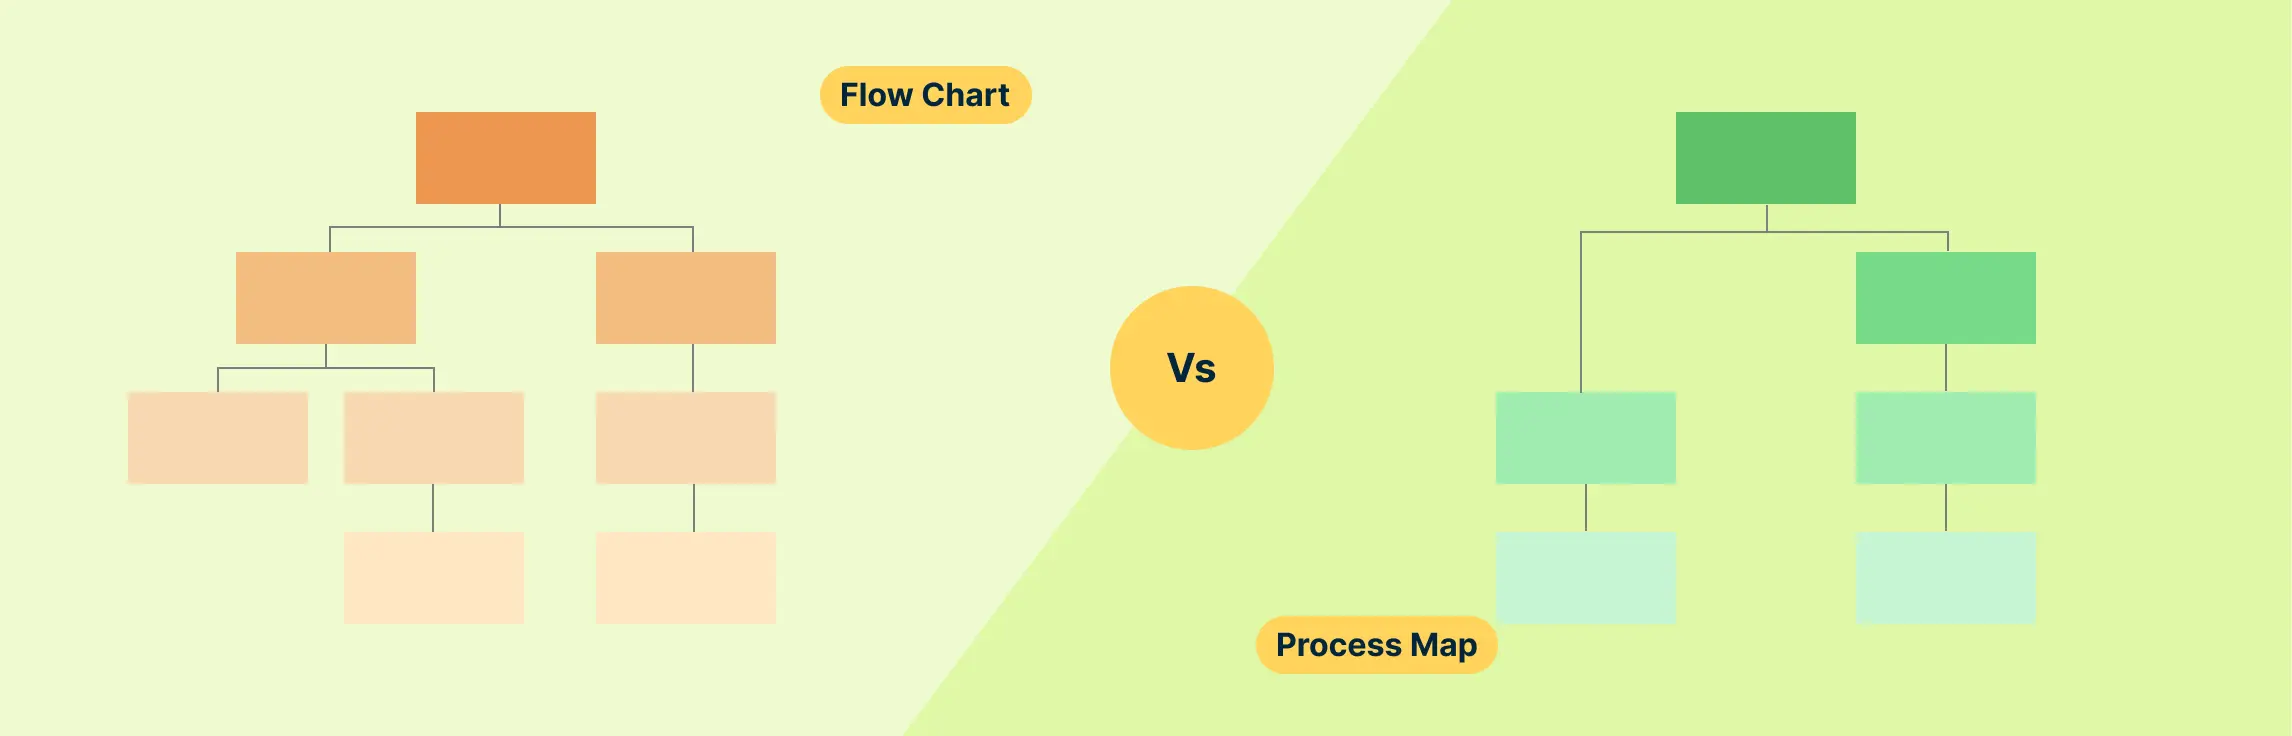
Understanding processes is key to making tasks more efficient and effective, whether you’re managing a project, improving workflows, or solving problems. Two useful tools for visualizing and analyzing processes are flowcharts and process maps. Though they may look similar, each one serves a distinct purpose and works better in different scenarios.
Concept maps aren’t just about connecting words with lines they can be creative, engaging, and even fun! When designed thoughtfully, they encourage deeper thinking and boost comprehension. In this guide, we’ll explore creative concept map examples for teachers and students.
Flowcharts are powerful tools that help visualize processes, systems, and workflows. Whether you’re mapping out a business operation, designing a computer program, or organizing daily tasks, flowcharts make complex ideas easier to understand.
Whether you’re a student organizing your thoughts or a teacher planning lessons, these concept map graphic organizers can make information easier to understand. In this guide, you’ll find a variety of concept map graphic organizer templates designed to simplify learning and teaching.
Management action plans can address various business needs, such as project execution, risk management, performance improvement, and strategic planning. Below are ten examples of management action plan templates that organizations can use to enhance efficiency and productivity. Here are 10 Examples of Management Action Plan with templates.
Employee action plans can be used for professional development, performance improvement, or addressing behavioral concerns. They provide employees with a clear understanding of their objectives while offering managers a structured method to monitor and support progress. Here are 10 examples of employee action plans with editable templates.
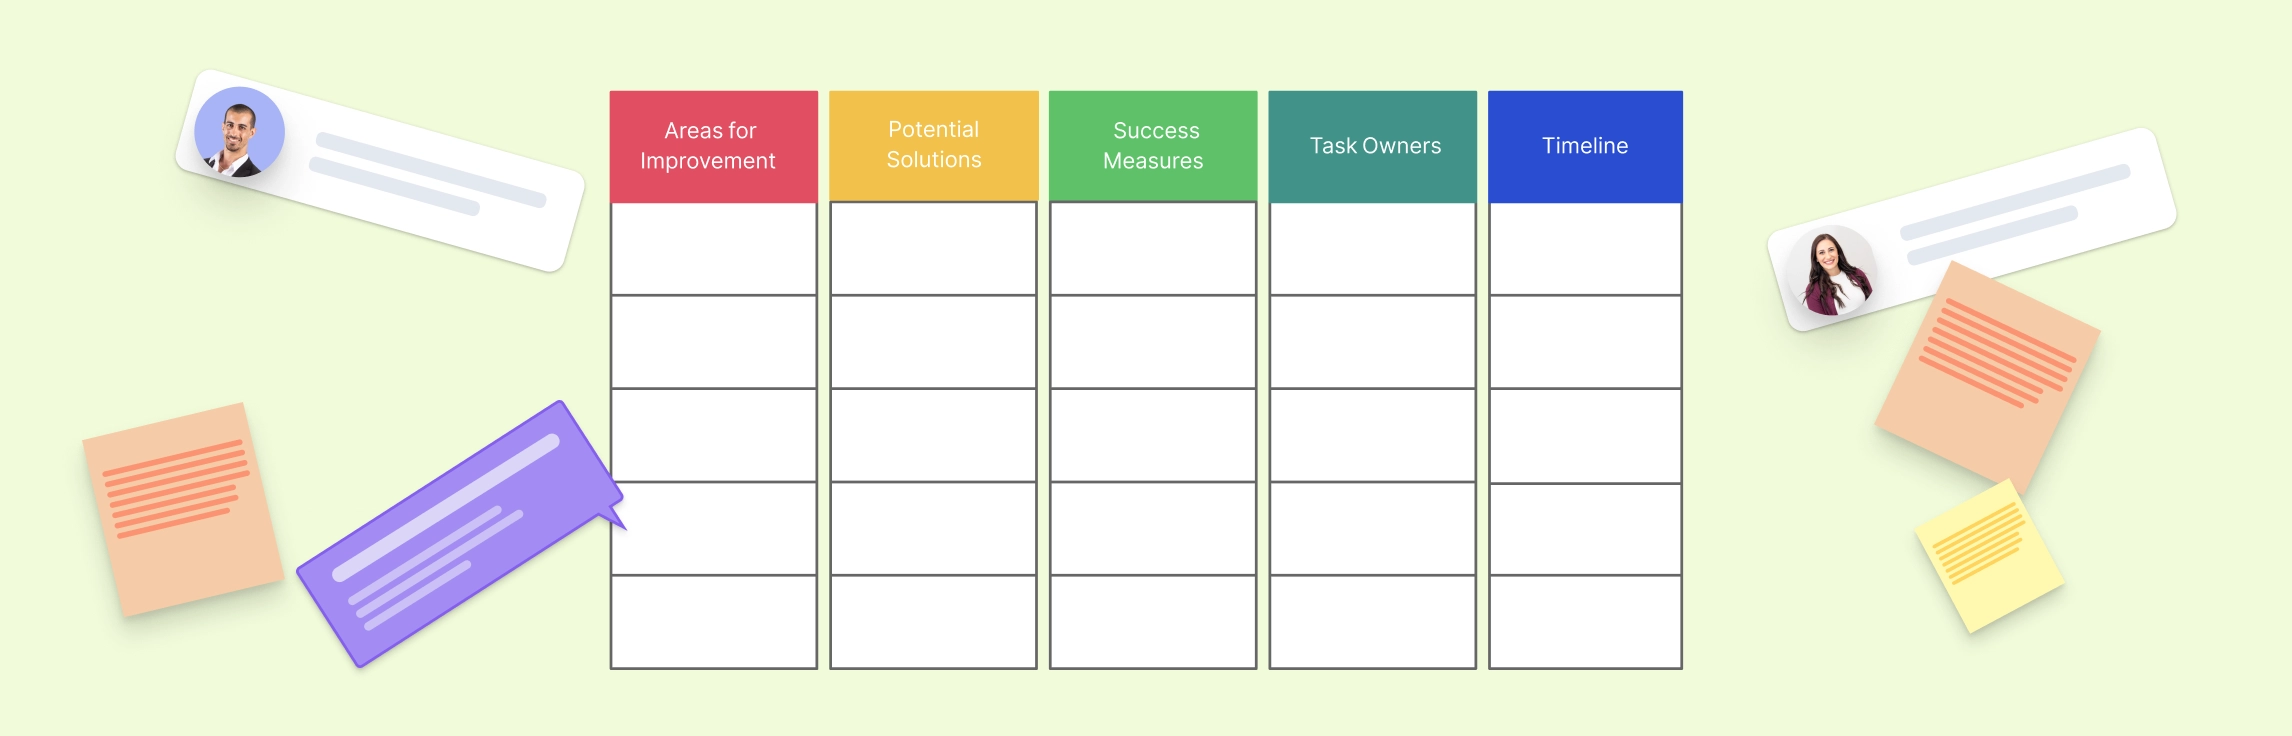
A successful CAP should include clear objectives, measurable expectations, a timeline for improvement, and support mechanisms for the employee. Corrective action plans are essential for maintaining workplace standards, ensuring compliance with company policies, and fostering a culture of continuous improvement. Here is a 10 Examples of Corrective Action Plans for Employees
An Emergency Action Plan (EAP) for schools is a critical safety strategy that outlines procedures for effectively responding to crises and ensuring the well-being of everyone on campus. Schools need clear and actionable emergency protocols that align with local laws and safety regulations. Emergency action plan should be updated regularly and communicated to all stakeholders, including students, teachers, parents, and emergency responders.
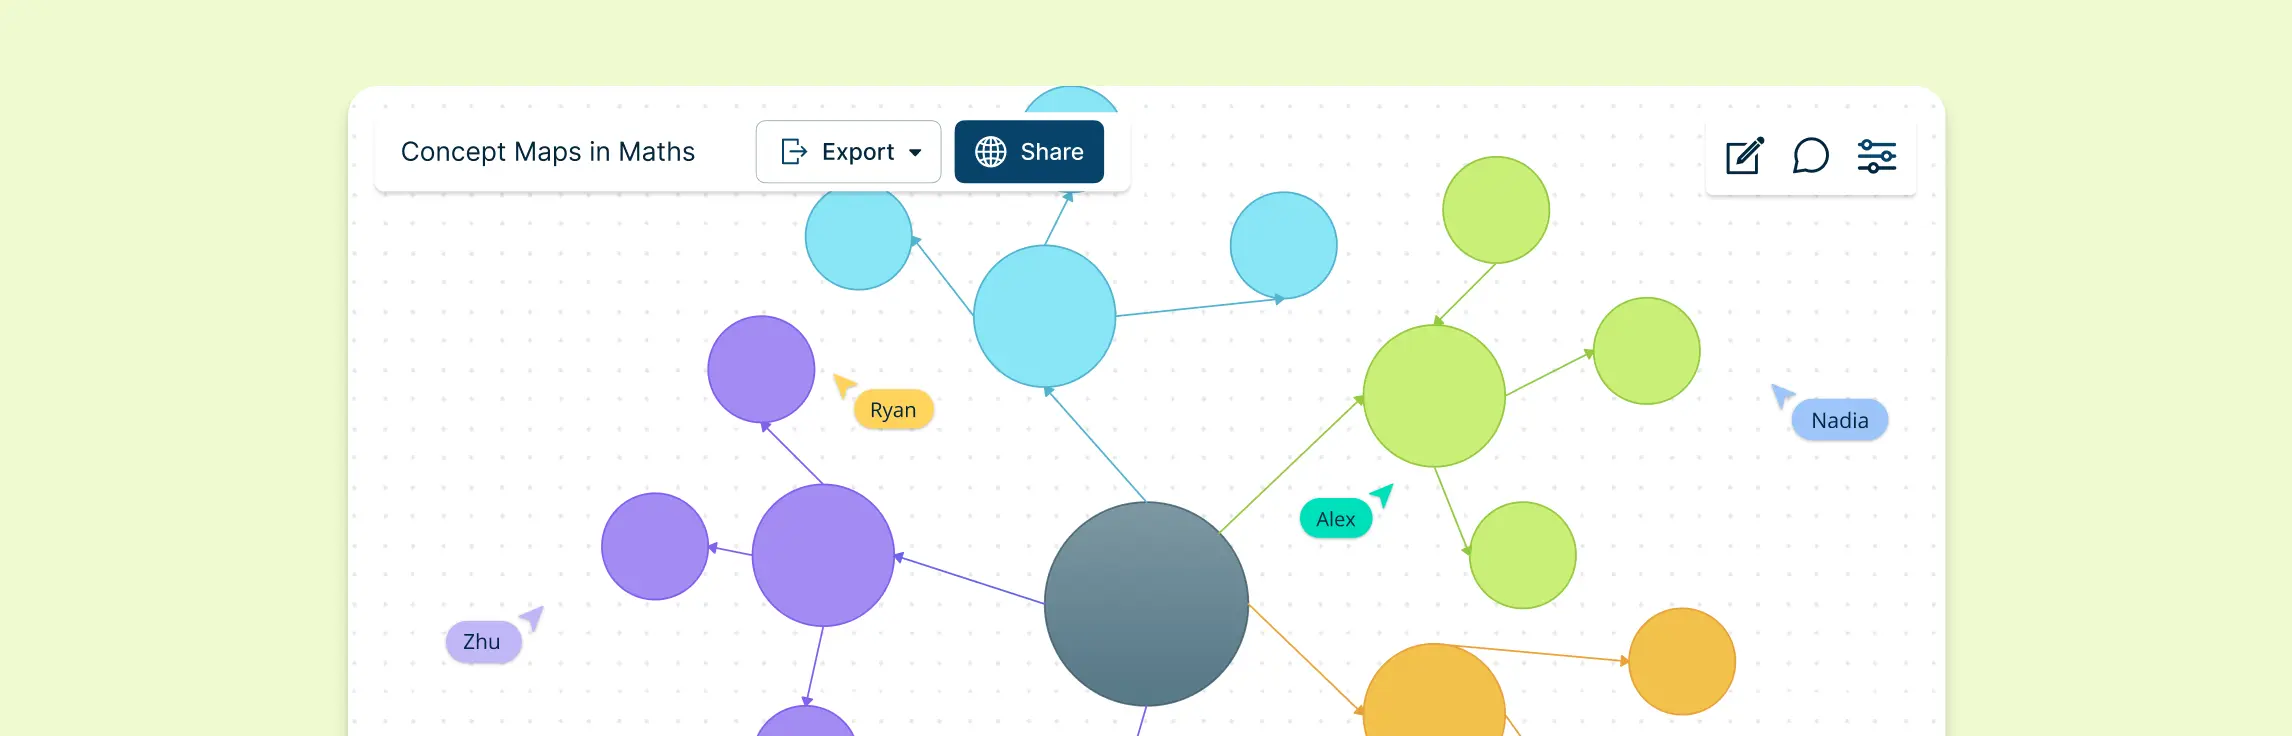
Mathematics can often feel overwhelming due to its abstract concepts, complex formulas, and intricate relationships between ideas. However, one powerful tool can simplify these challenges: concept maps.In this guide, we’ll explore how concept mapping maths can transform the way you learn and teach mathematics, offering step-by-step guidance and real-world examples to help you get started.
Biology is full of fascinating ideas, but sometimes, all the terms and concepts can feel overwhelming. That’s where biology concept maps come in! Instead of just memorizing facts, you’ll be able to understand how things fit together—like how photosynthesis fuels life or how DNA determines our traits.
Microsoft PowerPoint is primarily a presentation software, while it can also be used to create concept maps with some effort. However, PowerPoint has certain limitations that make it less efficient than dedicated diagramming tools.
Listed below are some of the best concept mapping tools available to help you visually represent relationships between ideas and concepts. The table below provides a quick comparison of key features, with detailed individual reviews available for each tool.
Learning new topics can sometimes feel overwhelming, especially when there’s a lot of information to remember. That’s where concept maps comes in. In this guide, we’ll explore concept map examples for students that can make learning simpler and more effective.
Instead of memorizing isolated facts, concept maps in education allow learners to visualize relationships between different topics, making it easier to understand and retain information. In this guide, we’ll explore how to create and use concept maps in education effectively.
In this guide, we’ll explore different concept map ideas you can use in school, work, and daily life. You’ll learn how to create effective concept maps, see real examples, and discover practical ways to apply them. By the end, you’ll have the confidence to use concept map ideas to simplify complex ideas and bring clarity to your thinking.
Definition of a Concept Map Concept map is a visual tool used to represent relationships between different concepts. They help organize and structure knowledge in a way that makes connections and hierarchies clear. They contain,
Using a concept map for research helps researchers organize and represent ideas, concepts, and their relationships within a research project. In this guide, we will explore how concept mapping in research can simplify the process of visualizing your ideas, enhance your critical thinking, and improve your research outcomes.
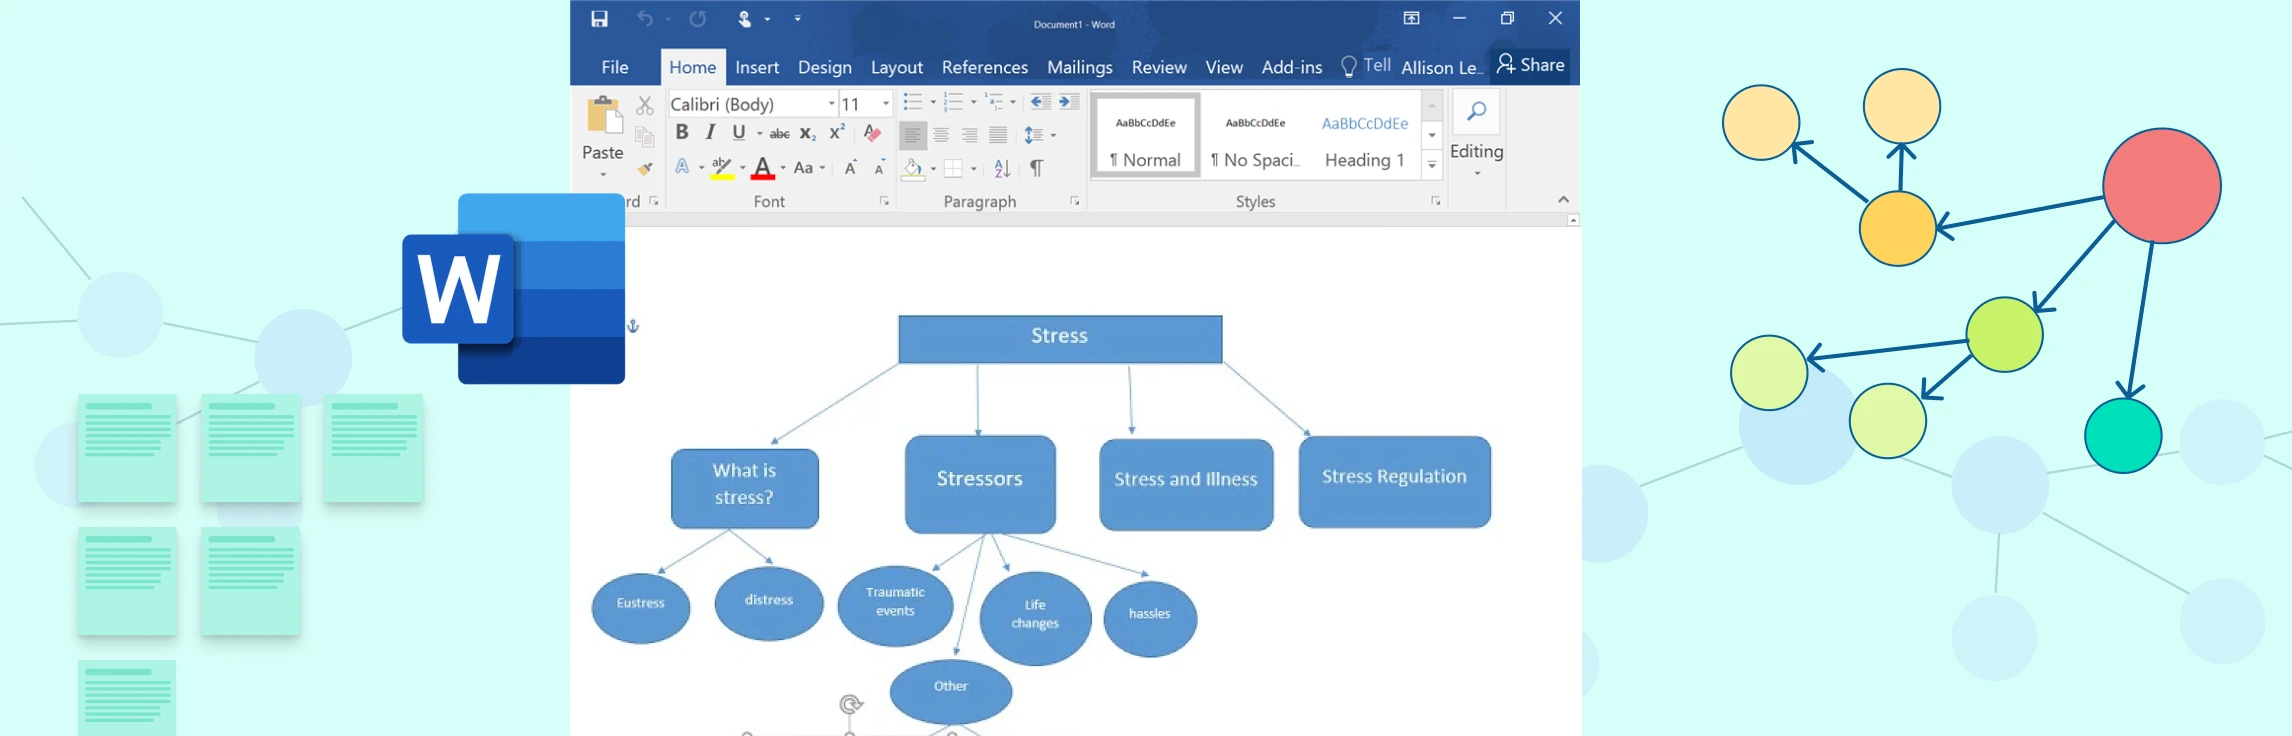
Many people attempt to create concept maps using Microsoft Word, but while Word is a great word processor, it has significant limitations when it comes to visual diagramming.
Concept maps widely used for brainstorming, planning projects, learning complex subjects, and strategizing in business. While many users try to leverage Microsoft Excel for creating concept maps, Excel despite its strengths in data management—has inherent limitations when it comes to visual diagramming.
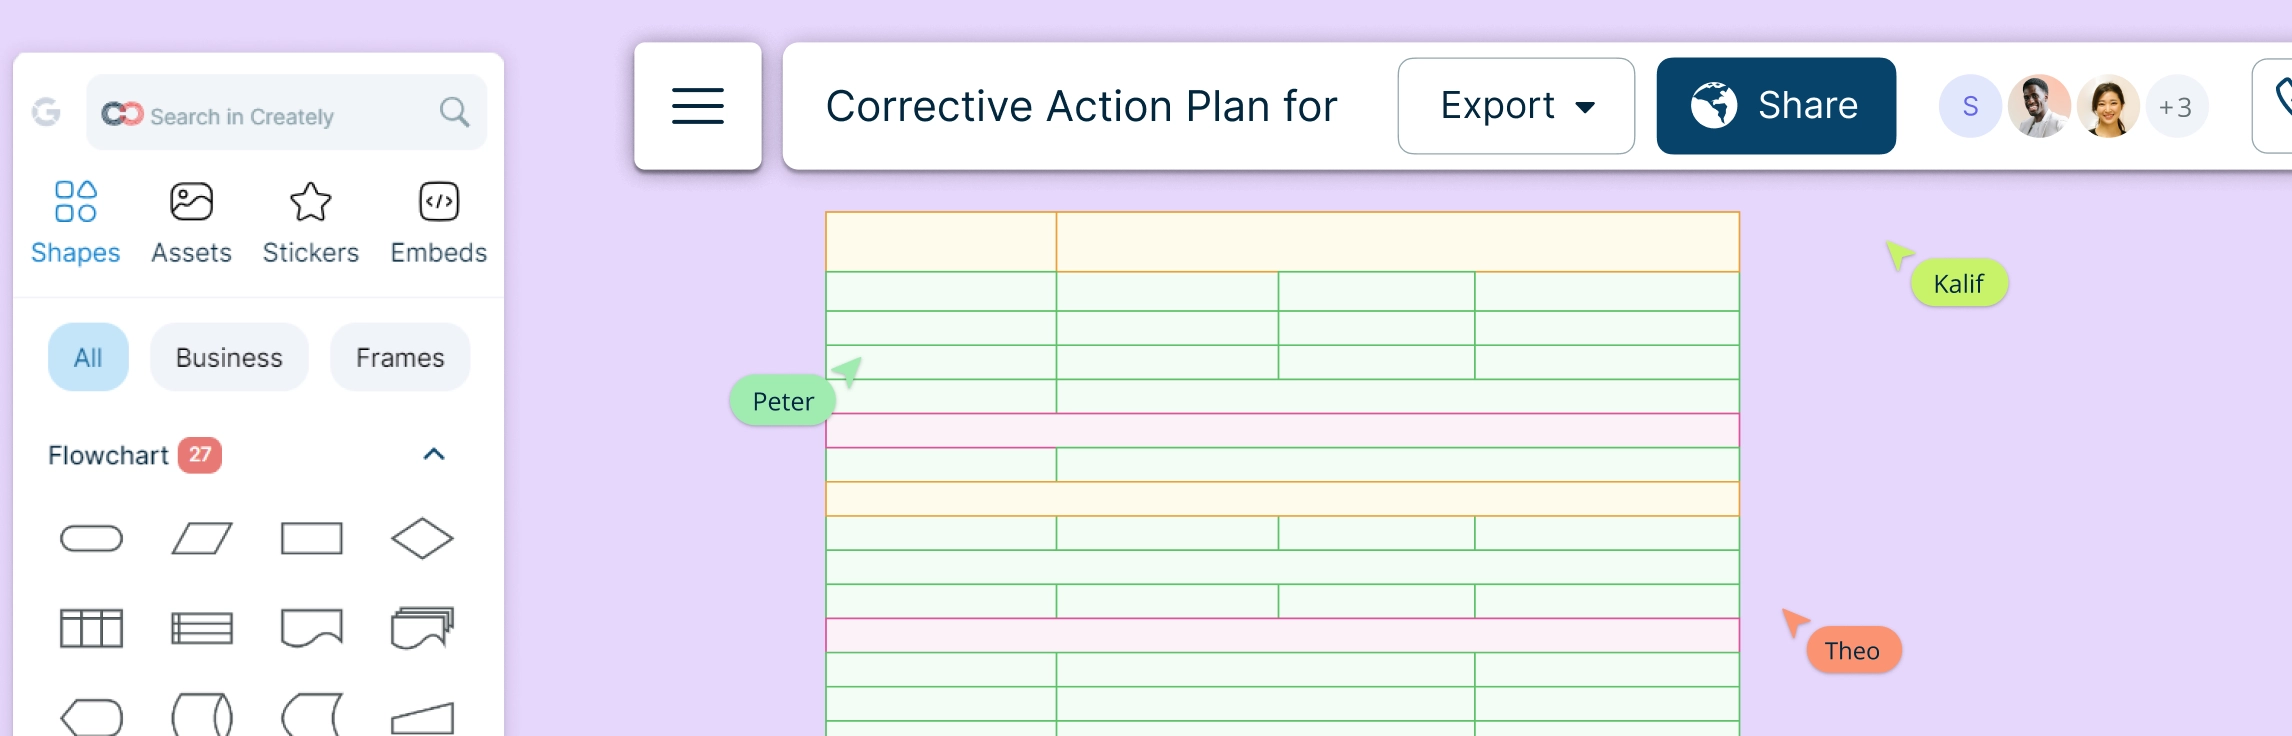
A Corrective Action Plan (CAP) is essential in quality management for addressing issues at their root and driving long-term improvements aligned with organizational goals. Commonly used in industries like manufacturing, healthcare, IT, and food safety, CAPs help meet industry standards, enhance customer satisfaction, and ensure compliance. This guide covers everything you need to know about corrective action plans—from understanding their purpose and key components to step-by-step instructions on how to develop, implement, and monitor them for sustained success.
Imagine a fire breaks out in your office or a severe storm forces an evacuation. Would your team know what to do? That’s where an emergency action plan (EAP) comes in. It’s a step-by-step guide that helps businesses and organizations prepare for unexpected emergencies, ensuring everyone stays safe and knows their role when disaster strikes.
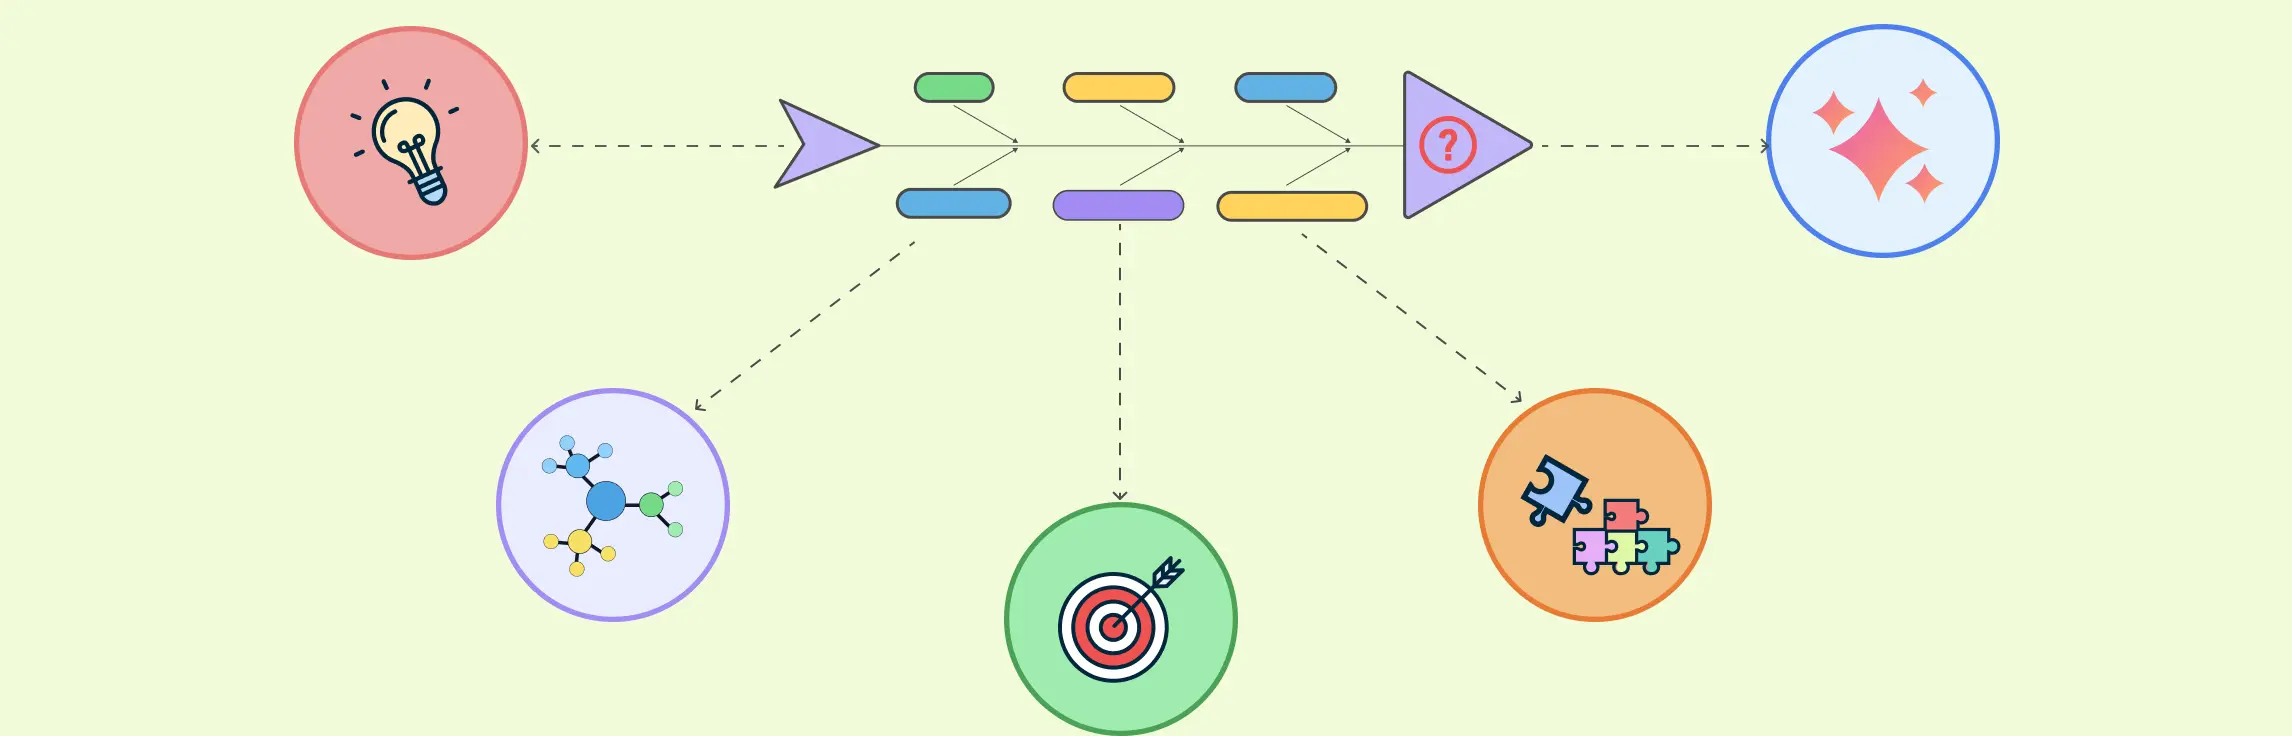
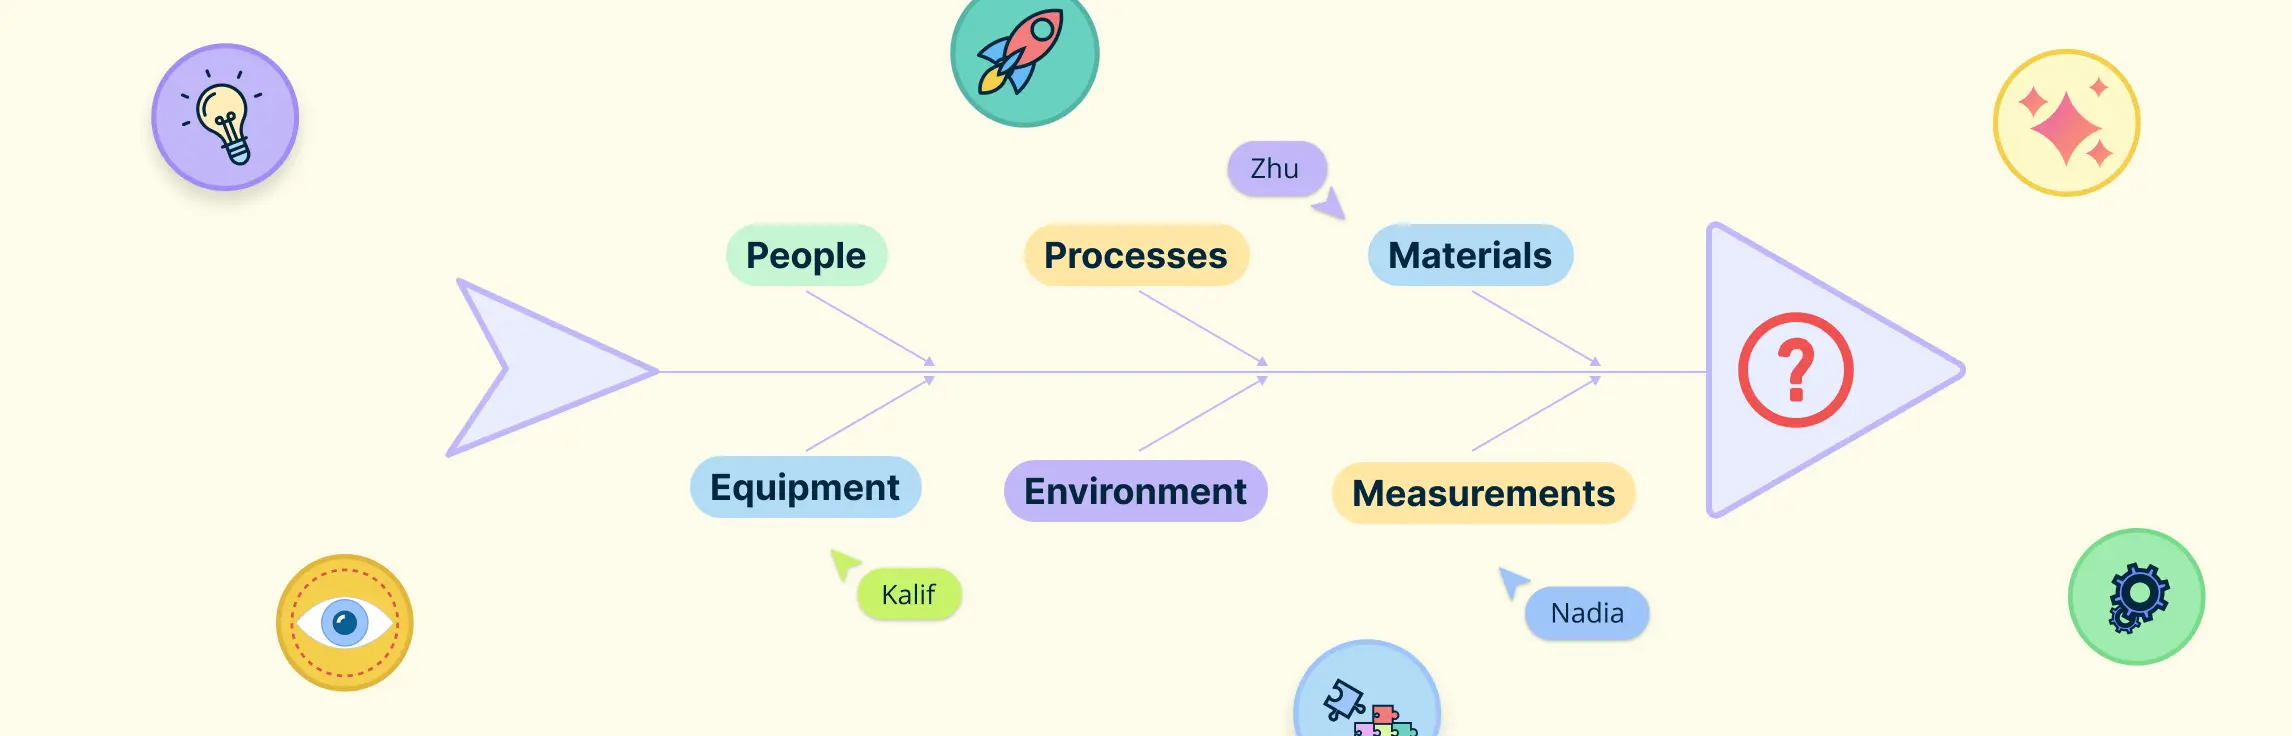
When problems arise, pinpointing the real cause can be challenging. Instead of guessing, teams need a structured way to analyze issues and find effective solutions. That’s where the right tools come in. In this guide, we’ll explore what is a fishbone diagram and how a fishbone diagram helps break down problems, uncover root causes, and improve decision-making. You’ll also find insights on its benefits, uses, and templates to help you get started right away.
A Corrective Action Plan (CAP) is a structured approach to identifying, addressing, and preventing recurring issues in an organization. Whether dealing with compliance violations, operational inefficiencies, or quality concerns, a well-designed CAP helps resolve problems at their root cause while improving processes and accountability. This guide provides a step-by-step approach to how to write a Corrective Action Plan to enhance efficiency, minimize risks, and drive continuous improvement.
Ever feel overwhelmed by all the things you need to get done, with no clear path forward? That’s where an action plan comes in. What is an action plan? It is your roadmap to success. It breaks down your goals into simple, manageable steps so you know exactly what to do and when to do it.
Bridge Maps are versatile visual tools that simplify complex concepts by illustrating relationships through analogies. Widely used in education and workplaces, they enhance understanding, strategic planning, and collaboration. As a unique type of graphic organizer, they reveal patterns, aid cognitive development, and foster effective learning and problem-solving.
In today’s fast-paced digital world, organizations generate vast amounts of knowledge daily. However, without a structured approach to managing this knowledge, valuable insights can be lost, leading to inefficiencies and missed opportunities. Knowledge management is the systematic process of capturing, organizing, sharing, and utilizing information to enhance decision-making, innovation, and overall business performance.
When a problem arises, finding its root cause can feel like searching for a needle in a haystack. That’s where a fishbone diagram (also called an Ishikawa diagram or cause-and-effect diagram) comes in handy. It’s a simple yet powerful tool that helps teams break down problems into different contributing factors, making it easier to pinpoint the real issue.
When making decisions as a group, it’s easy for some voices to get lost or for people to simply agree with the majority. The stepladder technique offers a way to encourage everyone’s input and create more thoughtful, well-rounded decisions. This method helps reduce groupthink by gradually adding people to the discussion one by one, ensuring that each person has a chance to share their unique perspective before hearing others’ thoughts.
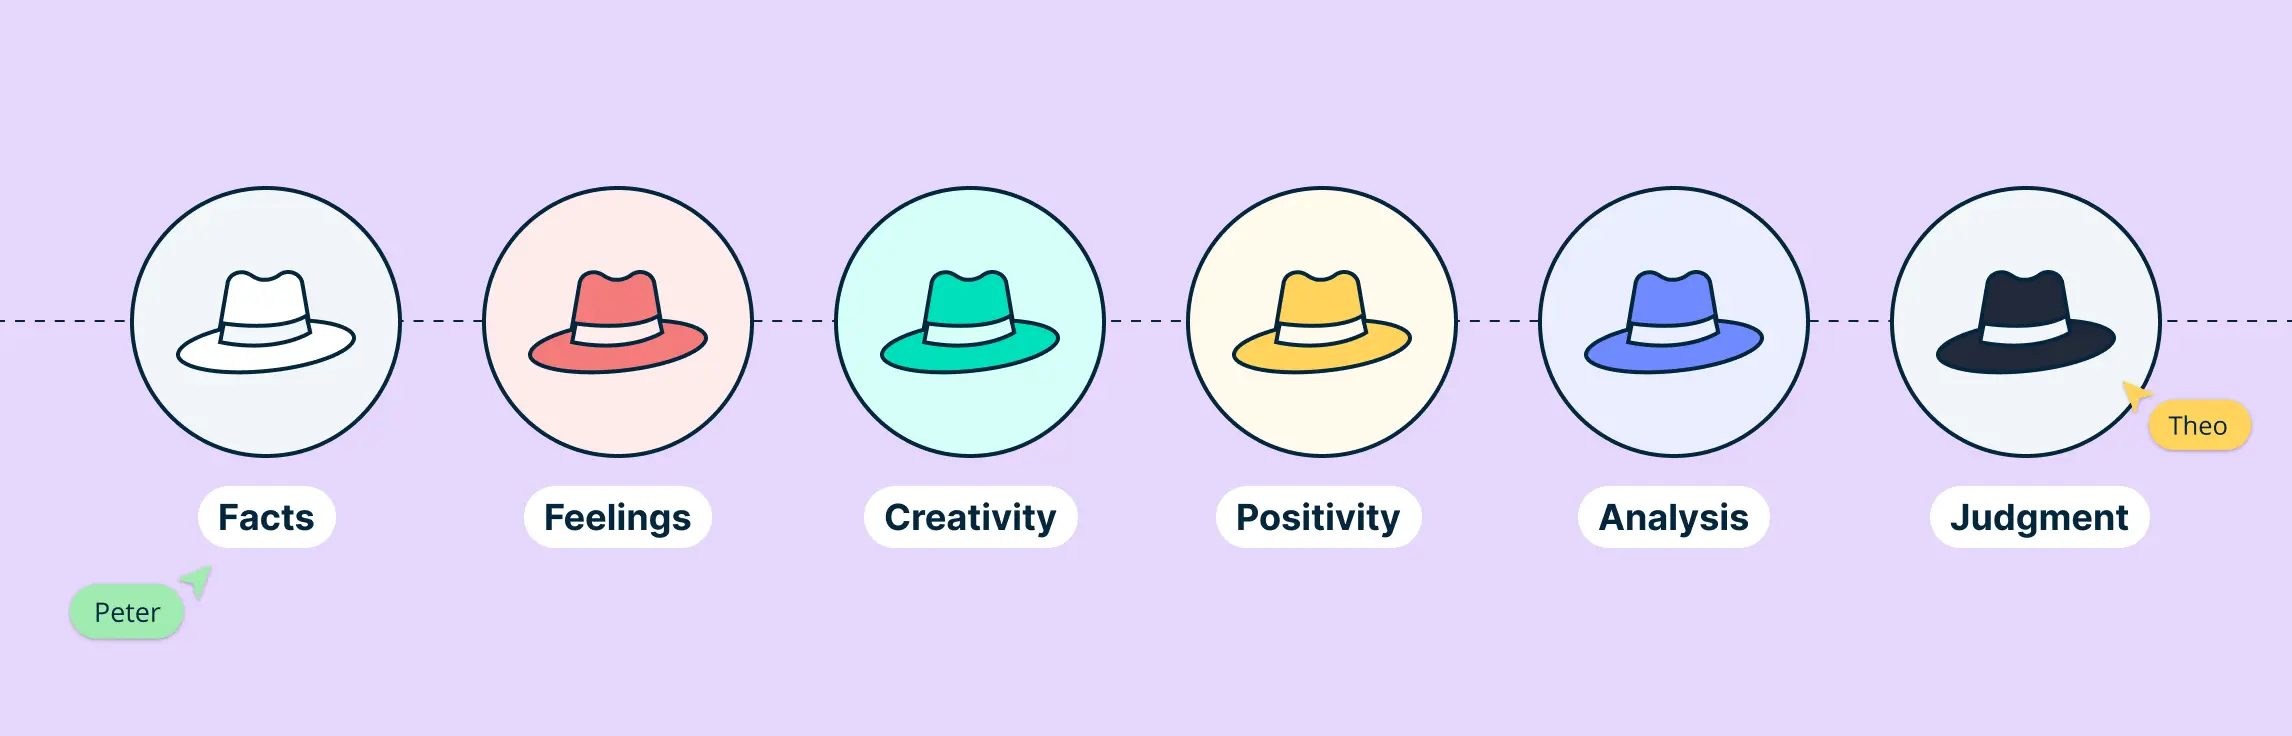
Making decisions—whether in business, education, or everyday life—can be tough. Sometimes, discussions go in circles, people talk over each other, and important ideas get lost. That’s where the Six Thinking Hats method comes in.
The importance of visual communication cannot be overstated. It’s a powerful tool that helps people understand and share ideas more clearly. With so much information to process, using visuals like charts, images, and videos makes complex concepts easier to grasp. Whether you’re working in a team or presenting to others, the importance of visual communication lies in its ability to improve collaboration, decision-making, and problem-solving. In this guide, we’ll explore why visual communication is important and how it can help you work smarter, not harder.
The Knowledge Management process involves capturing, organizing, sharing, and utilizing knowledge within an organization to enhance decision-making, innovation, and efficiency. An effective KM process eliminates silos, reduces redundancies, and fosters collaboration, driving productivity and a culture of continuous learning. A visual collaboration tool like Creately simplifies KM by providing intuitive visual solutions, such as flowcharts and knowledge maps, to capture and share information seamlessly. By making knowledge accessible and actionable, Creately helps organizations transform scattered insights into a cohesive, collaborative resource for improved performance.
Knowing how to use visual communication is essential for making your message clear, engaging, and memorable. Whether it’s a presentation, a report, or a marketing campaign, visuals help simplify complex ideas and make them easier to understand.
In today’s rapidly evolving business landscape, effective knowledge management (KM) is crucial for driving innovation, improving efficiency, and enhancing decision-making. At the core of a successful KM strategy is the understanding that not all knowledge is the same. Knowledge within an organization can take many forms, from structured data and documented processes to personal expertise and intuitive insights. To harness the full potential of knowledge, organizations must recognize and manage different types of knowledge effectively.
Knowledge management (KM) is a systematic approach to capturing, organizing, sharing, and analyzing an organization’s knowledge to enhance its overall efficiency and effectiveness. It involves leveraging organizational knowledge as a strategic asset to improve decision-making, collaboration, and innovation. In this comprehensive guide, we delve into the definition, process, examples, strategies, and best practices associated with knowledge management.
Achieving your dreams requires more than just ambition—it takes clear goals, focused planning, and consistent motivation. Vision boards and goal setting are powerful tools to help you visualize your objectives and stay on track. Whether you’re striving for personal growth, professional success, or team achievements, combining these techniques can unlock your full potential. Read on to discover the transformative power of vision boards and how Creately can make your goal-setting journey seamless and effective.
Often, when we make decisions, we need to compare between two options. Visualizing the similarities and differences of the two options can be a better way to make a decision. A double bubble map is a powerful visual tool designed to compare and contrast two ideas, concepts, or items in a structured and engaging way. This versatile tool enhances comprehension, critical thinking, and collaboration. Unlike traditional charts or lists, double bubble maps offer a dynamic framework to organize similarities and differences clearly. In this guide, we’ll explore what a double bubble map is, how it differs from tools like Venn diagrams, practical applications, and step-by-step instructions for creating one using tools like Creately. Read on to discover how this versatile tool can simplify complex topics, enhance decision-making, and become a go-to resource for visualizing comparisons.
A brace map is a powerful visual tool that helps break down complex concepts into smaller, manageable parts. Whether you’re in education, business, or problem-solving, brace maps allow you to clearly understand relationships by visualizing components in a structured way. In this guide, we’ll dive into what a brace map is, how to create one, and how you can use brace maps to organize your thoughts and ideas. Let’s explore how this tool can enhance your workflow with Creately’s versatile platform.
Visual communication is the use of images, graphics, and other visual elements to share information and ideas. In today’s world, we rely on visuals more than ever to get our messages across quickly and clearly. Whether it’s a logo, a chart, or a social media post, visuals help us communicate in a way that words alone often can’t.
Types of visual communication are all around us—on billboards, in social media posts, and in the videos we watch every day. Visuals are one of the most powerful ways to share ideas, tell stories, and make information easy to understand.
Teamwork thrives on effective communication. Whether in the office, remote, or hybrid, collaborative communication helps teams share ideas, solve problems, and achieve goals together.
Have you ever felt overwhelmed by information? Or struggled to connect the dots between what you know and what you need to do? That’s where knowledge mapping comes in. Think of it as a way to visually organize your ideas, information, and insights into one easy-to-follow map.
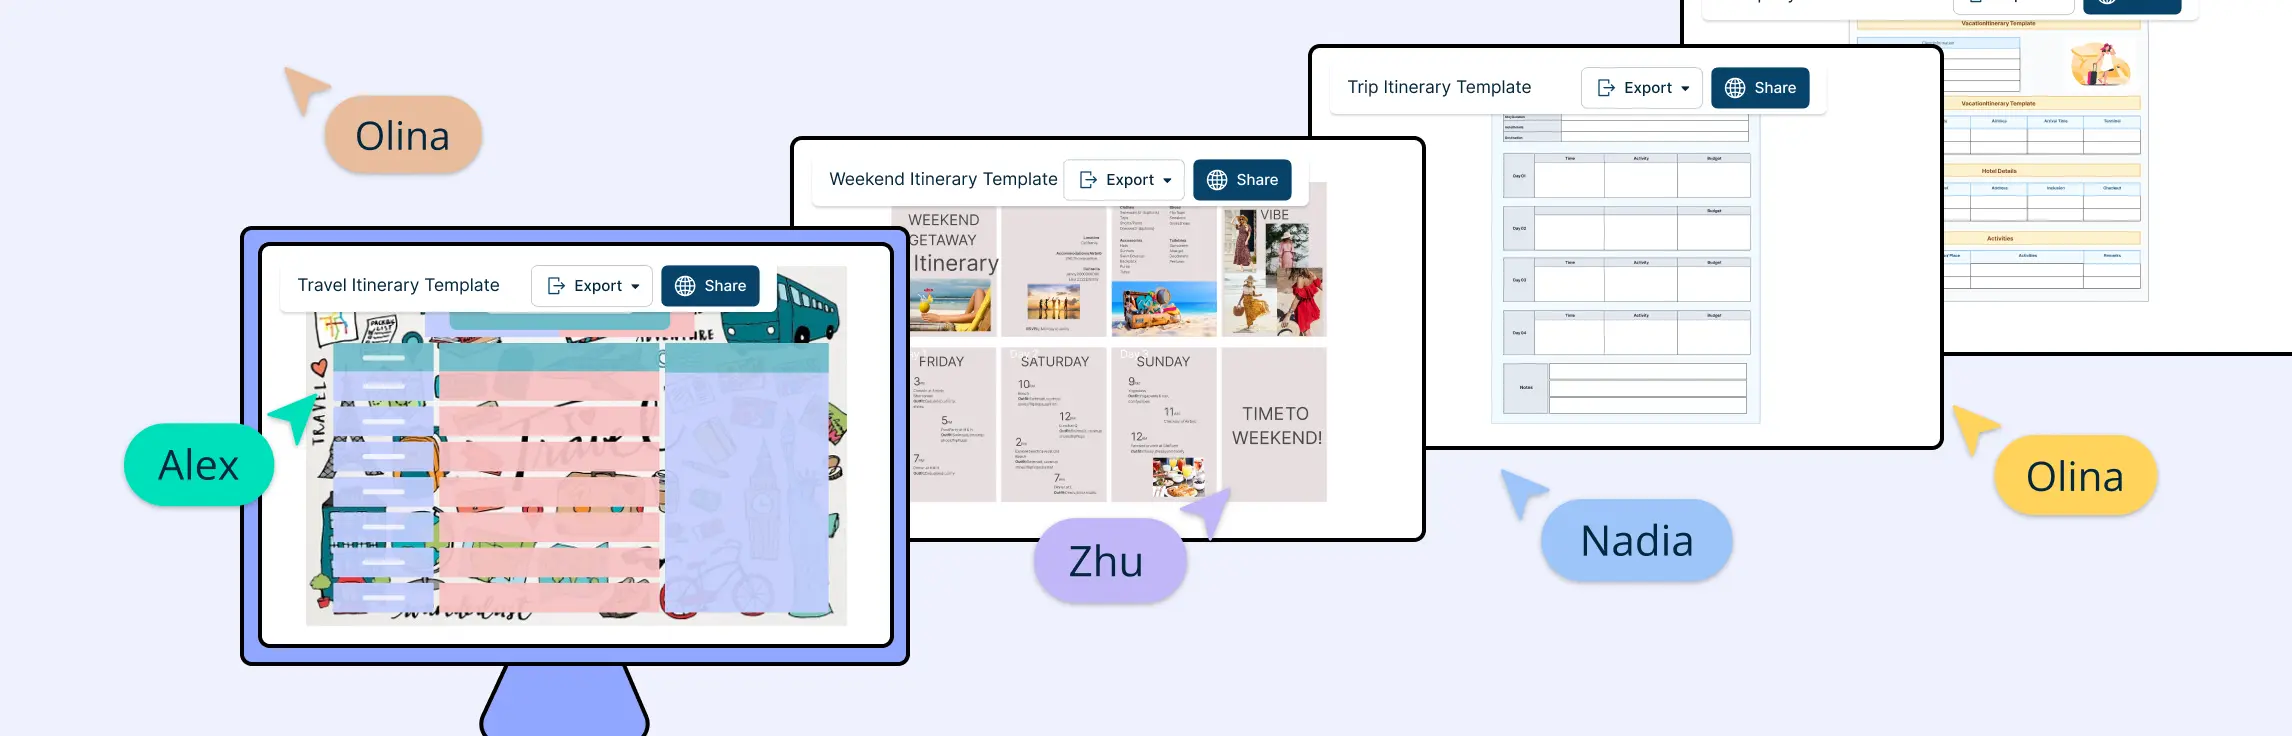
Planning a trip can be exciting, but it can also get overwhelming without a clear schedule. That’s where itinerary templates come to the rescue! These handy tools make organizing your travel plans a breeze, giving you a stress-free way to ensure nothing falls through the cracks.
The stock and flow diagram is a powerful tool used in system dynamics to visualize and analyze complex systems. These diagrams help us understand how different elements within a system interact over time, making them invaluable in various fields, including business, economics, and environmental science. This guide will delve into the intricacies of stock and flow diagrams, their applications, how to create them, and provide templates to assist you in your modeling endeavors.
Studying effectively is a challenge many students face, especially when dealing with large volumes of information. A mind map for studying offers a powerful solution by turning complex concepts into visually organized diagrams. This technique not only enhances understanding but also improves memory retention and encourages creative thinking. Whether you’re preparing for exams, brainstorming essay ideas, or grasping intricate theories, mind mapping can transform your study routine. In this guide, we’ll explore what a mind map for studying is, its benefits, and how to create one step-by-step. Plus, you’ll discover practical templates and tools to integrate mind mapping into your academic journey.
AI in decision-making refers to using advanced technology to help us analyze data, spot patterns, and make informed choices. By leveraging AI, we can improve our decision-making process, making it quicker and more accurate. In this guide, we’ll explore what AI in decision-making means, the benefits it offers, and practical examples of how it’s being used in various fields. By the end, you’ll have a clear understanding of how AI can help simplify the way we make decisions, leading to better results in both business and everyday life.
What is External Communication? External communication involves sharing information with external parties—such as customers, suppliers, and investors—to build relationships, increase visibility, and strengthen the organization’s reputation. It differs from internal communication by targeting audiences outside the company to foster trust and enhance the brand image through various channels like digital media and face-to-face interactions.
Mind mapping is a creative way to take notes that helps you visualize and organize information clearly and effectively. It’s different from traditional note-taking because it makes use of branches and visuals, making it easier to understand and remember what you’ve learned. This guide will show you how to use mind maps for note-taking, and provide practical steps, templates, and useful tips to get started.
A family vision board is a powerful way to bring everyone together to focus on shared goals and dreams. It’s a visual tool that helps your family set intentions for the future, whether it’s planning a big vacation, saving for a home, or improving your health and well-being. By creating a vision board, you can see your goals every day, keeping everyone motivated and on the same page.
What is Systems Mapping Systems mapping is a powerful tool for understanding and visualizing the complex interrelationships within social or environmental systems. It involves creating visual representations of a system’s key actors, connections, feedback loops, and emerging trends, offering a clearer conceptual understanding of the dynamics at play. Whether you’re addressing sustainability issues, community development, or ecosystem management, systems mapping can be an invaluable resource for navigating complexity.
In a world where customer expectations are constantly evolving, businesses must understand the nuances of user interactions. This is where experience mapping comes into play. By visualizing and analyzing each stage of the user journey, organizations can gain valuable insights into customer needs, pain points, and opportunities for improvement. The result? Enhanced customer experiences that drive satisfaction, loyalty, and business growth.
In today’s fast-paced world, understanding the complexity of systems—whether in business, project management, or other—can make all the difference in decision-making. That’s where Causal Loop Diagrams (CLDs) come into play. These diagrams are powerful tools for illustrating how variables within a system interrelate through feedback loops, offering a holistic view of the intricate web of cause-and-effect relationships. This guide will walk you through everything you need to know about CLDs: how to create them, real-world applications, things to consider, and their benefits.
In a world teeming with ideas and information, organizing thoughts can often be a herculean task. Enter the Idea Wheel - a versatile graphic organizer designed to simplify the brainstorming process. By presenting ideas in a visually segmented manner, the Idea Wheel combines the essence of both spider maps and circle maps, fostering creativity and structured thinking.
In an increasingly complex world, traditional approaches to problem-solving often fall short because they focus on addressing symptoms rather than root causes. This is where systems thinking, particularly the Iceberg Model, comes into play. The Iceberg Model offers a structured way to examine problems by revealing deeper, less obvious factors that influence visible events. Drawing inspiration from the visible and submerged parts of an iceberg, the model provides a lens for understanding the intricate dynamics at play beneath the surface.
Mind maps are a simple yet powerful way to organize thoughts and ideas visually. They help you brainstorm, plan, and problem-solve by mapping out information around a central theme. Whether you’re a student, professional, or creative, mind maps make complex topics easier to understand and remember. This guide explores what mind maps are, their history, key features, benefits, and practical uses.
If you’ve already read our previous guide on what a mind map is, you know how useful this tool can be for organizing thoughts and ideas. In this guide, we’ll walk you through the straightforward steps on how to make a mind map. Whether you’re planning a project, brainstorming ideas, or studying for an exam, this guide will help you use mind maps effectively. Let’s get started!
Mind mapping is a powerful tool that helps you organize your thoughts, solve problems, and boost creativity. Whether you’re brainstorming ideas, planning a project, or studying a complex topic, mind mapping makes it easier to break down information and see connections between ideas. In this guide, we’ll explore different mind mapping techniques that can help you think more clearly and work more efficiently. You’ll learn how to structure your thoughts visually, making complex tasks simpler and improving your productivity. By the end, you’ll be able to apply these techniques in various situations, from personal projects to professional work.
Flowcharts are the go-to tool for process mapping. Whether you are working on a new workflow or solving a problem, flowchart symbols make it easy to visualize steps, decision points, and paths. However, to create a flowchart that clearly communicates your process, you need to know the right flowchart symbols and their usage. This guide will walk you through everything you need to know about flowchart symbols, their meanings, best practices, and common mistakes. Understanding flowchart symbols ensures that your diagrams are effective, structured, and universally understood.
Today, challenges are complex and deadlines are tight, having a shared brain to tackle these problems are of paramount importance. When people come together, bringing their unique skills and perspectives to the table, they can achieve far more than they could on their own. Collaboration isn’t just about getting the job done faster—it’s about unlocking innovative solutions, sparking creativity, and building a sense of shared purpose that drives everyone toward success.
In a world where ideas are constantly evolving, finding the right tools to organize and clarify your thoughts is crucial. One such tool that has proven invaluable in both educational and professional settings is the Circle Map. Whether you’re brainstorming, problem-solving, or simply trying to visualize complex data, Circle Maps offer a structured way to capture and expand on your ideas. This blog post delves into the fundamentals of Circle Maps, breaking down their components and offering practical guidance on how to create and use them effectively. Dive in to discover how this simple yet powerful tool can enhance your thinking and communication processes.
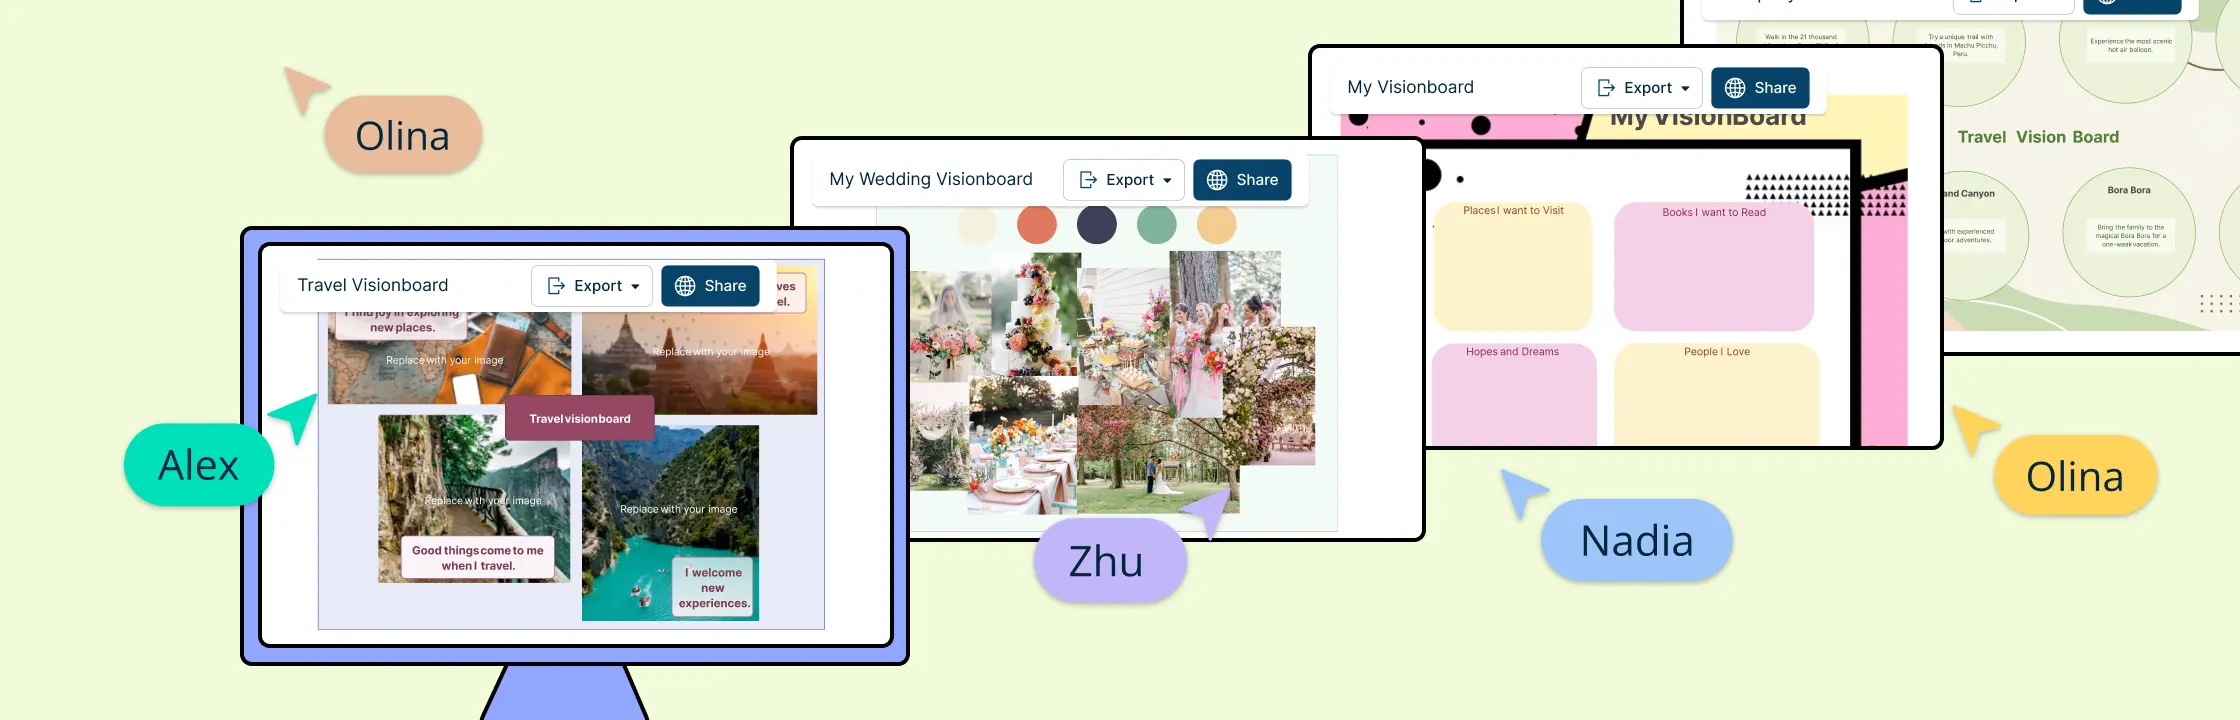
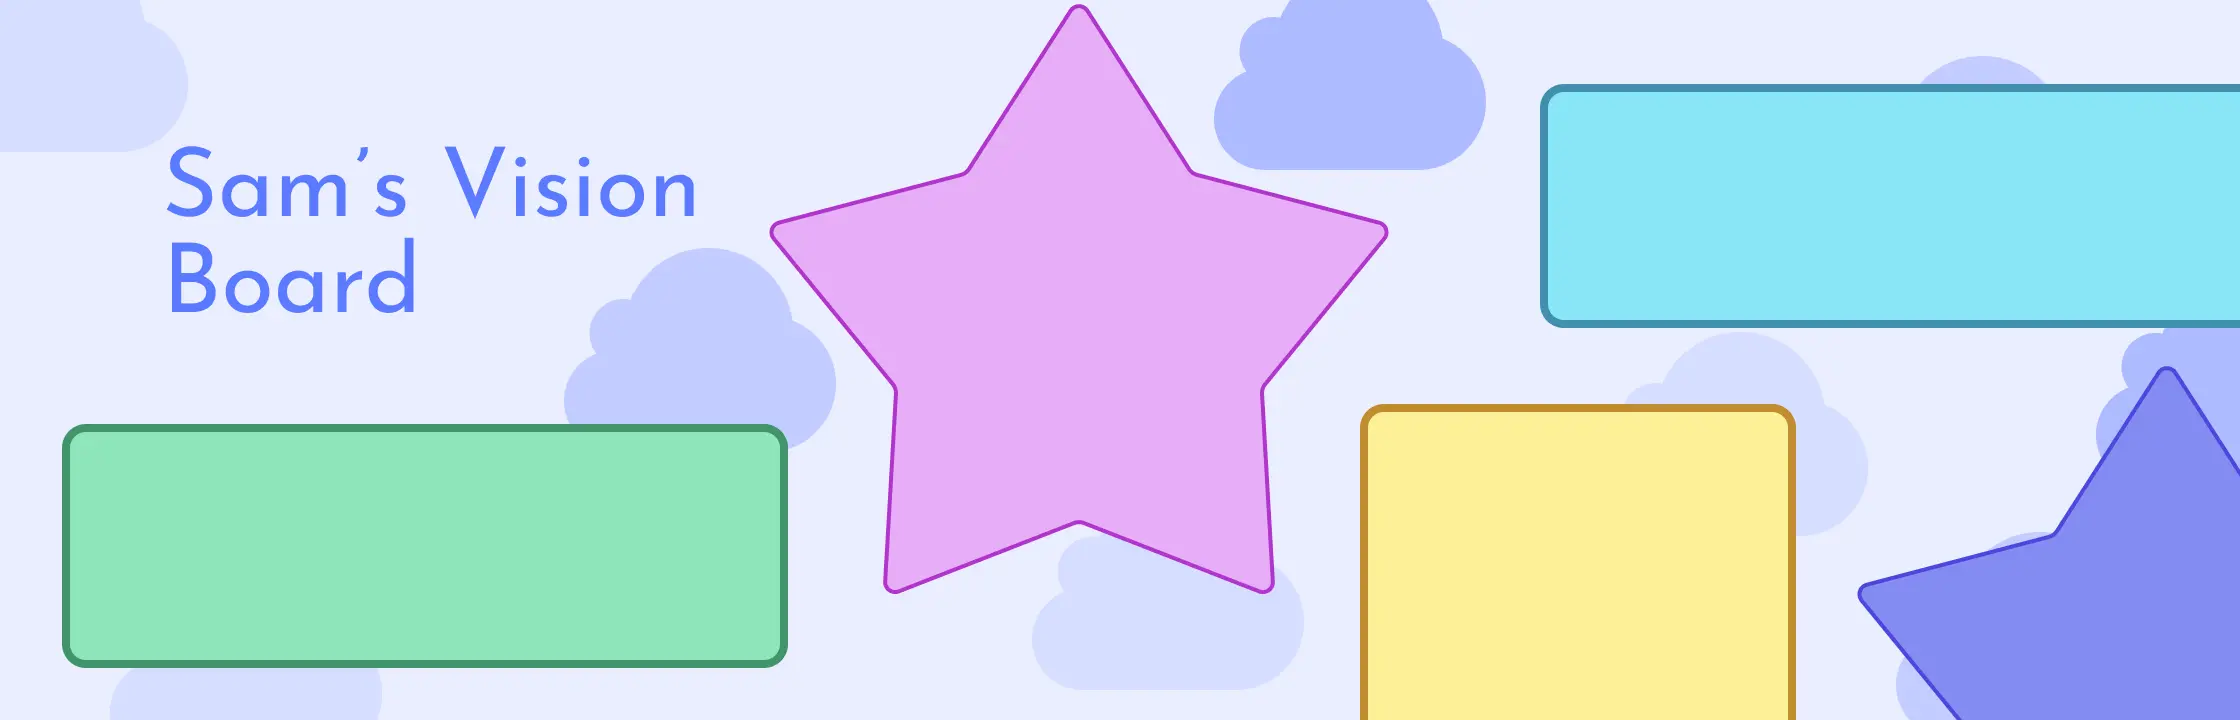
A vision board is a powerful tool for turning your dreams into reality. By gathering images, quotes, and reminders, you keep your goals in sight and stay motivated. In this guide, you’ll find 40 unique vision board ideas to inspire and help you achieve your dreams. From travel and career goals to personal wellness and creative projects, these ideas will help you create a vision board that motivates and guides you on your journey. Let’s explore how to bring your aspirations to life with these simple and effective concepts.
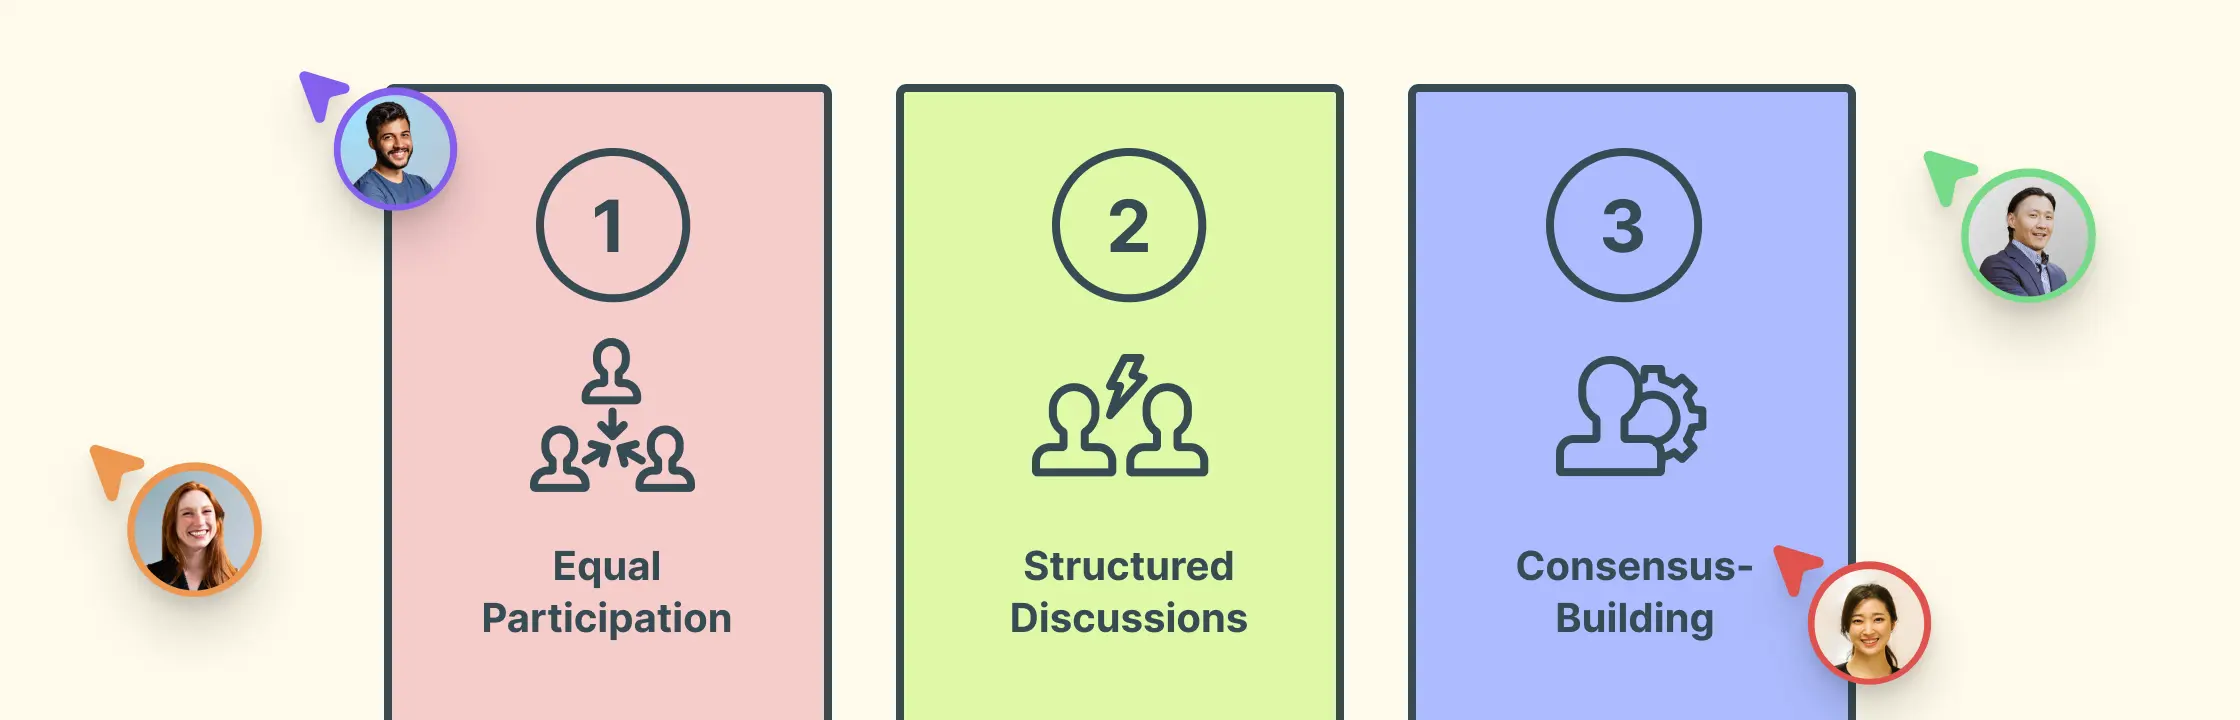
When striving for group consensus, it can be difficult to ensure that every team member’s opinion is considered. Outspoken individuals often dominate discussions, causing quieter members to be overlooked and their insights to go unshared. This can result in missed opportunities to gather valuable contributions from the entire team. The Nominal Group Technique (NGT) is a powerful problem-solving and decision-making tool designed to ensure equal participation among group members. This technique is especially valuable in settings where complex issues require diverse input and collaborative solutions, enhancing the overall decision-making process.
A vision board is a powerful tool that helps you visualize your goals and dreams by creating a visual representation of them. When it comes to finances, a money vision board can be an effective way to focus your efforts and keep your financial goals in sight. In this guide, we’ll walk you through the steps to create a money vision board that will help you achieve your financial aspirations.
What is a Vision Board? A vision is a collage of images, words, and other visual representations that embody your goals and ambitions. The purpose of a vision board is to help clarify, concentrate, and maintain focus on specific life goals. By placing visual reminders of your aspirations in a dedicated space, you can continually inspire and motivate yourself to strive towards achieving those goals.
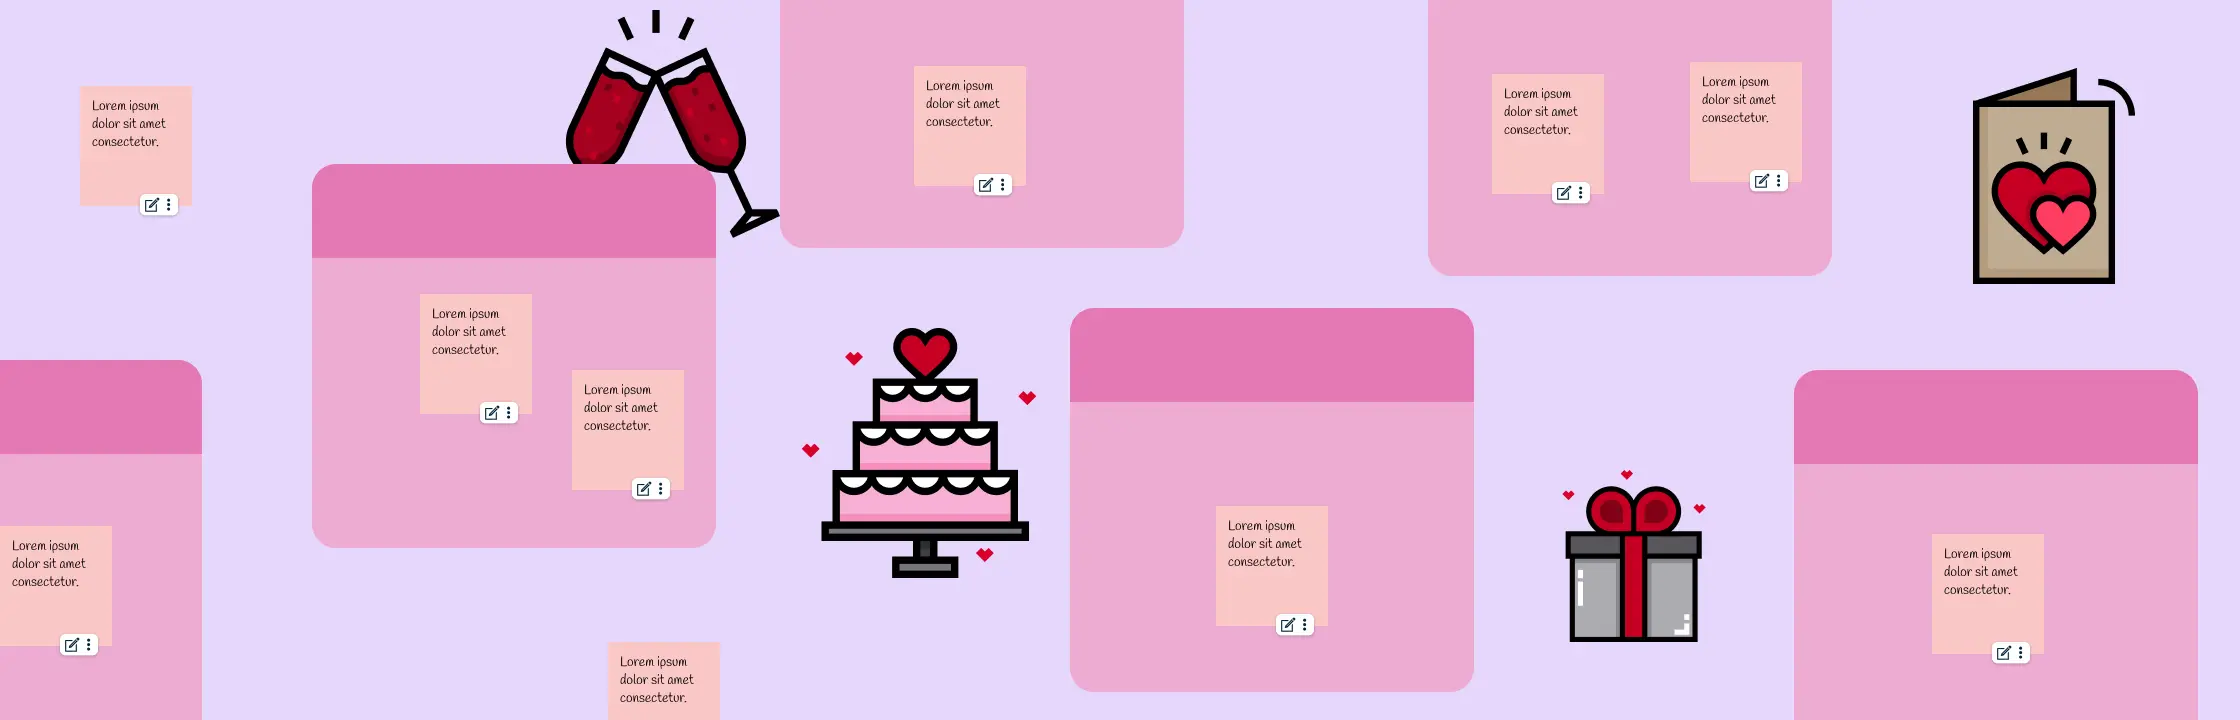
Planning a wedding can feel overwhelming, but creating a wedding vision board can help turn your dream day into reality. A wedding vision board is a visual tool that helps you clarify and communicate your wedding style, preferences, and ideas. It serves as a roadmap that guides you through the planning process, making decisions easier and keeping you focused on your goals. In this post, we’ll walk you through everything you need to know to create your own wedding vision board along with wedding vision board templates to get started.
In a world where distractions abound and goals can sometimes feel out of reach, empowering our children with tools to visualize and achieve their dreams is more important than ever. One such tool that holds immense power is the humble vision board. In this post, we’ll delve into the wonders of the vision board for kids and how it can transform the way our little ones perceive and pursue their aspirations.
In the fast-changing world of business, it’s crucial to turn your big dreams into practical plans. But with so much going on, it’s easy to lose sight of the bigger picture. That’s where the business vision board comes in. It’s a simple tool that helps you stay focused on your long-term goals and keeps everyone on the same page. This guide is here to help entrepreneurs and business leaders make the most of their vision boards, offering straightforward tips and advice along with business vision board templates to turn dreams into reality.
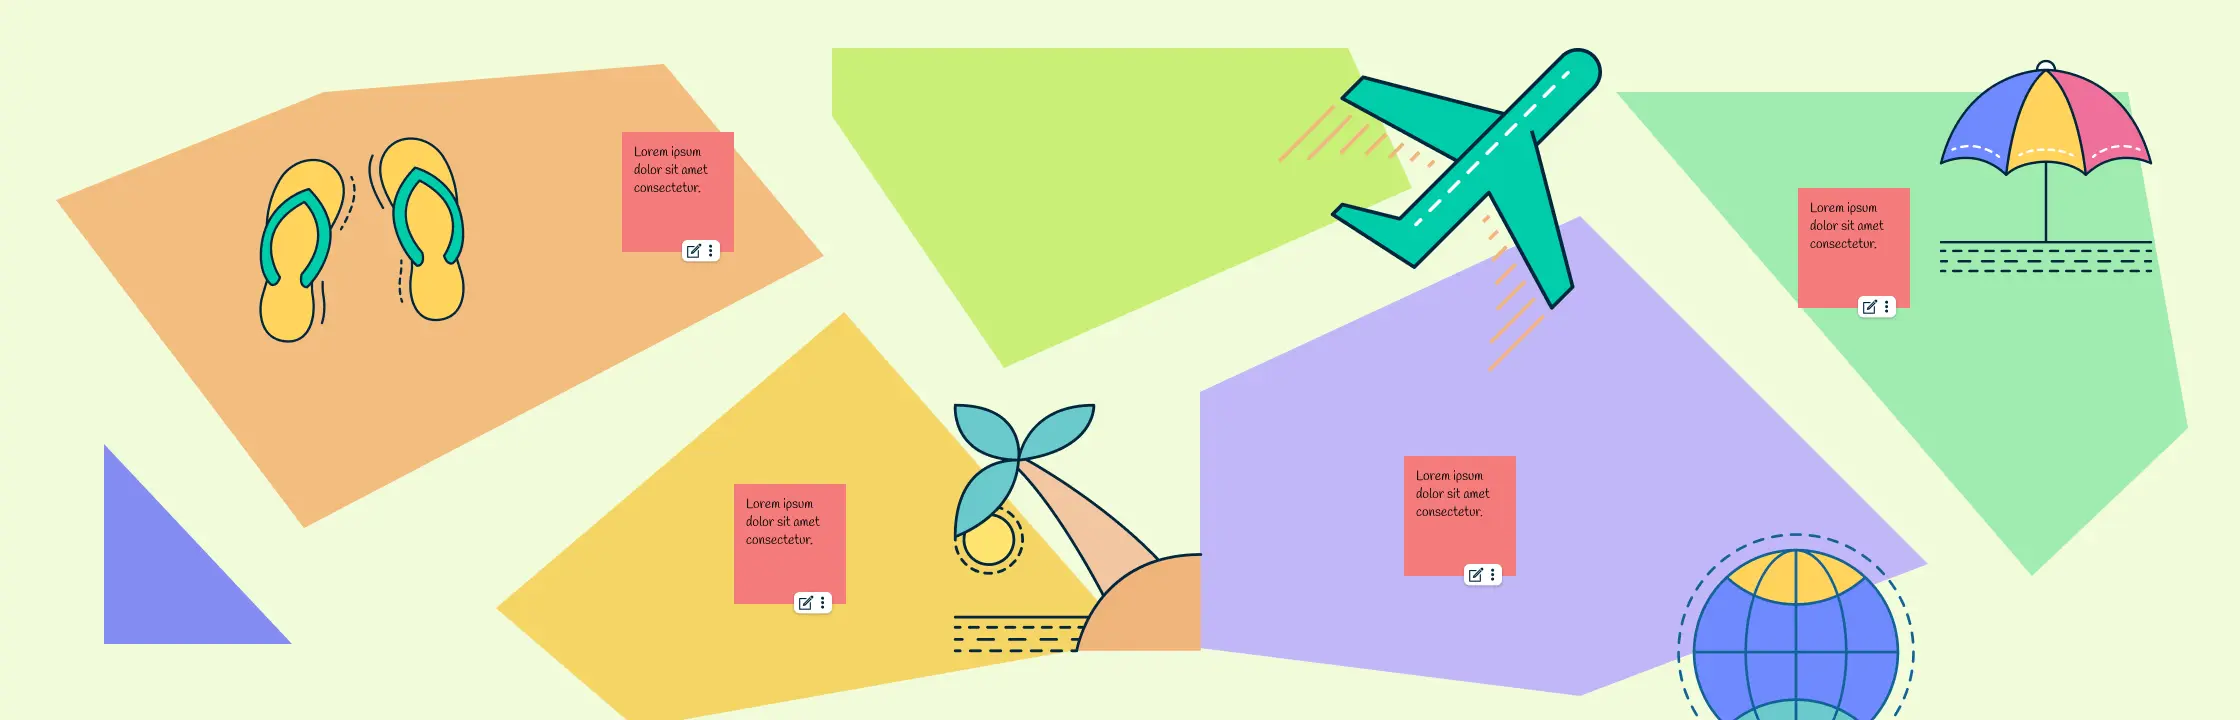
Do you ever find yourself daydreaming about exploring the bustling streets of Tokyo, lounging on the pristine beaches of Bali, or hiking through the majestic mountains of Patagonia? If so, a travel vision board might be just what you need to turn those dreams into reality. A travel vision board is a powerful tool that helps you visualize your travel goals, stay motivated, and ultimately manifest your dream destinations. In this blog post, we’ll guide you through the process of creating your own travel vision board and share tips on how to make it work for you.
A vision board is more than just a collage of pretty pictures; it’s a transformative tool that can help you visualize your dreams, manifest your desires, and ultimately create the life you’ve always wanted. In this comprehensive blog post, we’ll take you step-by-step through the process of creating a vision board, from understanding what it is and how it works to practical tips for maximizing its effectiveness. Whether you’re a seasoned manifestor or a skeptic dipping your toes into the world of visualization, this guide will empower you to unlock your full potential and turn your dreams into reality.
Planning your dream wedding involves bringing together countless ideas, inspirations, and visions into one cohesive and beautiful event. Amidst the whirlwind of decisions, there’s one tool that can help you streamline your thoughts and visualize your perfect day: the wedding mood board. In this guide, we will walk you through the steps to create the perfect mood board for your wedding to inspire your big day.
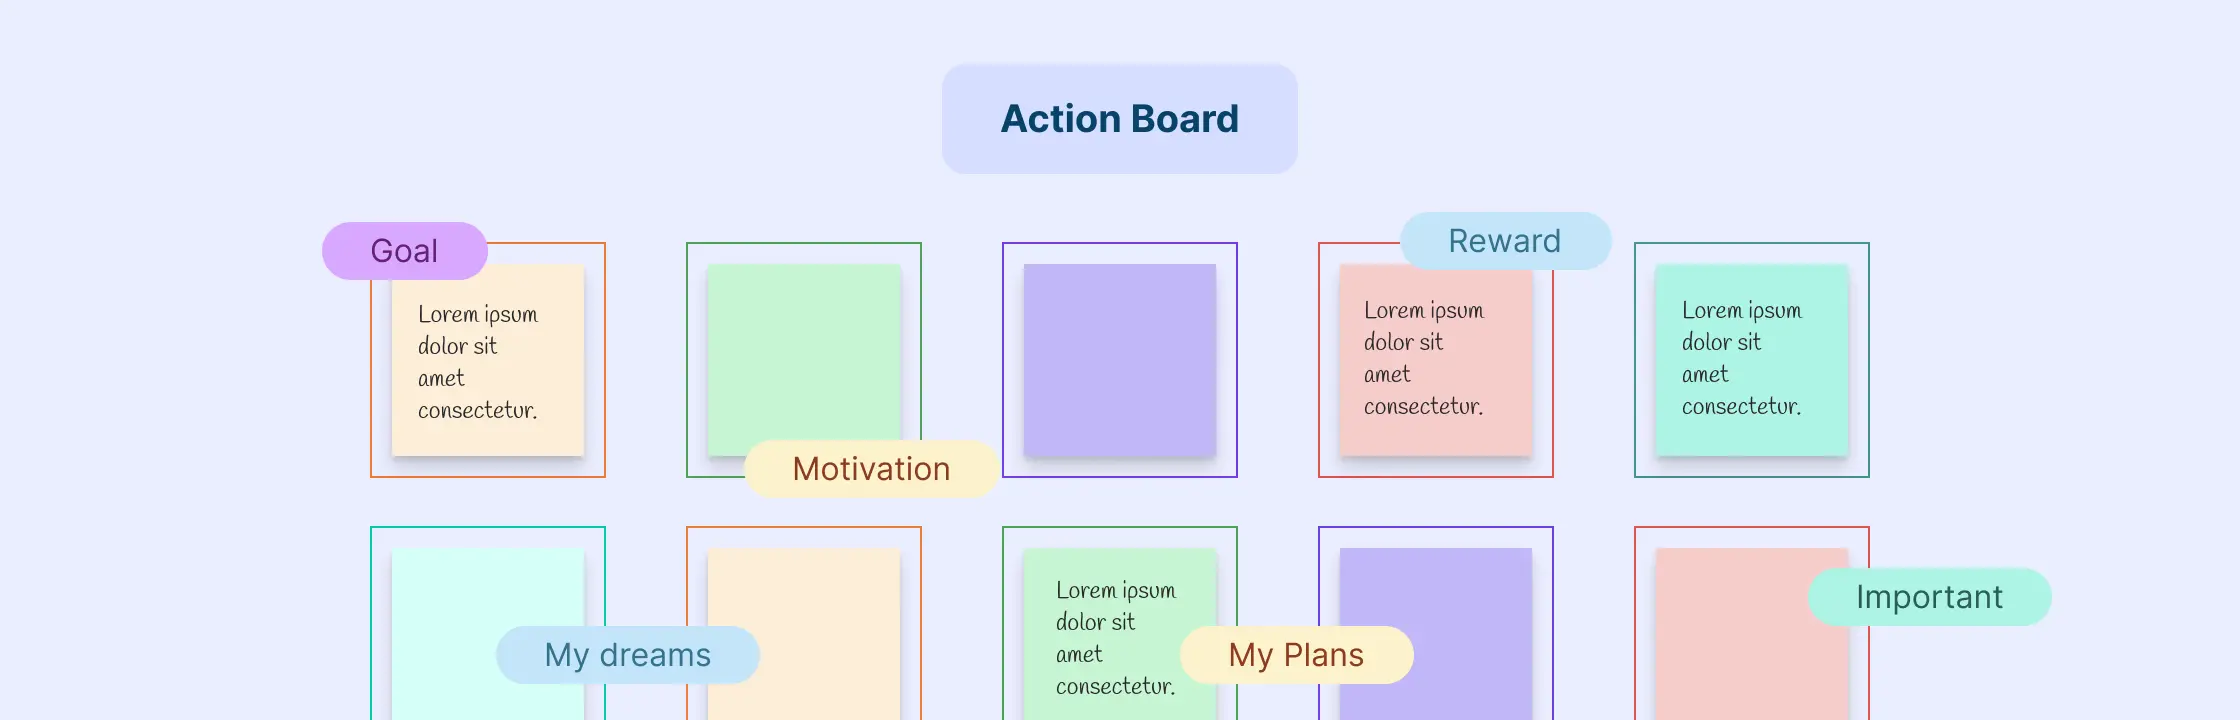
Creating an action board can be a transformative experience. It’s a powerful tool that helps you visualize your goals, stay motivated, and track your progress. Whether you’re looking to advance your career, improve your health, or achieve personal milestones, an action board can guide you toward success. In this blog post, we’ll walk you through the steps to creating an effective action board.
In the quest to organize our thoughts and improve understanding, visual thinking tools like concept maps and mind maps have become invaluable. These tools help us to structure information visually, making complex ideas easier to grasp and retain. In this blog post, we’ll explore the differences between concept map vs mind map, and discuss their unique uses to help you decide which tool is right for your needs.
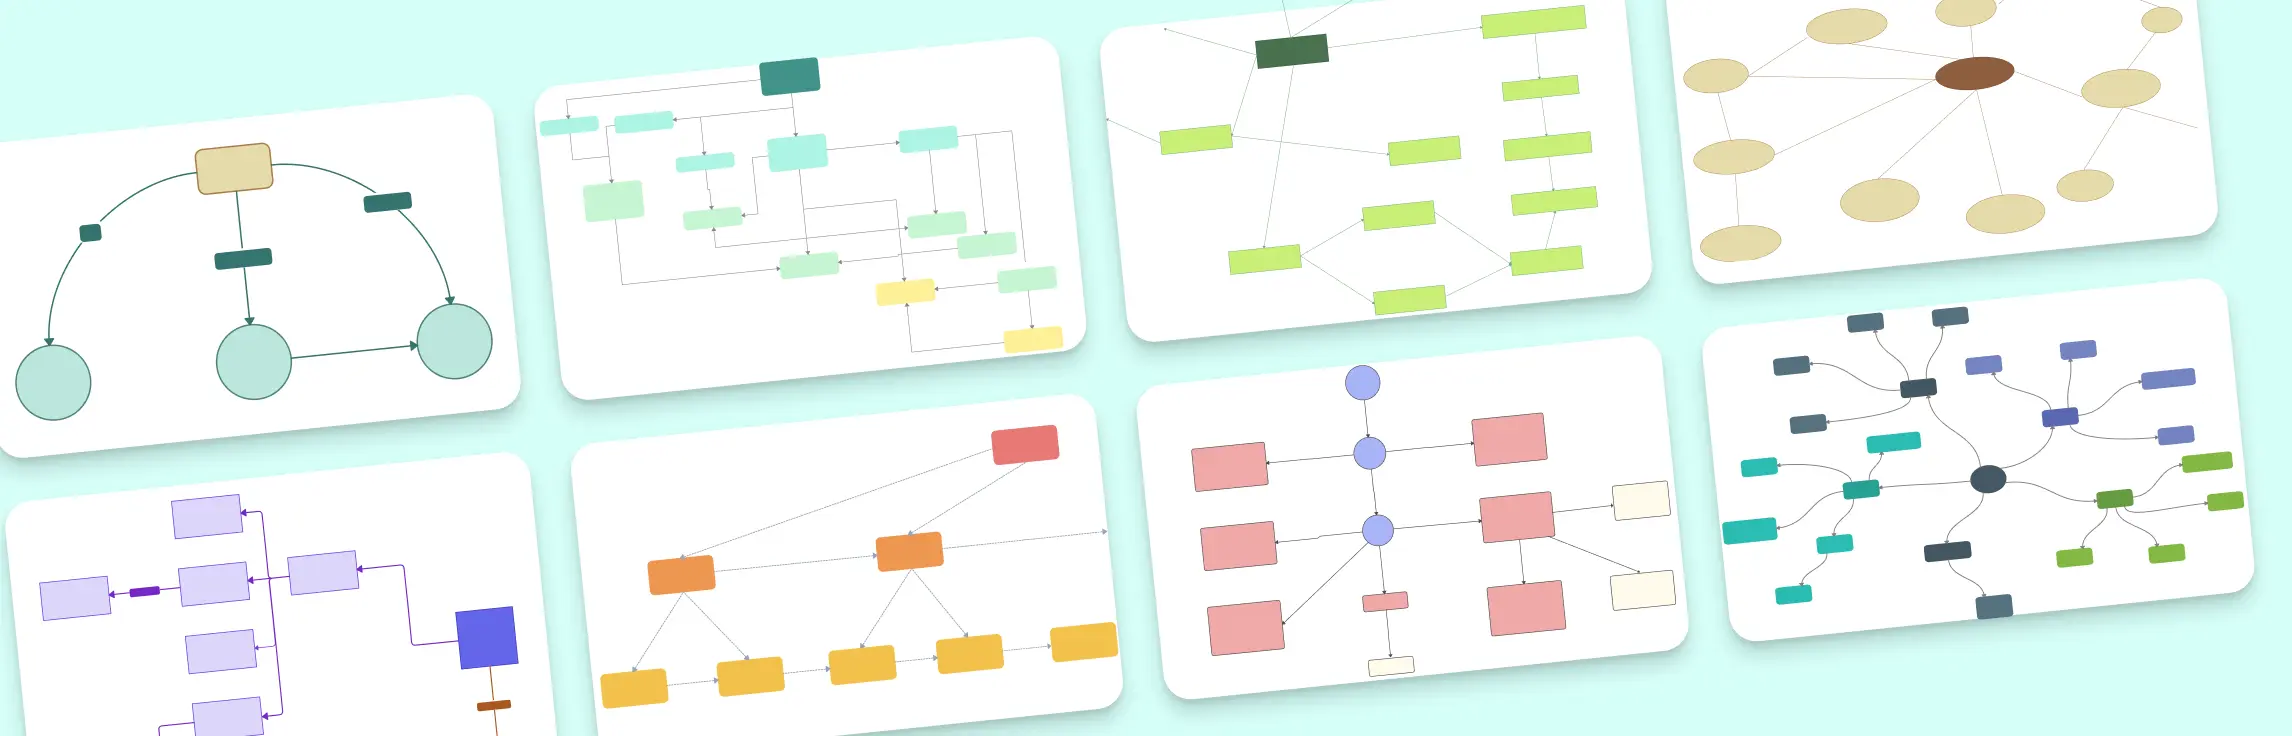
The four main types—Spider Maps, Flowcharts, Hierarchy Maps, and System Maps—serve different purposes, from brainstorming to process mapping. This guide explores their structures, uses, and examples to help you choose the right one for your needs.
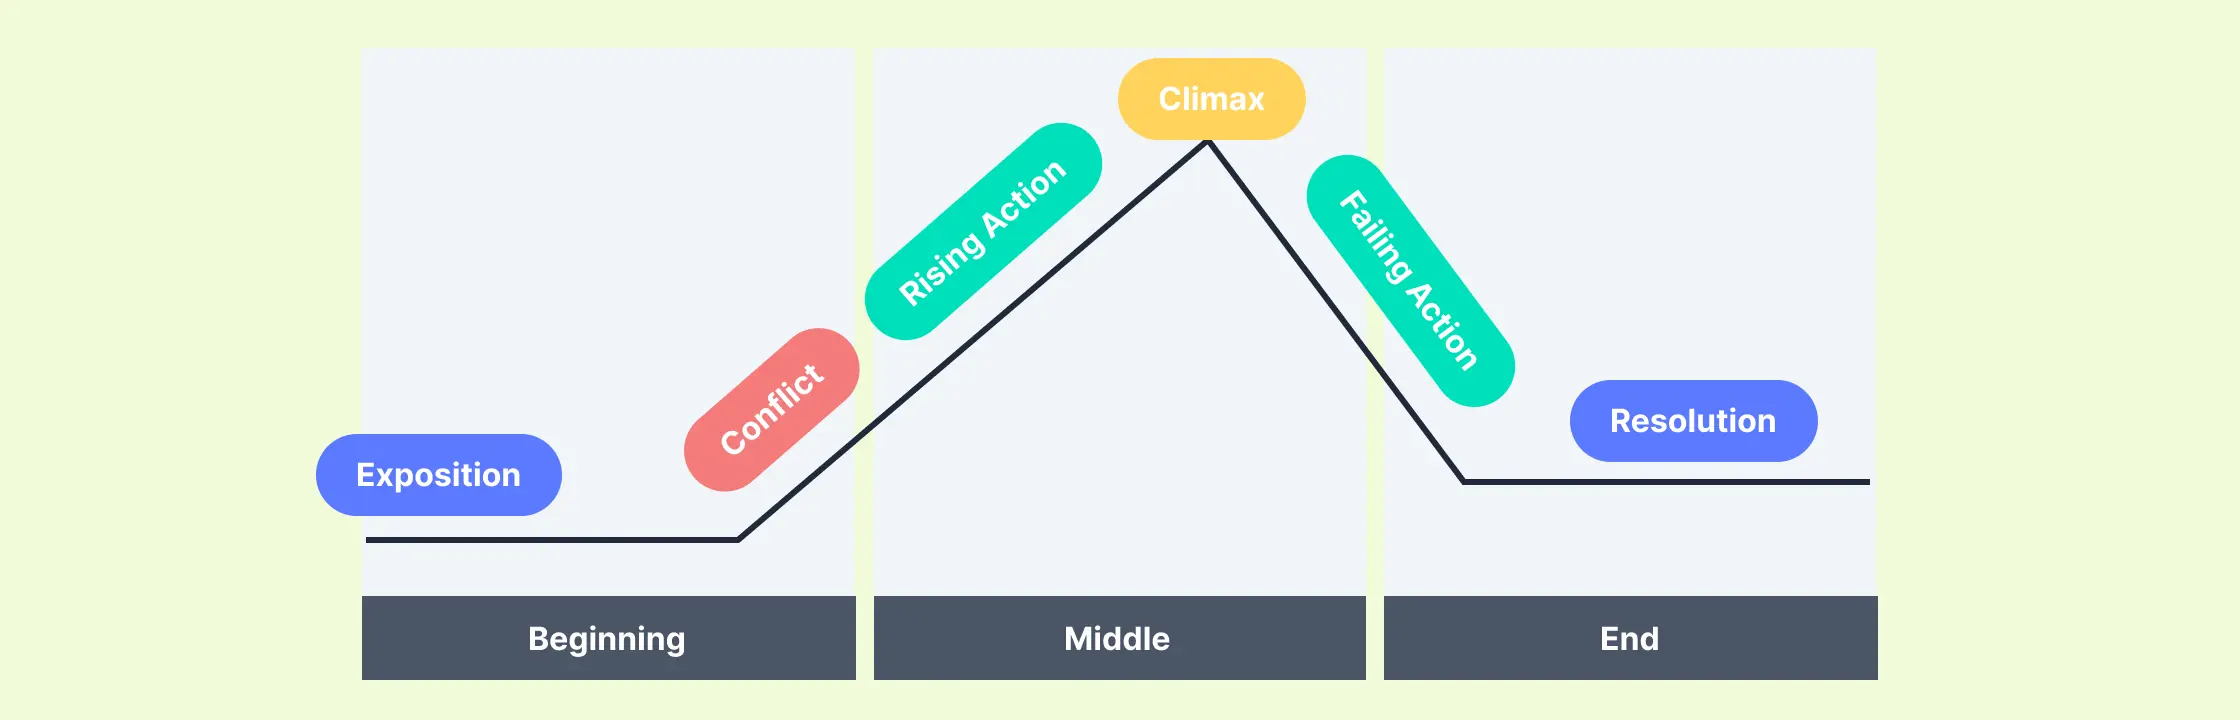
Plot Diagrams: What They Are and How to Use Them for Storytelling A plot diagram helps writers visualize the structure of their stories. By mapping out the main events, a plot diagram ensures a clear and cohesive flow, making it easier to identify the critical moments that drive the narrative forward. In this blog post, we are delving into how to create a plot diagram and how to use it to craft stories.
Concept map note taking is an excellent method especially if you are a visual learner. By representing knowledge in graphs, concept maps can facilitate a deeper learning experience and enhance the retention of information.
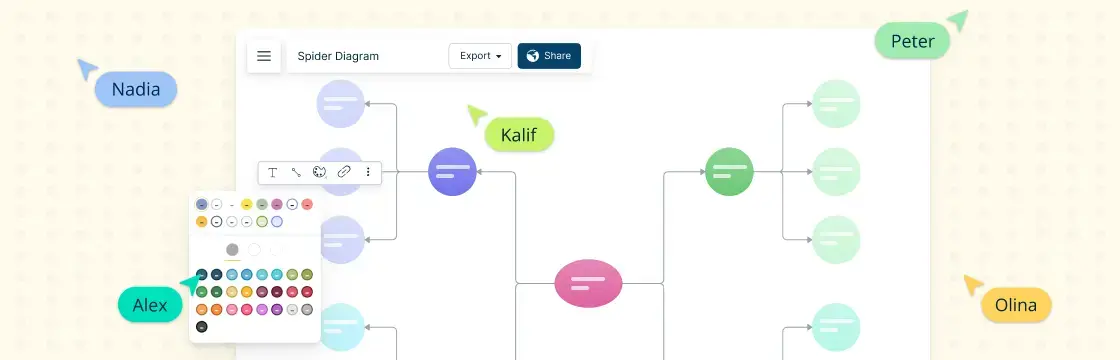
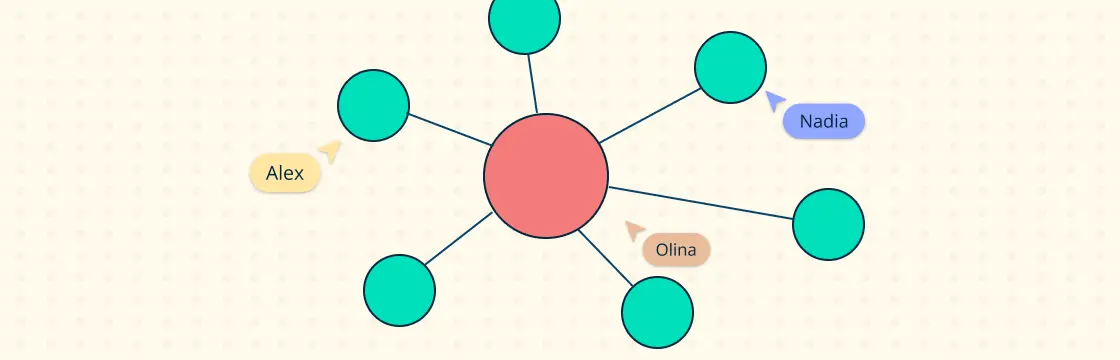
Spider diagrams are a type of graphic organizer that can help you visualize and structure information. They are also known as spider maps or spider webs. In this blog post, we will explain what spider diagrams are, how they work, and how you can use them for various purposes. Whether you want to brainstorm ideas, plan a project, or summarize a topic, spider diagrams can be a useful tool for you.
Bubble maps are a powerful tool for brainstorming, organizing ideas, and visualizing data. They can help stimulate creative thinking and make complex ideas easier to understand and remember. In this blog post, we will provide an overview of how to create a basic bubble map, including templates and tips.
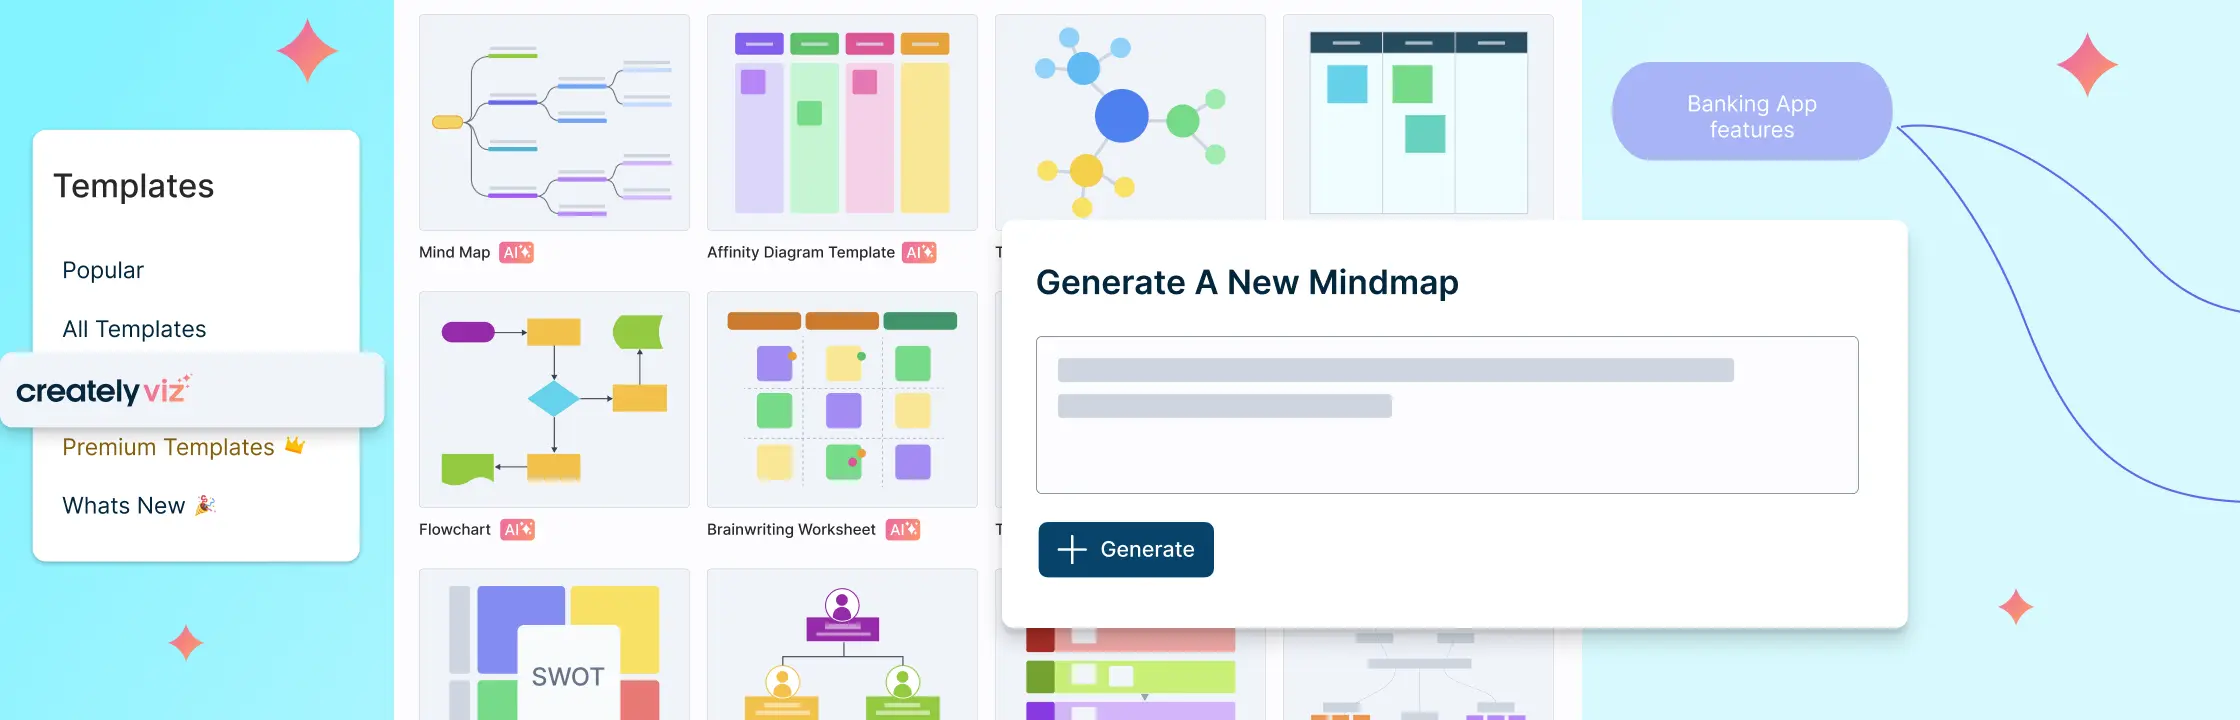
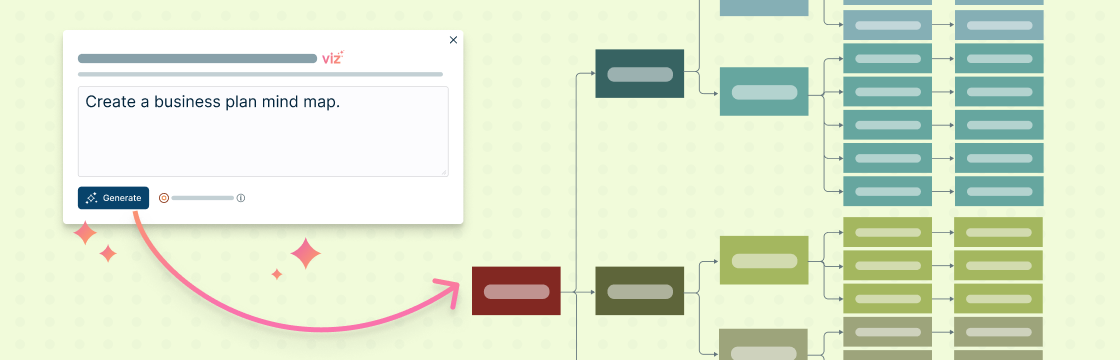
The automatic generation of diagrams has emerged as a transformative capability in artificial intelligence, bridging the gap between complex data structures and comprehensible visual representations. In this guide we will look at how to generate diagrams using AI and how Creately’s AI diagram maker can help streamline the process.
If you have ever tried to write one, you know just how challenging crafting a business plan can be. There’s a lot of foresight, strategic thinking, and meticulous attention to detail involved. You have to understand what people want, figure out how to fund it, and explain your big ideas clearly. Entrepreneurs have to do all this while dealing with the everyday chaos of running a business.
Artificial intelligence has completely changed the way people work and think, and as a result it has revolutionized how ideas are born. AI brainstorming has not only accelerated the idea generation process, but it has also increased human creativity and their collaborative efforts and the quality of output. In this guide, we will explore how AI brainstorming works and how you can leverage it in your work to boost creative thinking and drive innovation.
Running a successful brainstorming session on Microsoft Teams involves a combination of effective planning, utilizing Teams’ features & its plugins, and good collaboration. Here’s a step-by-step guide to help you maximize your Microsoft Teams brainstorming sessions using a visual collaboration platform like Creately.
In today’s fast-paced world, being productive and efficient is crucial as we juggle between personal and work commitments. Action items are the key to staying organized and keep things on track. They are specific, measurable, achievable, relevant, and time-bound tasks that help us get closer to our goals, whether it is finishing a work project or managing our daily lives.
Divergent and convergent thinking are key components of problem-solving and decision-making, often used across different fields. They represent two different ways of approaching challenges: one focuses on generating many ideas, while the other narrows them down to find the best solution.
Innovation is when creativity meets strategy, and solutions are born. Ordinary concepts are transformed into extraordinary innovations when brainstorming is integrated with design thinking.
Do you ever get stuck in front of a blank screen, desperately trying to brainstorm content ideas? We’ve all been there. In the ever-evolving world of online content, coming up with exciting and unique ideas is like finding hidden treasures. At those times when you hit a content roadblock, you can rely on content brainstorming to jump-start your creativity.
Introduction to Brainstorming Have you ever encountered a challenge that felt impossible to overcome, dreamt of starting a business from the ground up, wanted to create a solid plan, launch a product, or hoped to write a memorable story? And the good news is that within you, right now, lies the key to unlocking solutions, innovations, and narratives that can transcend boundaries.
Brainstorming is a great way to come up with fresh ideas and solutions. You get into a room with your team, bounce ideas off each other and pick the best ones. Did you know that brainstorming is more effective when done virtually?
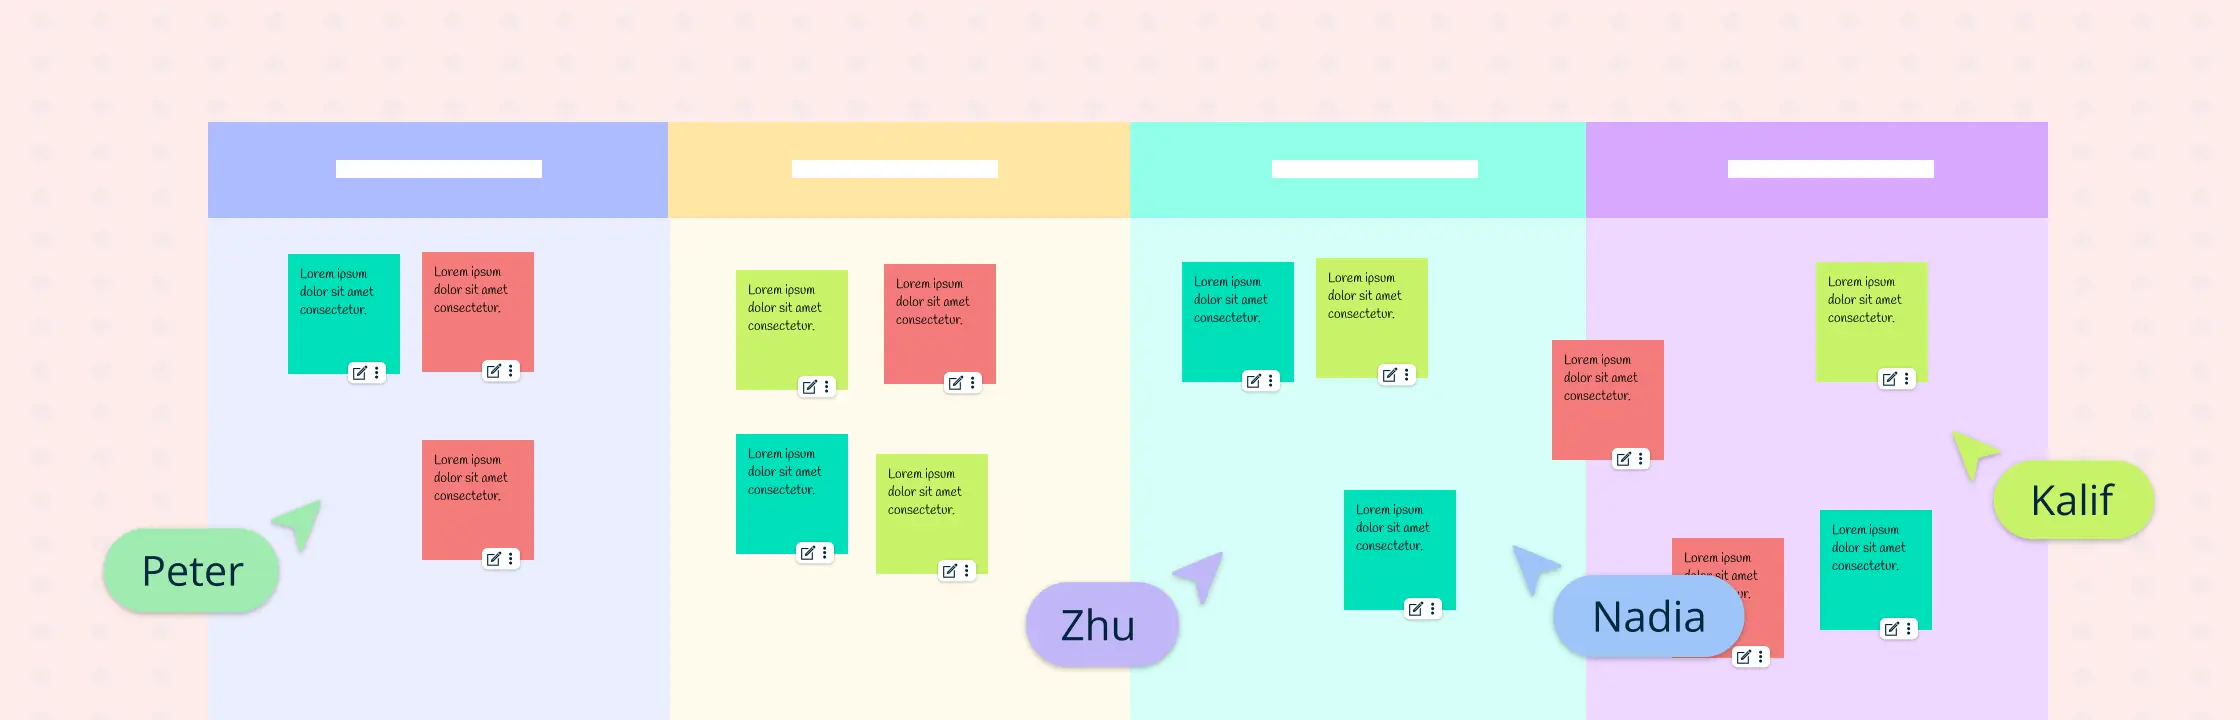
Collaborative brainstorming sessions are the secret sauce that can fuel a team’s innovation, and creativity. Many times it’s just the thing you need to keep your team feeling active and engaged. However, finding ways to keep a session structured and useful can be a real challenge. It’s easy to get lost in the brainstorming wilderness, where ideas stay on sticky notes and never see the light of day.
Brainstorming is a popular technique used by teams looking to come up with a large number of new and innovative ideas quickly and easily. But doing it effectively can be a challenge, especially for remote teams. Visual collaboration tools can make brainstorming easier by providing a shared space where team members can contribute and share their ideas visually. These tools can help to break down barriers, spark new ideas, and facilitate better communication and collaboration.
Brainstorming, often the go-to method for generating fresh ideas and solving complex problems within teams, has a mixed reputation. While some individuals thrive on the creative energy it brings, others dread the thought of it. So, why do many brainstorming sessions end up being ineffective, leaving participants staring expectantly at each other, instead of producing innovative ideas? In this article, we will explore why brainstorming often falls short of expectations and provide practical solutions to transform this process into a powerful tool for idea generation.
After brainstorming, you take the ideas you generated and turn them into actionable plans and solutions. What comes after brainstorming is a structured process that makes sure that creativity is harnessed effectively to address the problem or achieve the desired goals.
Brainstorming in business is an indispensable tool; it helps ignite creativity, align goals, and sharpen problem-solving skills. From coming up with new product ideas to mitigating risks, brainstorming is used to find solutions faster in every business, big or small.
A brainstorming workshop is a structured and collaborative way to come up with ideas, solve problems, and innovate. Whether you’re a business leader seeking innovative solutions, an educator looking to spark students’ creativity, or simply someone eager to explore new horizons, running an effective brainstorming workshop can be a game-changer.
While everyone is familiar with the concept of brainstorming, brainstorming running an actual brainstorming session can be as challenging as any other traditional meeting. That’s where brainstorming rules come in. They serve as guidelines to make brainstorming work smoother. And establishing a set of ground rules can help you overcome these challenges more effectively.
It’s no secret that marketing professionals face fierce competition and constantly changing consumer preferences. So, how do we rise above the noise and create marketing campaigns that truly resonate with our audience? The answer lies in the art of brainstorming.
One of the most effective ways to foster team creativity is group brainstorming sessions. These collaborative sessions allow team members to unleash their creativity, generate new ideas, and find innovative solutions. However, it is crucial to find the right balance to maximize the output of your team. Group brainstorming is like a carefully choreographed dance. Sometimes you lead, sometimes you get led. In this blog post, we will explore strategies for boosting team creativity through group brainstorming and discuss how to maintain this delicate balance. By implementing these strategies, your team can tap into their collective genius and unlock their full creative potential.
Group brainstorming goes beyond merely bouncing ideas off each other in a team and hoping for the best. It helps teams build a better understanding about the problems they are attempting to solve.
Visual collaboration tools are essential for brainstorming and problem-solving sessions, for both in-person and remote teams. They provide a shared space where team members can generate and share ideas visually, using tools such as diagrams and sticky notes. This can help to improve communication and collaboration, and lead to more creative and innovative solutions.
Brainstorming, is a tried-and-true method for sparking fresh ideas and solving problems. It’s where honest conversations thrive, and innovative solutions are born.
How to Create a Design Board Picture this: You’re standing in an empty room with ideas on how to design it but unsure how to bring them to life. This is where the design board can help. Whether you’re a seasoned interior designer or a DIY enthusiast, design boards are effective tools that can help you bring your vision to life.
In today’s fast-paced enterprise environment, it’s too easy to get busy with the demands of daily tasks and projects, which can make you miss out on opportunities for growth and improvement. Retrospective meetings are essential for identifying what worked well (wins), what challenges were faced (blockers), and what can be improved in a project. Even though you can conduct retrospectives without using technology, using a visual collaboration platform can make them significantly more effective and efficient. Here’s how a visual collaboration platform like Creately can help teams run a retrospective meeting productively:
Ever felt like your brain is a jumbled mess of ideas, all fighting for attention? You’re not alone! Whether you’re planning a project, studying for an exam, or just trying to organize your thoughts, it can sometimes feel like you’re trying to untangle a giant knot of Christmas lights. That’s where cluster diagrams come to the rescue!
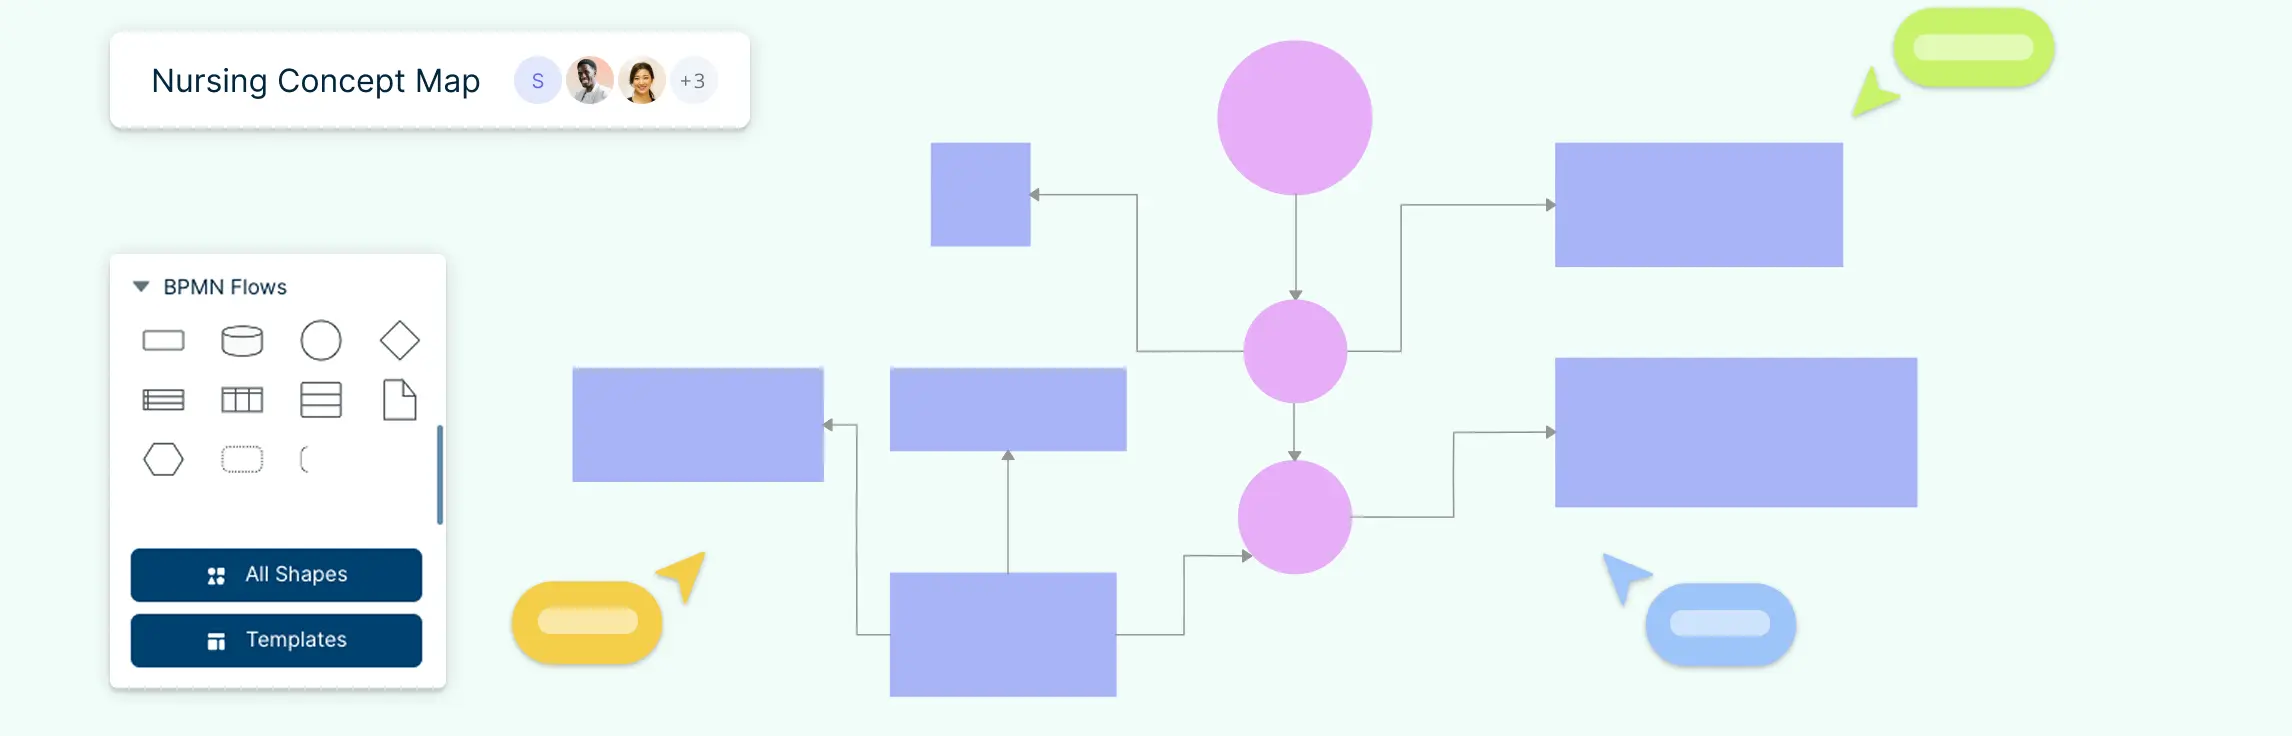
This guide will explore what a concept map in nursing is, how to create one, and its role in nursing education. You’ll also find practical nursing concept map examples and templates tailored for different conditions.
When it comes to professional development, using a guiding tool is beneficial as it provides clarity and direction, irrespective of which career stage you are in. This is where career concept maps comes into play. In this blog post, we focus on what a career concept map is and its benefits, while introducing you to ten templates to help you progress in your career
Retrospectives are an essential tool for teams striving to continuously improve and drive success. By reflecting on past performance and identifying areas of improvement, teams can enhance collaboration, communication, and productivity. When combined with the right platform, such as Creately, retrospectives become even more powerful. In this blog, we will explore five key benefits of retrospectives and highlight the Creately features that will help you host effective and engaging retrospective meetings.
A digital vision board is a visual representation of your goals, dreams, and aspirations, created using digital tools. Digital vision boards offer a more flexible and dynamic way to visualize your future. In this blog post, we dive into how.
Marketing retrospectives allows teams to analyze, learn from, and improve their marketing processes. Whether you’re an agile marketing team or follow a mixed methodology, regular retrospective meetings are a vital ingredient for success.
Retrospectives are a powerful tool for teams to reflect, learn, and improve. They provide a dedicated space for collaboration, where everyone’s unique perspectives are valued. These meetings drive team success by fostering transparency, collaboration, and growth. Let’s look at why retrospectives are important, especially for teams.
Retrospective meetings offer valuable opportunities for teams to reflect, learn, and improve. However, to maximize their effectiveness, it’s crucial to avoid common mistakes. In this article, we’ll explore ten retrospective mistakes to avoid during retrospectives and provide tips for a positive and productive environment. Let’s dive in and make the most out of these meetings!
Retrospective questions are crafted to foster reflection and ignite engaging discussions in a retrospective meeting. They serve as a guide for teams to evaluate their processes, uncover potential areas for enhancement, and generate practical insights. By posing these retrospective questions, teams can delve into valuable learnings and drive tangible improvements.
Most people assume that to build a great website, your priority should be on technical aspects or being good at the design stuff. However, we disagree.
How to Draw a Concept Map? Step 1: Define Your Central Topic The first step in drawing a concept map is to choose your central topic. This could be an idea, question, or concept that you want to explore. Make sure the topic is specific enough to allow for detailed exploration.
Every organization needs a steady supply of fresh creative ideas to stay relevant and ahead of their competitors successfully. As necessary as it is, generating good new ideas isn’t as easy as getting everyone in the team into a room and spending 3 hours to come up with barely anything.
So you want to learn flowcharts? This flowchart tutorial will guide you through everything you need to know. You’ll discover what a flowchart is, the different flowchart symbols, how to create flowcharts, and the best practices to follow. We’ve also included answers to common questions about flowcharts. Best of all, we’ll provide you with flowchart software to create them faster and better.
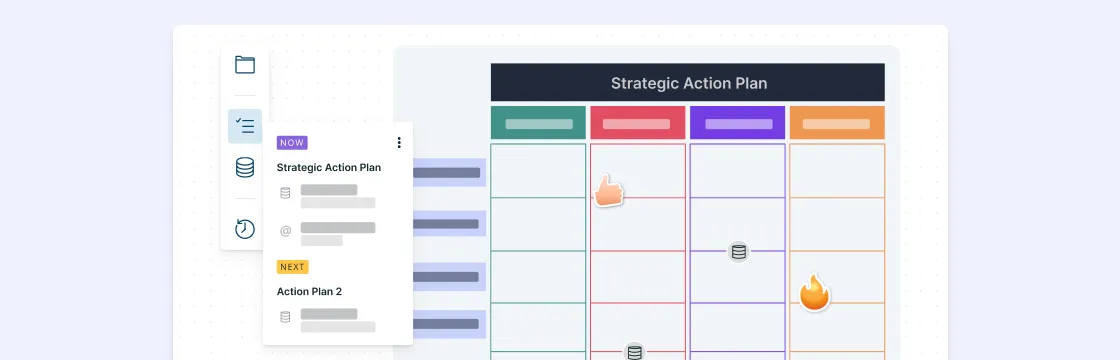
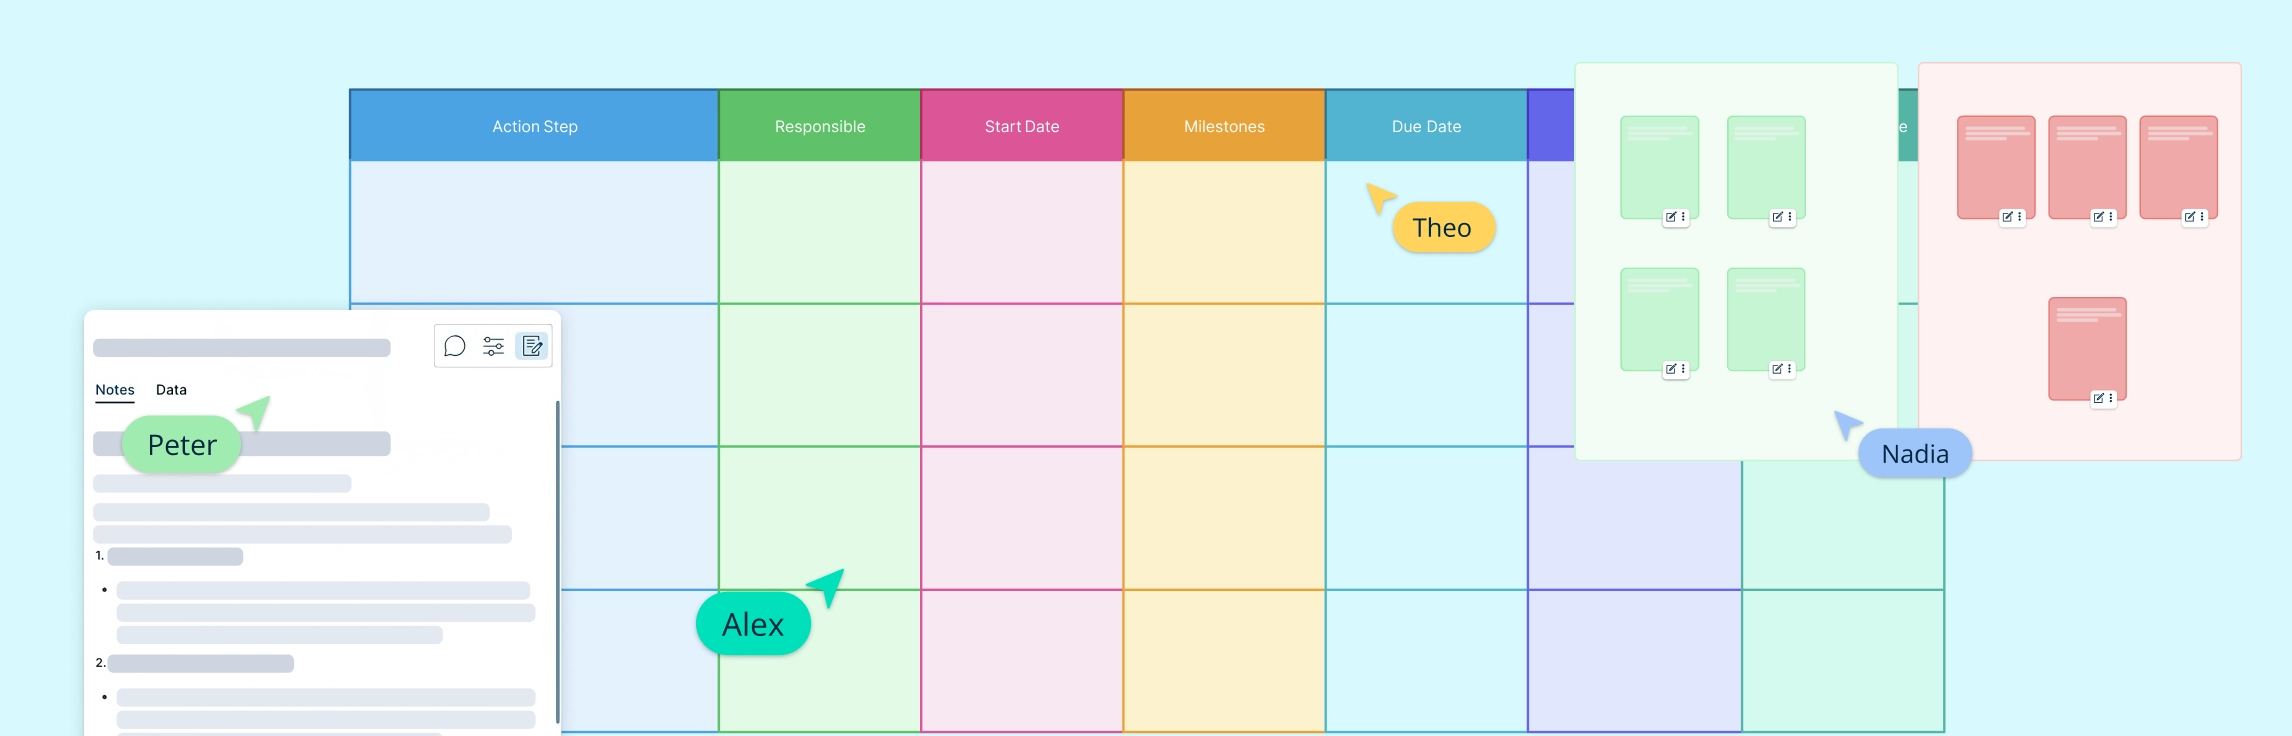
What Is an Action Plan? An action plan is a detailed outline that defines the actions needed to achieve a specific goal. It includes tasks, deadlines, assigned responsibilities, required resources, and milestones. Creating an action plan helps teams and individuals stay organized, focused, and accountable, whether in personal projects, business strategies, or academic endeavors.
What is a Business Model Canvas? The Business Model Canvas is a one-page strategic tool that helps visualize and assess a business idea. It simplifies traditional business plans by breaking down nine key elements. The right side focuses on external, customer-related factors, the left on internal business operations, and the center highlights the value exchanged between the business and its customers.
User Flow Diagram Definition A user flow can refer to the overall navigation paths available in a product, the actual experience of moving through a process, or the specific steps a user takes to complete a task. Tools like flowcharts are effective for visualizing these user journeys within a website or app, helping to trace how users interact with various interface elements and features.
Graphic organizers combine text and visuals, making them a scientifically proven tool for effective teaching and learning. They are highly beneficial for teachers and students alike, helping to create more engaging lessons and enhancing comprehension. Below, we’ve outlined different types of graphic organizers that you can use in various scenarios—whether it’s reading, writing, conducting research, or preparing for exams. The types of graphic organizers below include a ready-to-use template to get you started instantly.
Visual communication is all around us—on social media, websites, billboards, and presentations. It uses images, graphics, and videos to make information easier to understand and more engaging. In today’s fast-paced world, visuals are a powerful way to grab attention and share ideas quickly.