Data integrated org chart based planning tools.
Agile project planning with integrated task.
IT and Cloud architecture tools for all platforms.
Product Management & Software Architecture.
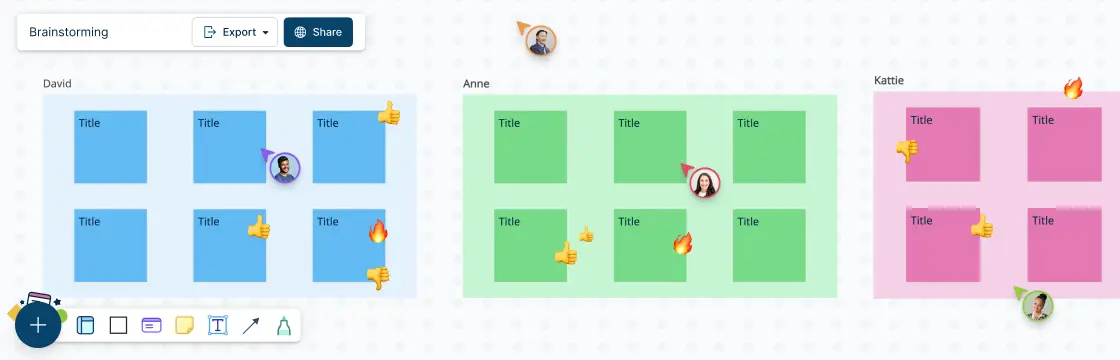
Brainstorm, plan campaigns and organize assets.
Process, Value chain and System analysis tools.
A visual workspace for students and educators.
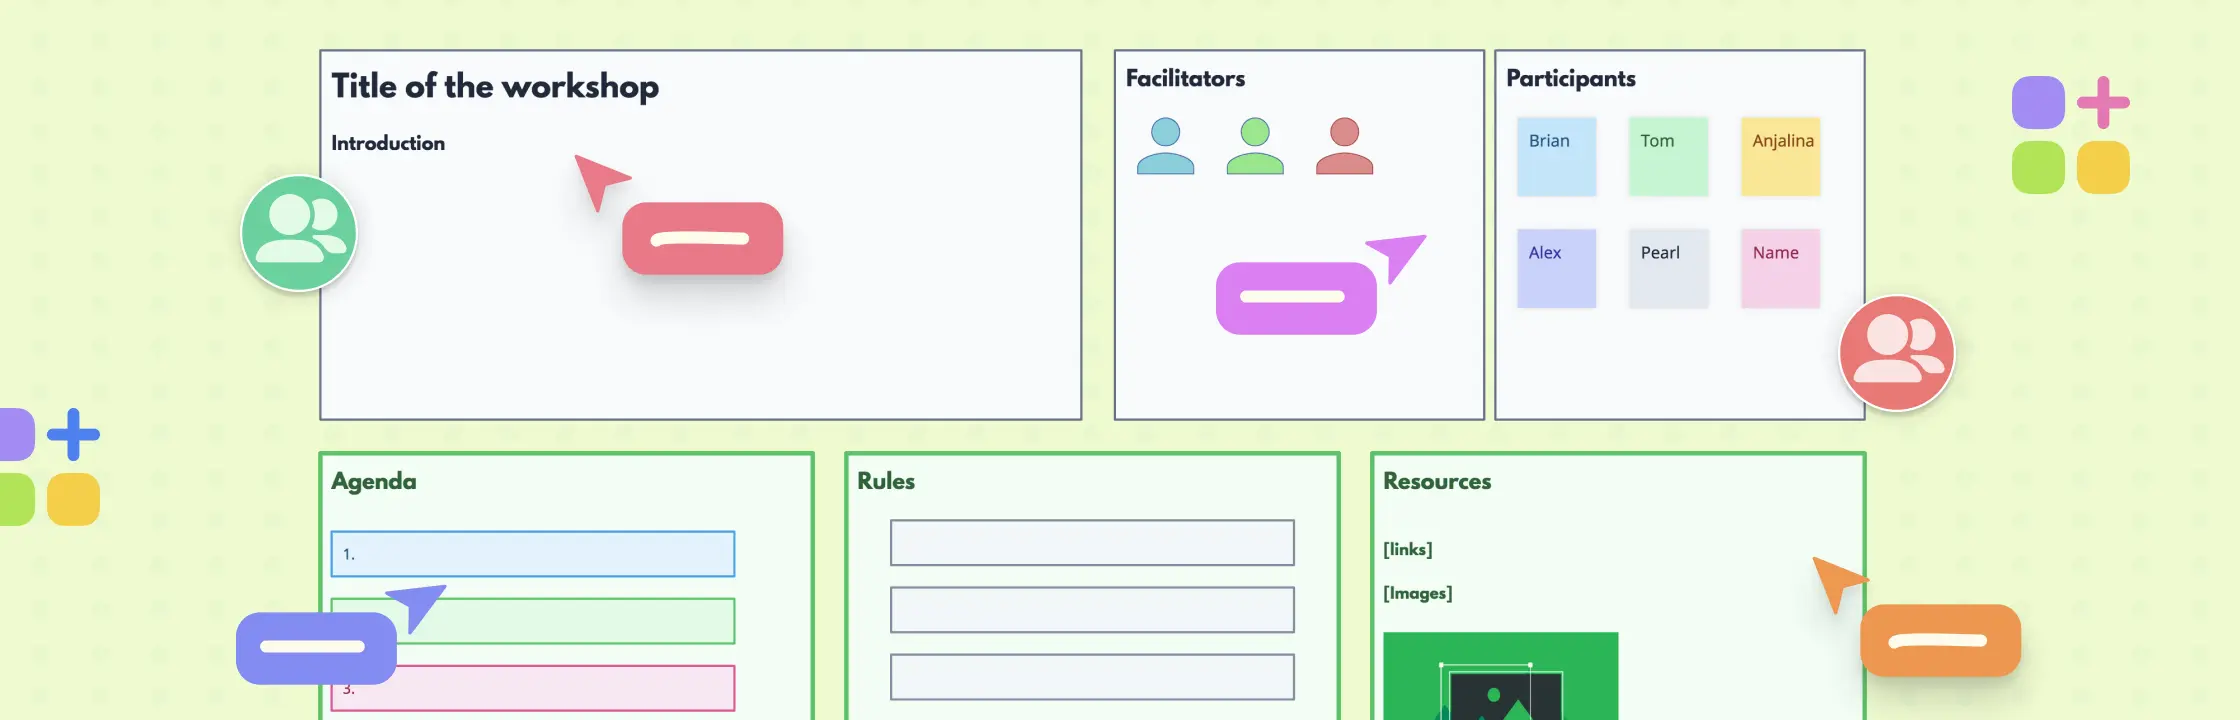
Run Meetings, Workshops or get feedback.
Document, plan and optimize business.
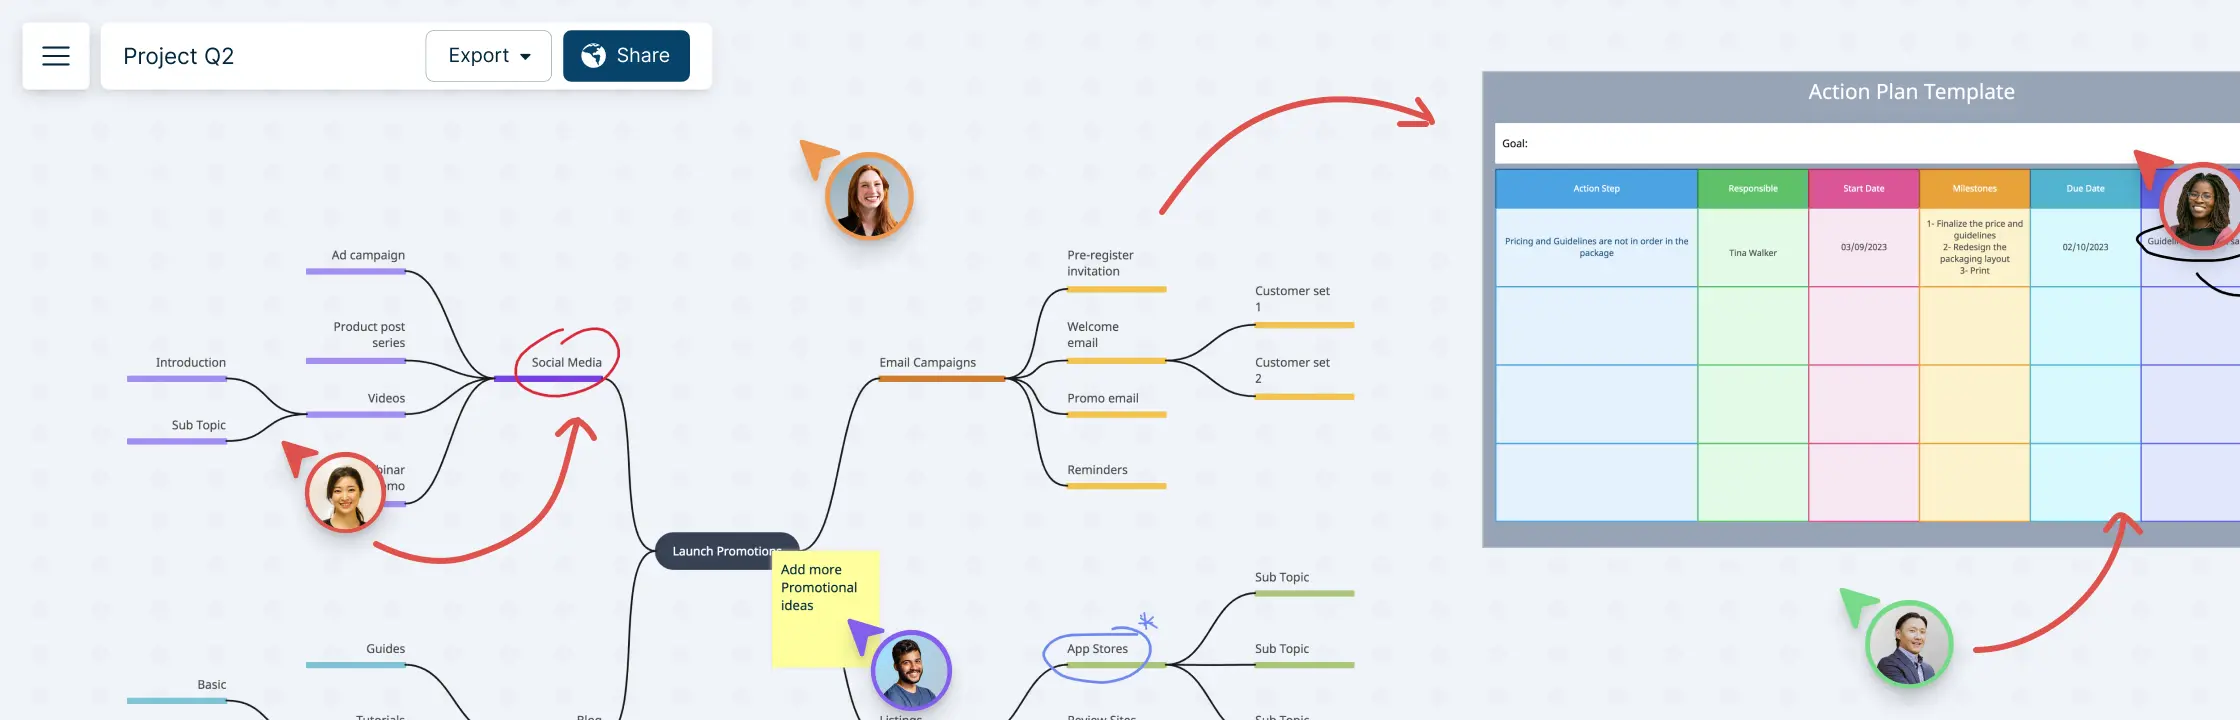
Idea to execution on a single collaborative.
Enterprise-grade security & team collaboration.
Log In
Sign Up Free
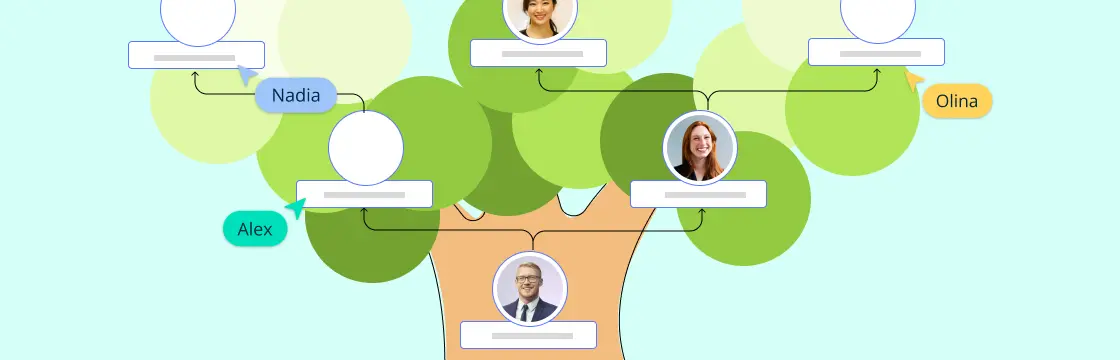
A counseling genogram is a powerful therapeutic tool used to visually map out family relationships, emotional patterns, and generational influences. Often referred to as a psychological family tree, it helps therapists and counselors uncover hidden dynamics, identify sources of stress or trauma, and gain deeper insight into a client’s behavioral and emotional history. Whether in individual, group, or trauma-focused therapy, counseling genograms are essential for facilitating meaningful conversations and driving personal growth.
Understanding the structure and dynamics of a community can be complex—but a community genogram makes it easier to visualize those connections. Whether you’re a social worker, educator, healthcare provider, or community leader, these diagrams offer a powerful way to map relationships, identify key roles, and highlight support networks within any social environment.
Genograms for health history are advanced family trees that visually map out hereditary medical conditions, mental health issues, and chronic diseases across generations. Unlike a traditional family tree, a medical genogram provides a clear picture of how health conditions run in families, helping individuals, therapists, and healthcare professionals assess genetic risks, plan early interventions, and make informed decisions. In this guide, we’ll explore 10 examples of genograms for health history, each with editable templates.
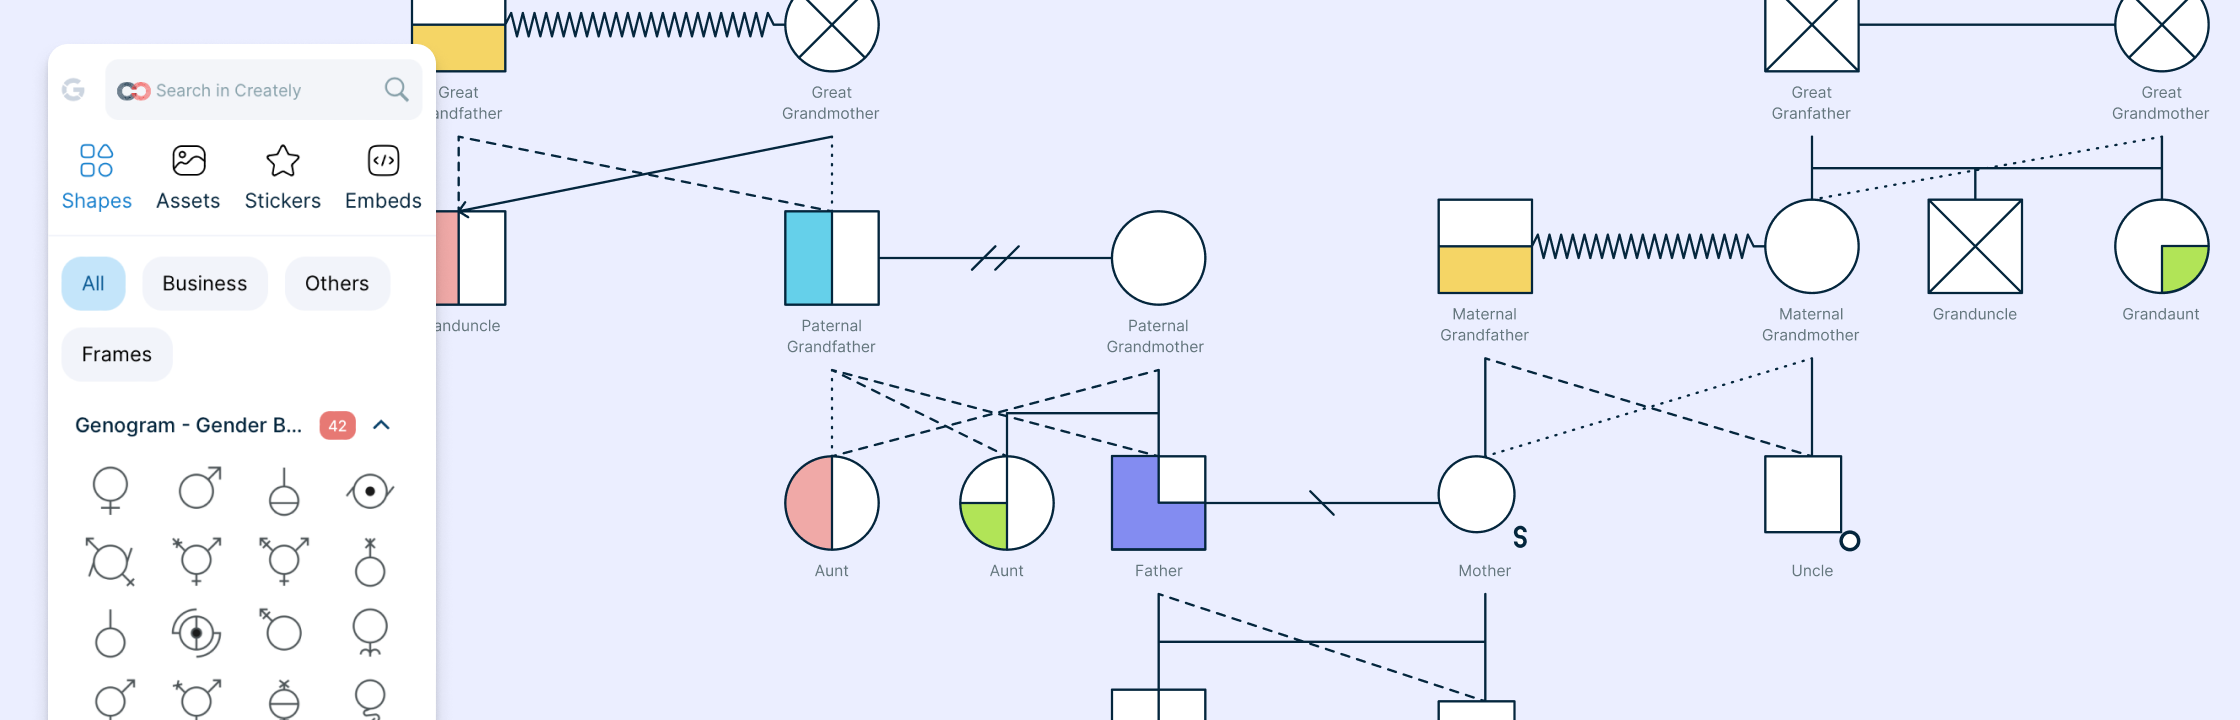
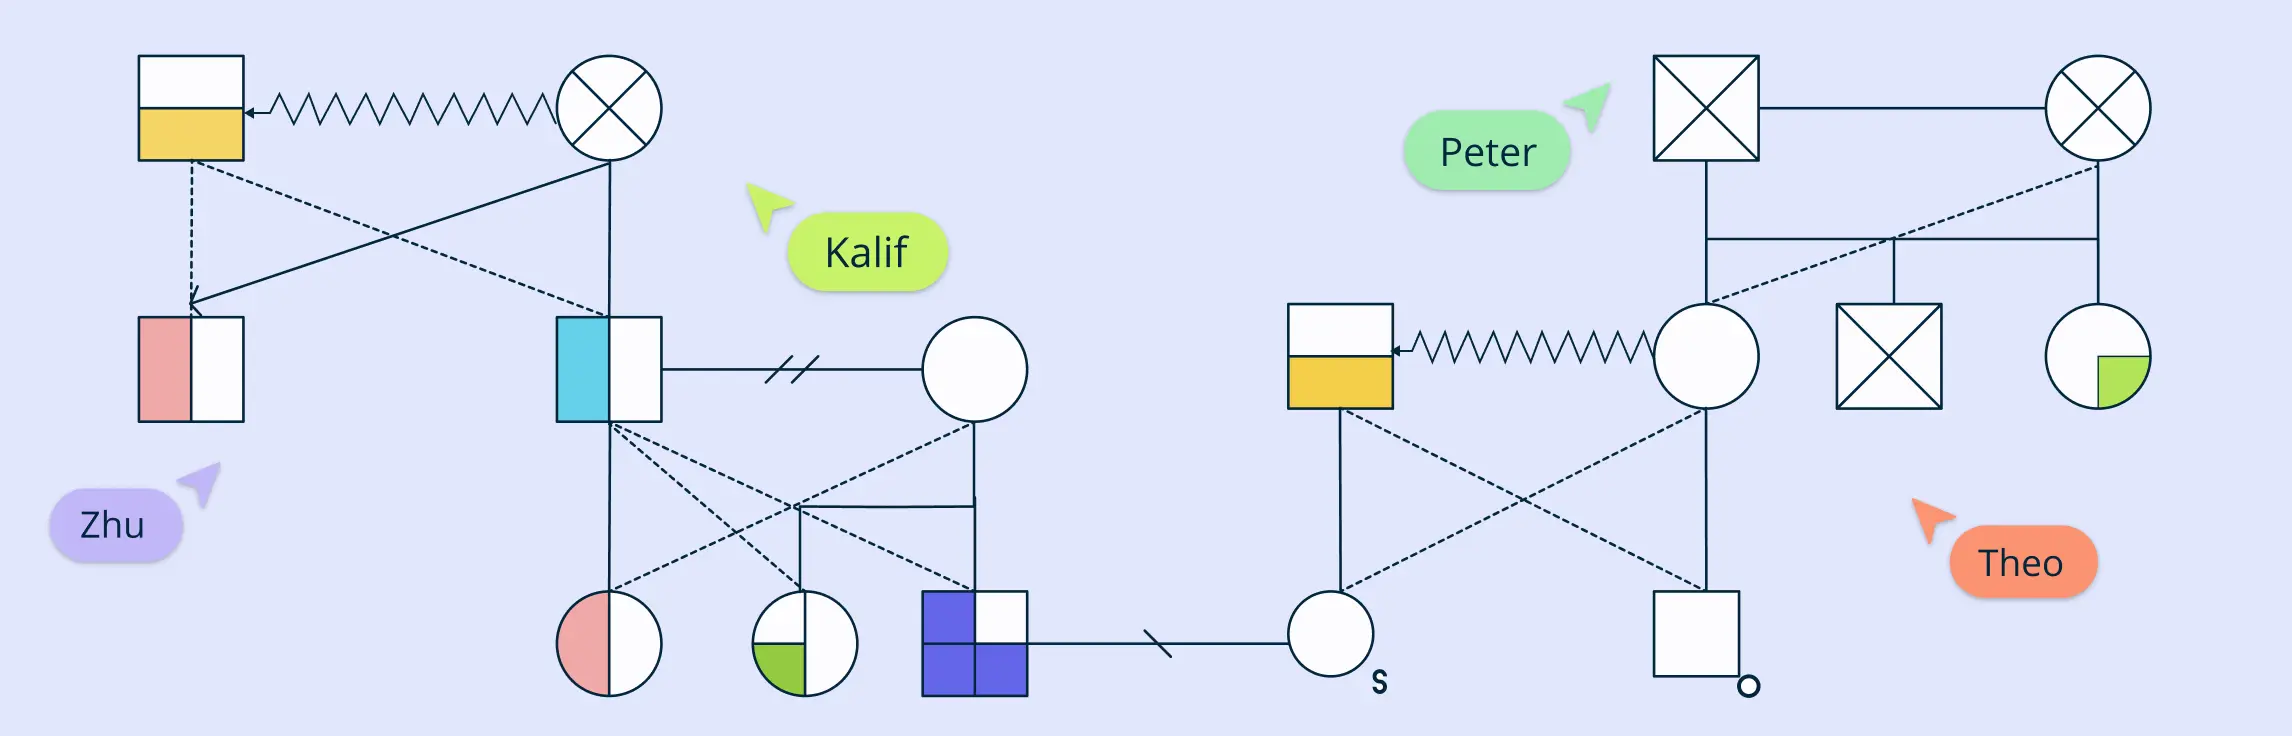
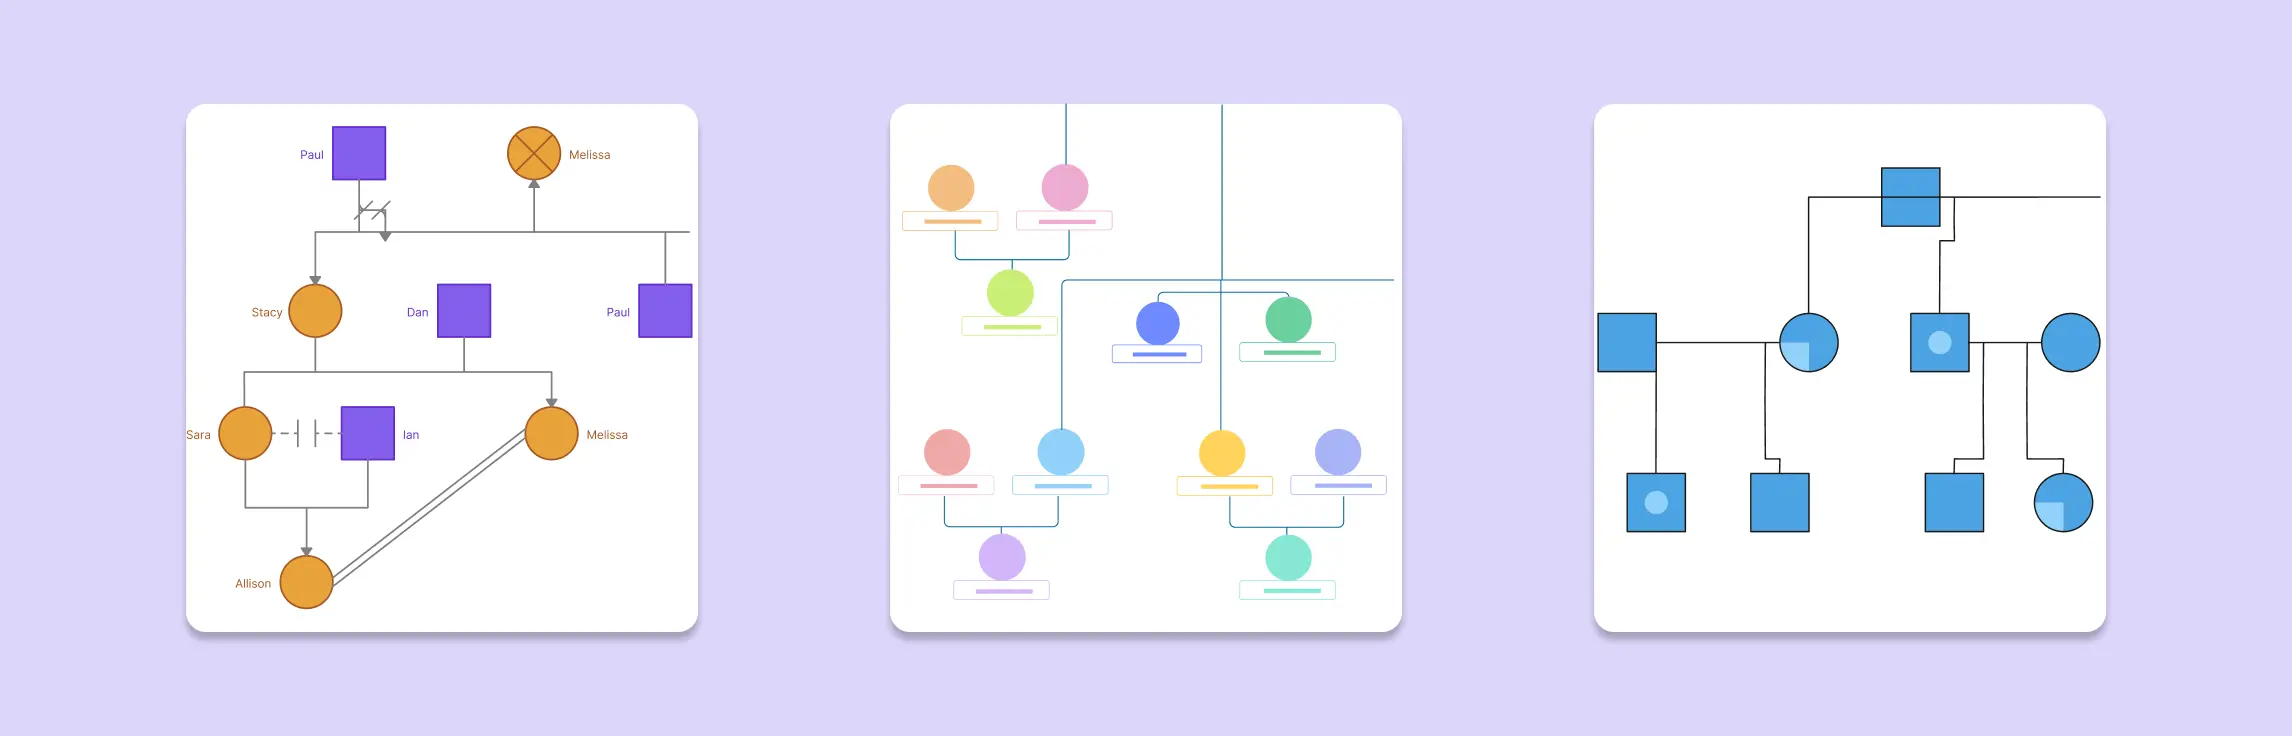
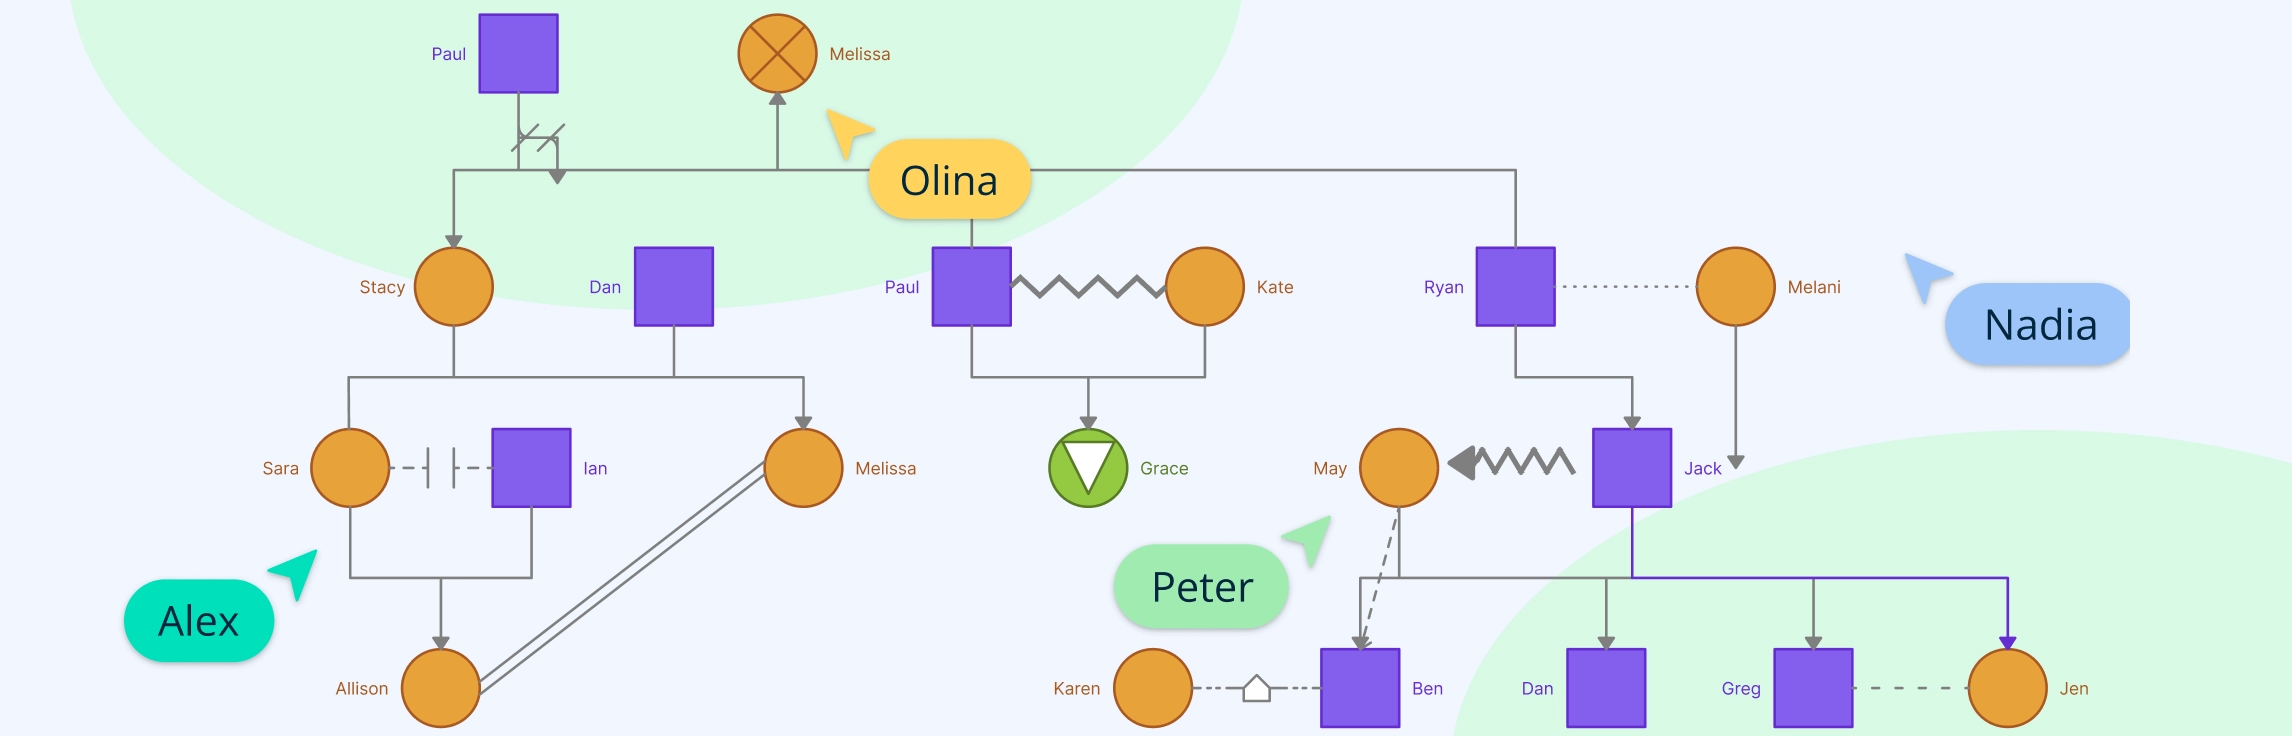
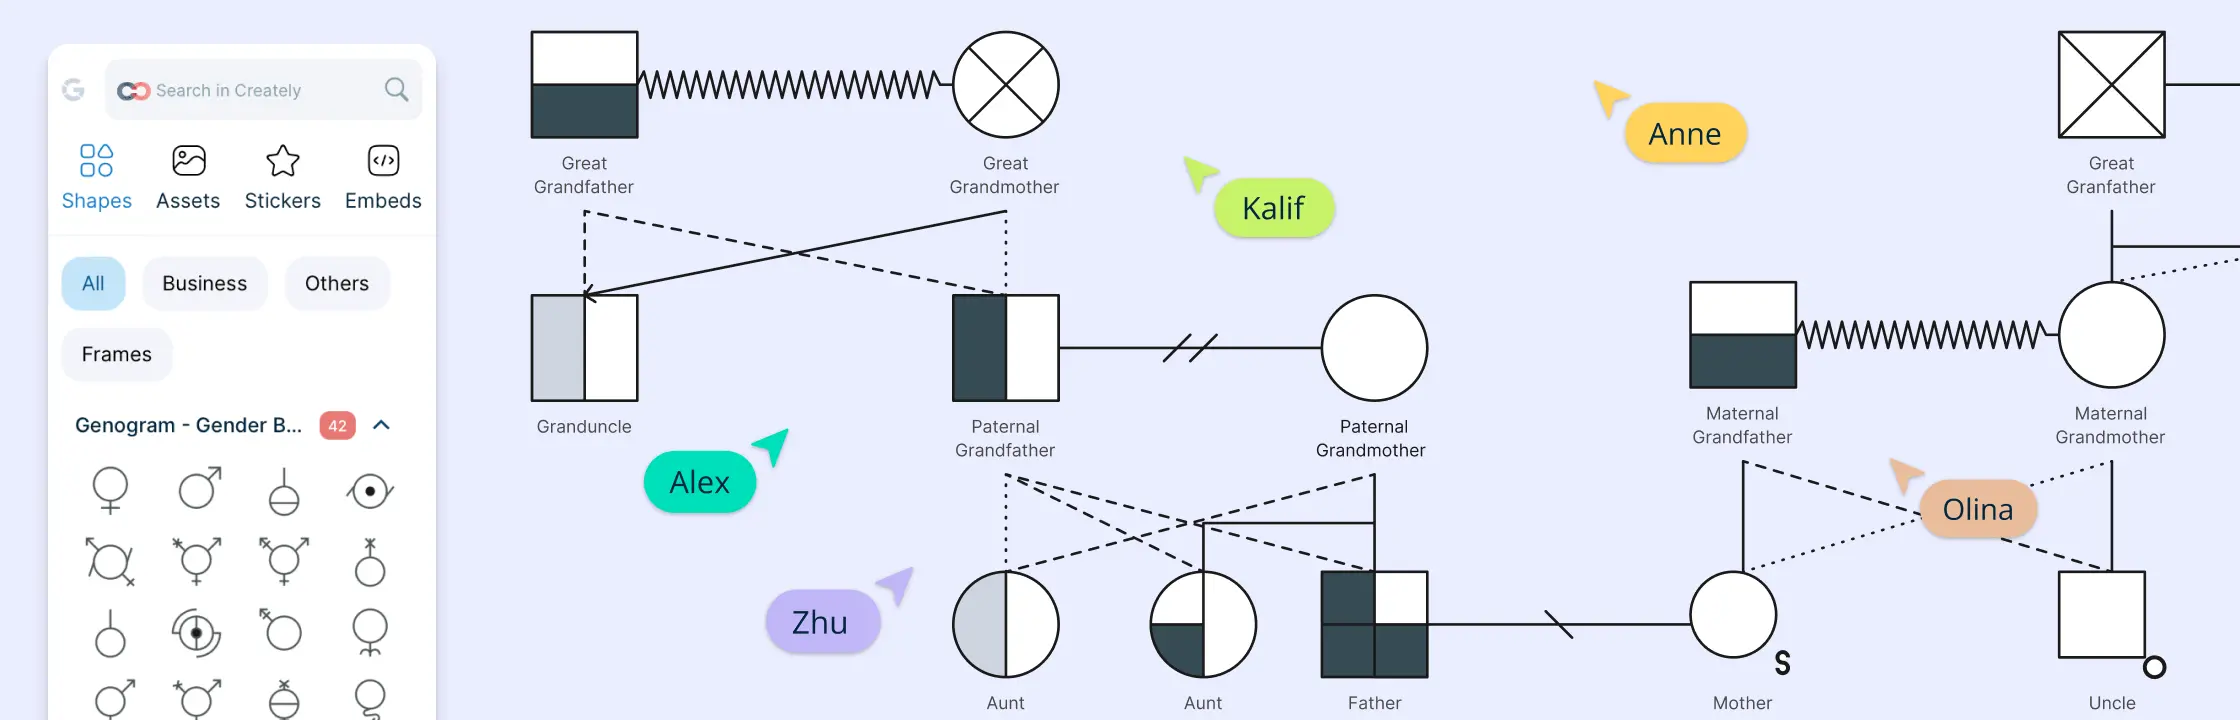
Understanding the intricate dynamics within families can be challenging, but genograms offer a powerful visual tool to map out these relationships. In this guide, we will explore the essential symbols used in genograms to represent everything from basic family structures to complex emotional and medical relationships. Whether you are a therapist, social worker, or healthcare professional, knowing these genogram symbols will enhance your ability to interpret and communicate family histories, making your work more effective and insightful. We have also provided you with a set of handy genogram legends which can be quickly referenced to understand the symbols you may need for your specific application.
In the field of social work, understanding a client’s environment is just as important as understanding the client themselves. This is where an ecomap in social work becomes an invaluable tool. It provides a visual snapshot of the client’s social and environmental world, mapping out connections to family, friends, work, community resources, and other influential systems. This guide will help you better understand and apply the ecomap in social work to enhance client systems and support informed intervention planning.
Cultural competence isn’t just a theoretical concept—it’s a foundational skill every therapist must develop. One of the most effective tools for fostering this awareness in training settings is the cultural genogram. Far more than a family tree, it’s a visual and reflective tool that helps therapists-in-training explore the influence of culture, identity, and intergenerational patterns on individual and family dynamics.
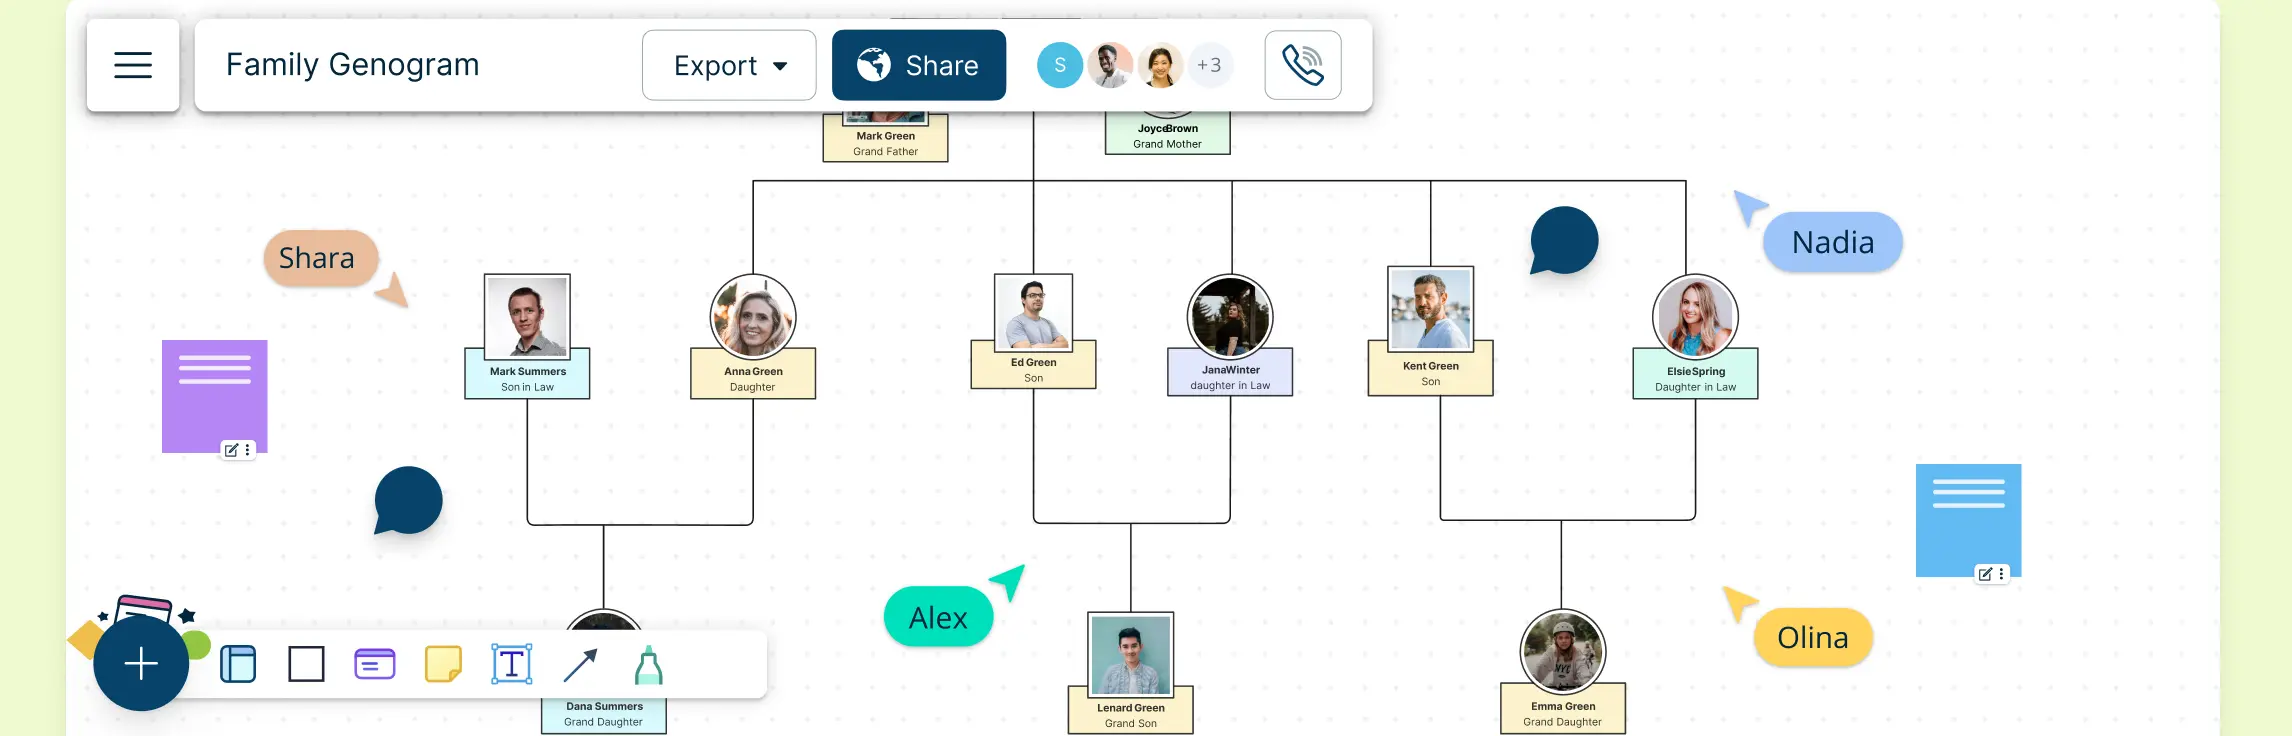
Have you ever wondered how your family’s history, health patterns, and relationships shape who you are? A family genogram is more than just a family tree—it’s a powerful visual tool that maps out generations of information, offering deep insights into emotional dynamics, medical histories, and behavioral patterns.
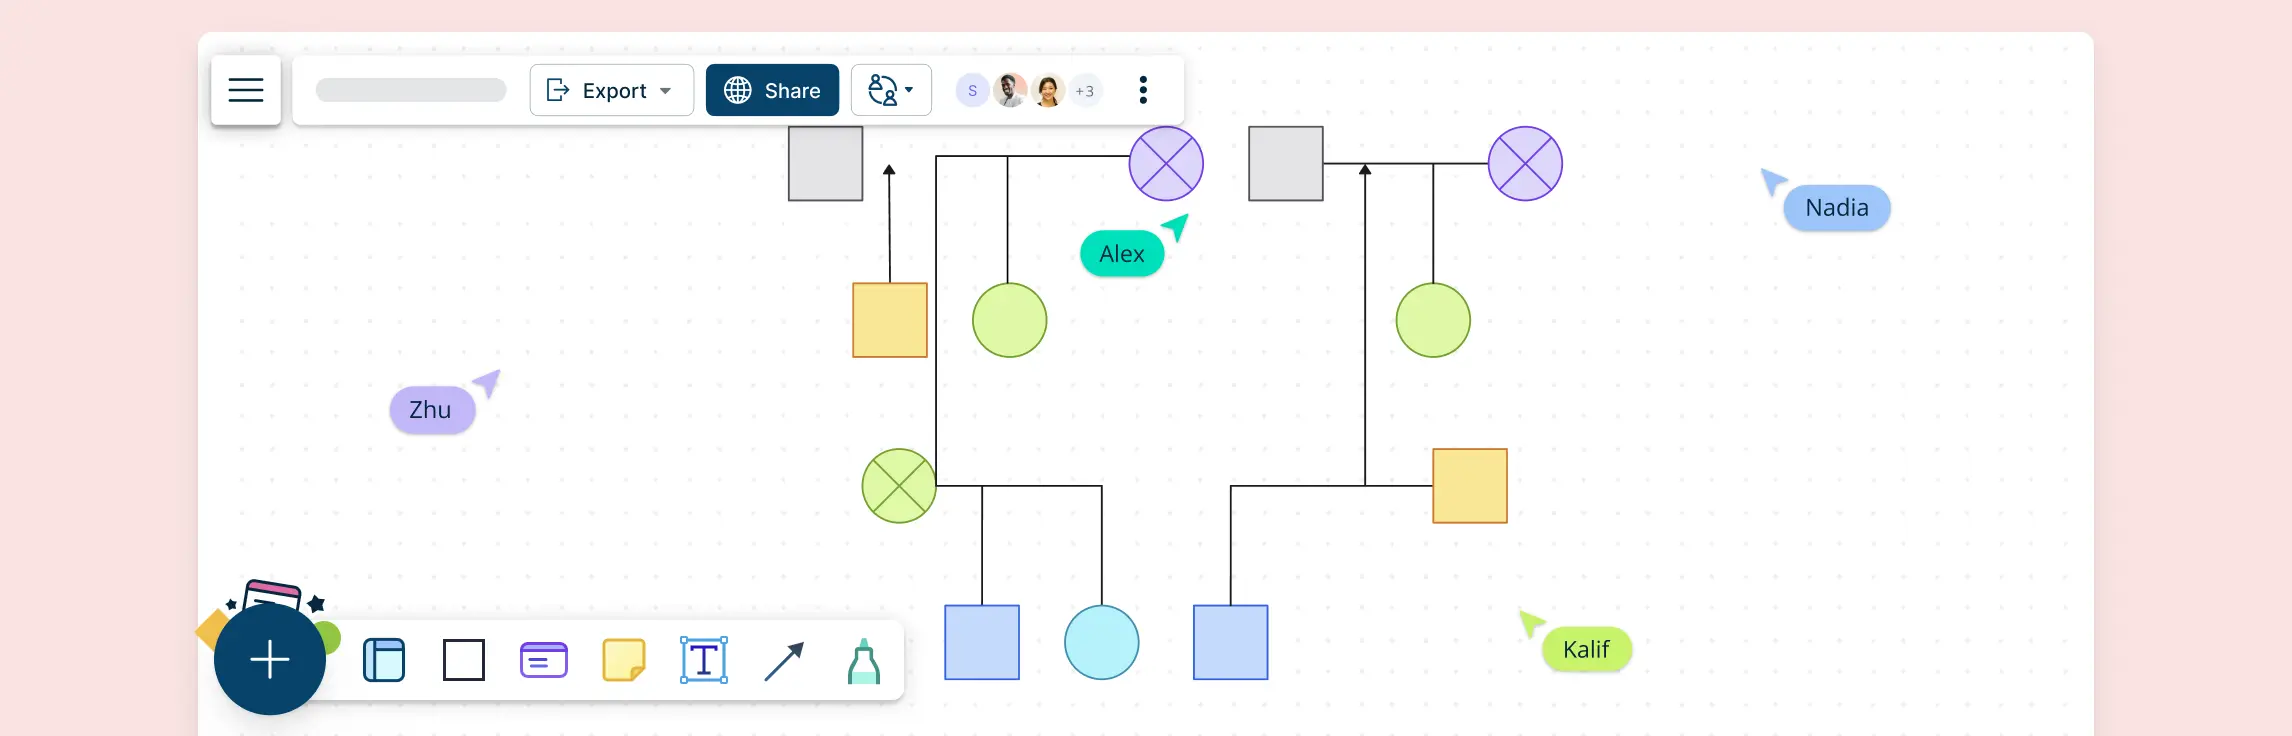
Understanding the roots of emotional patterns and behavioral dynamics often begins with a clear picture of family relationships, and that’s where a genogram in psychology becomes invaluable. More than just a family tree, a genogram is a powerful visual tool used by therapists, counselors, and mental health professionals to explore generational patterns, emotional bonds, and psychological influences. In this guide, we’ll walk you through what a genogram in psychology is, how to create one step-by-step, its key uses in therapy and assessment, and why Creately is the ideal platform to bring your genograms to life. Whether you’re a mental health practitioner, student, or simply curious about psychological tools, this comprehensive resource is designed to give you clarity, confidence, and actionable insight.
A simple genogram is a powerful visual tool used to map out family relationships, behaviors, and patterns over multiple generations. Unlike a basic family tree, a genogram provides deeper insights into the dynamics of family connections, including emotional ties, medical histories, and even career paths.
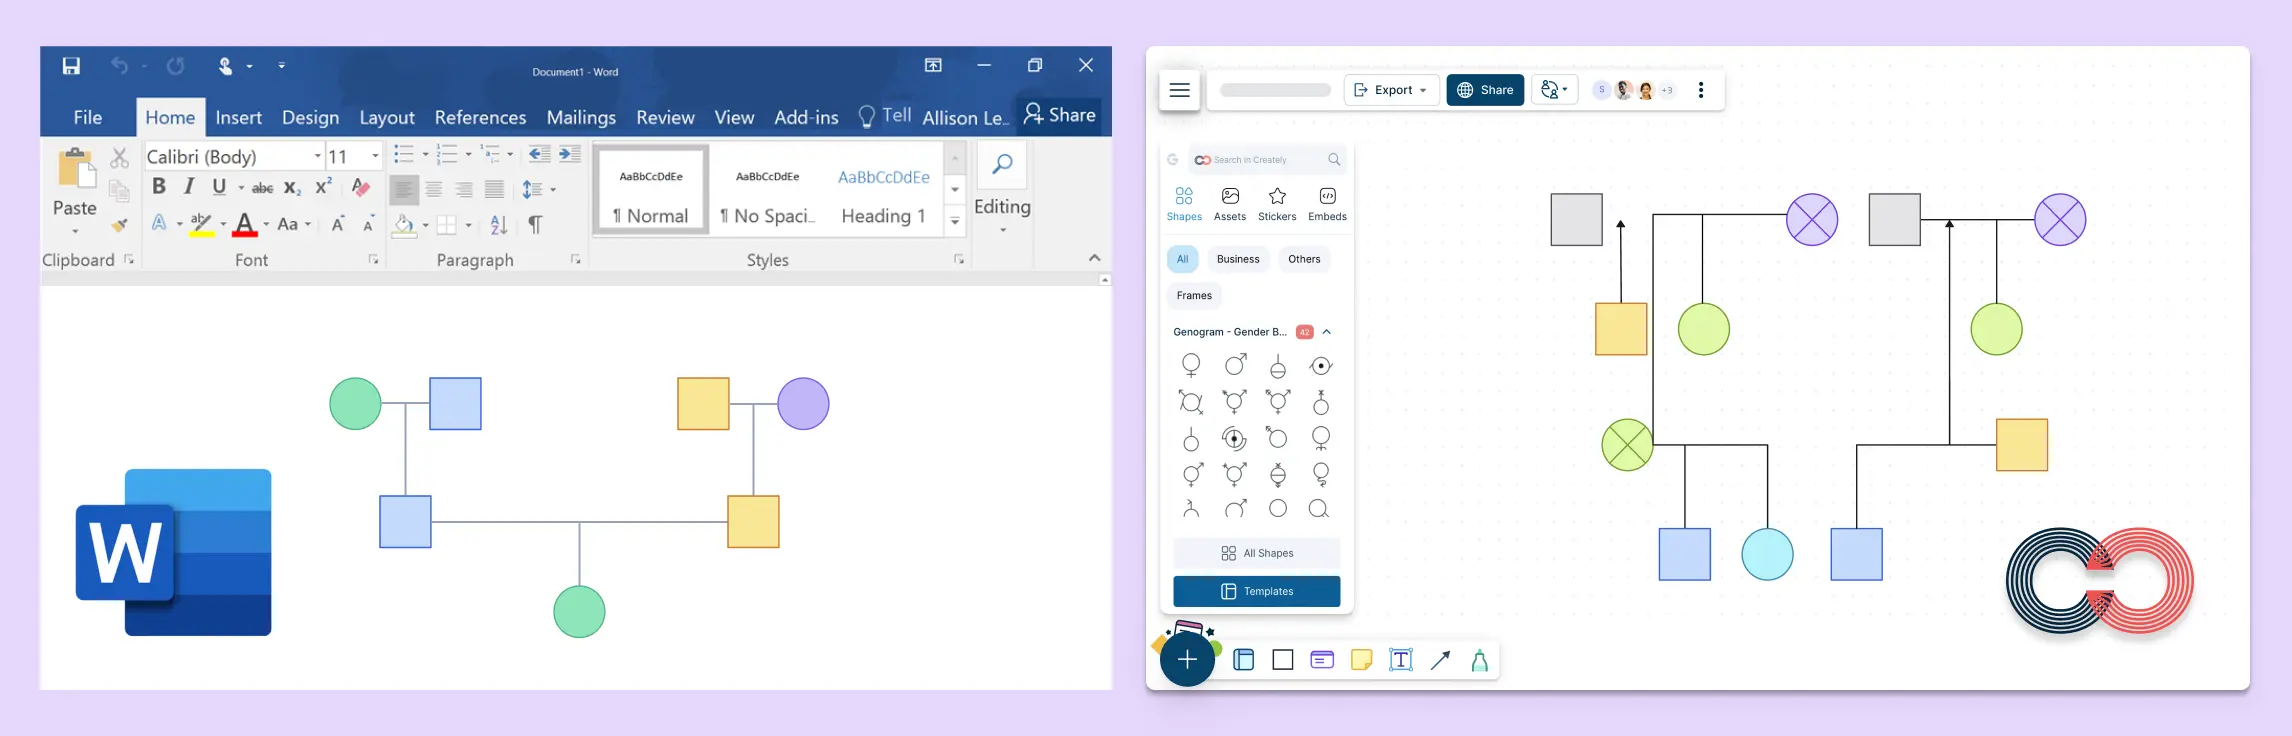
If you’ve ever tried to figure out how to create a genogram in Word, you probably realized it’s not as straightforward as it sounds. While Microsoft Word offers basic shapes and lines, it’s not built for mapping complex family structures or emotional dynamics.
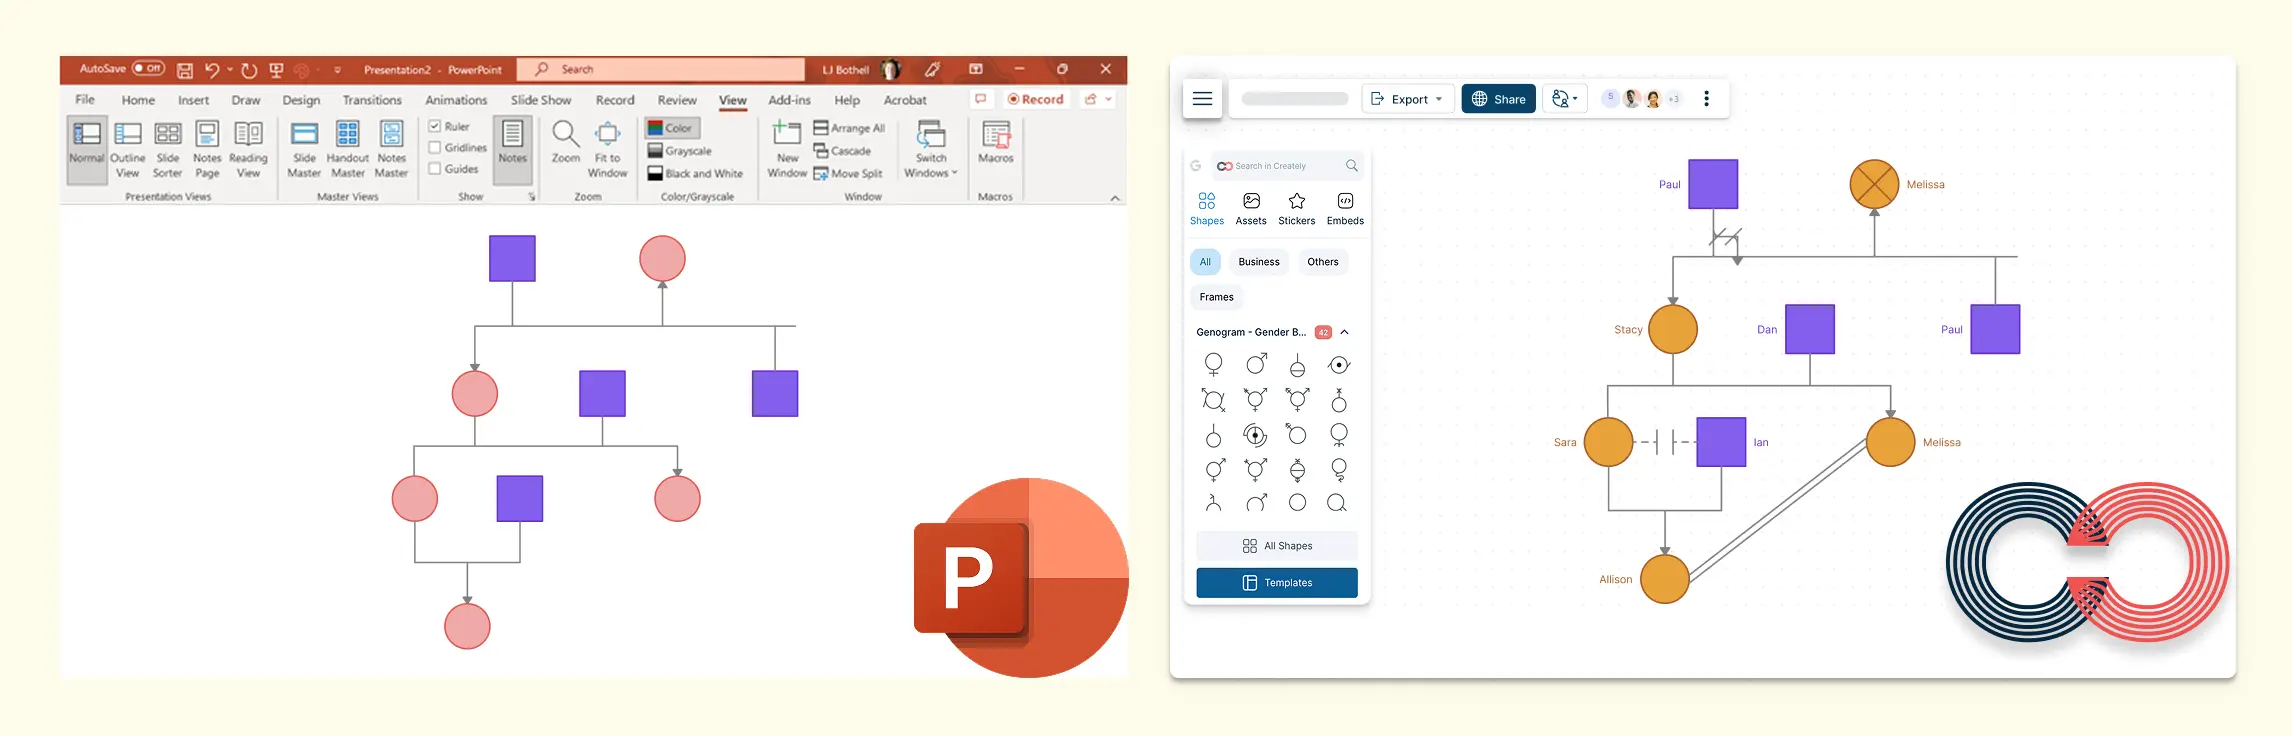
Frustrated with the limitations of PowerPoint for genogram creation? You’re not alone. While PowerPoint is a go-to tool for presentations, it falls short when it comes to creating detailed genograms. The lack of specialized symbols, templates, and easy-to-use features makes it a challenge to build accurate and scalable family diagrams. In this guide, we’ll show you how to make a genogram in PowerPoint, highlight its limitations, and explain why Creately is a better alternative for creating professional, customizable, and easily editable genograms.
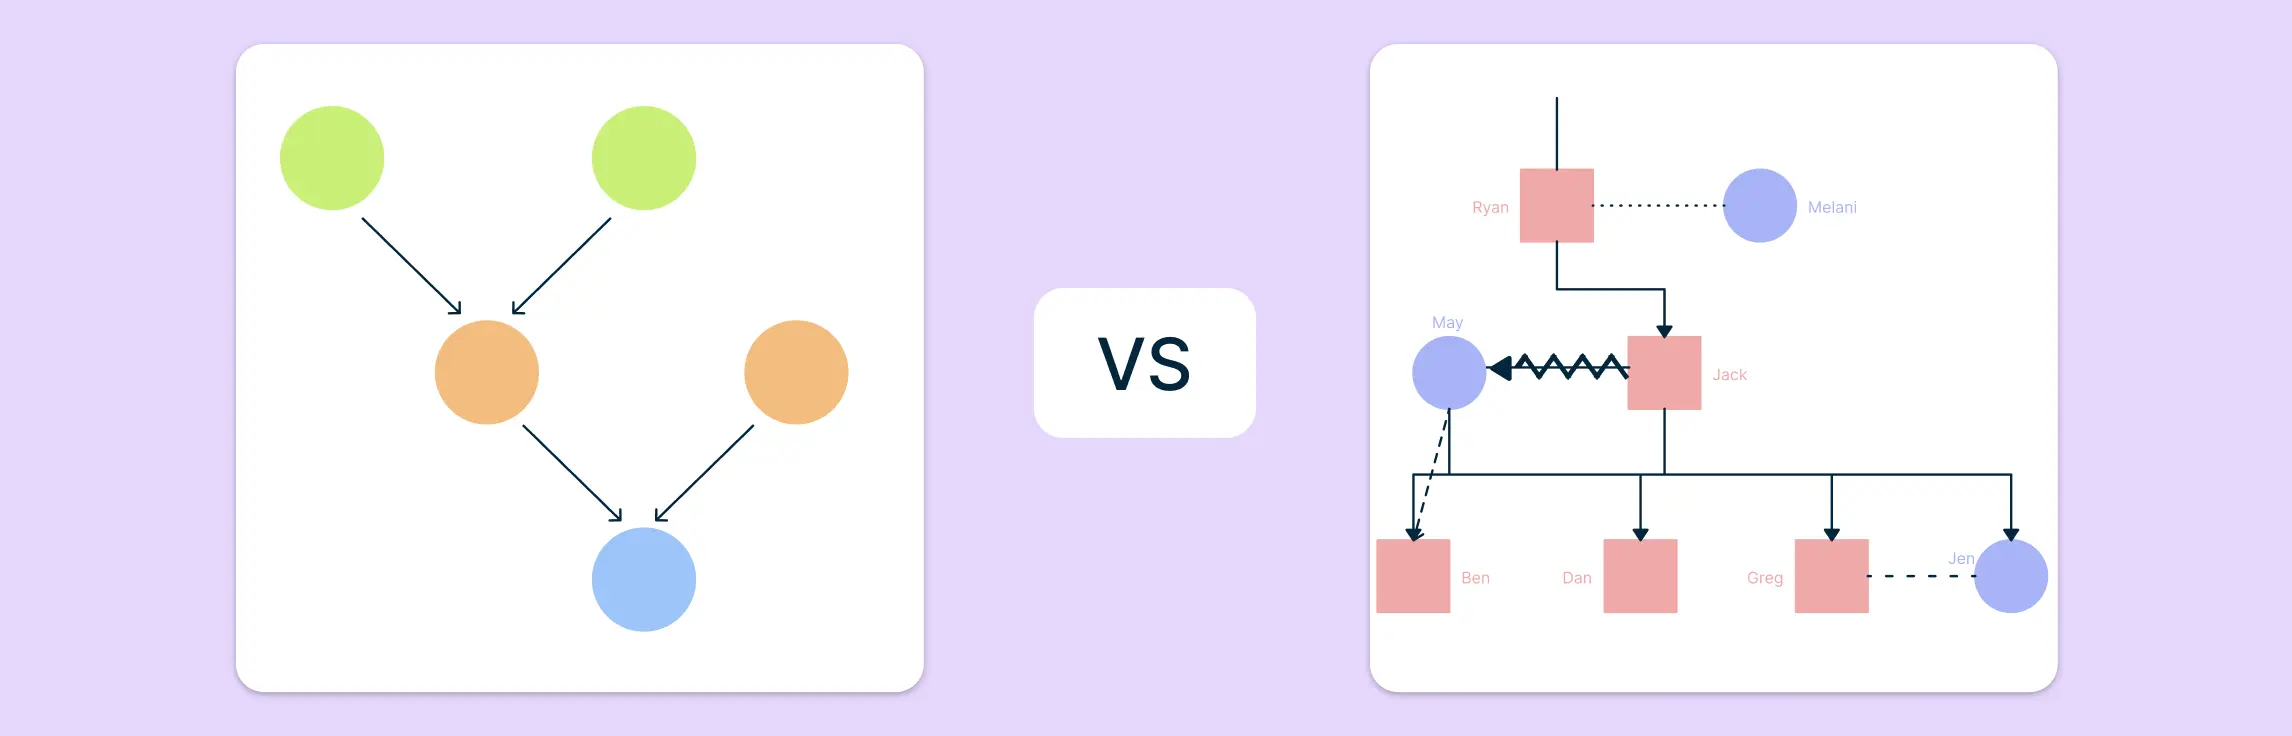
Understanding your family’s history is more than a pursuit of names and dates; it’s about uncovering the narratives and connections that have shaped your lineage. Two primary tools facilitate this exploration: genogram and family tree diagrams. While both serve to chart familial relationships, they differ in scope and application.
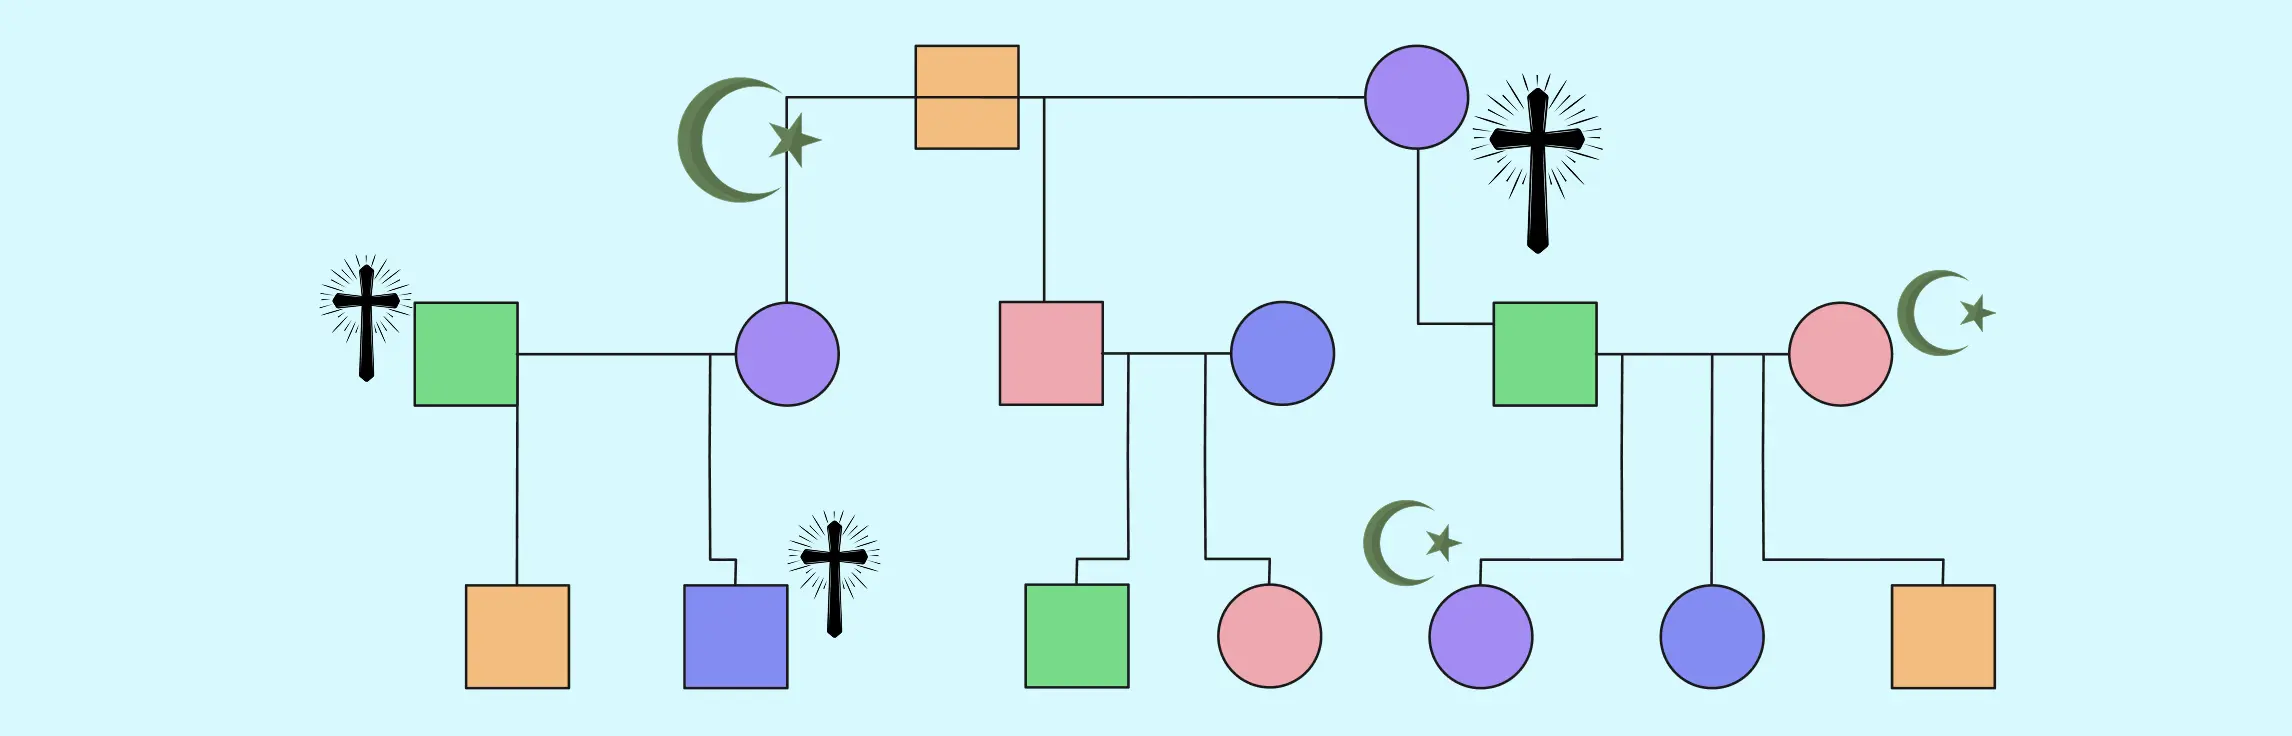
Understanding the spiritual journeys of individuals and families can provide valuable insight into how faith, beliefs, and traditions shape our lives. One powerful tool for mapping this journey is the spiritual genogram—a multigenerational diagram that tracks the religious, spiritual, and emotional experiences that define family histories.
A creative genogram is a dynamic and visually engaging way to map family histories, emotional relationships, and generational patterns. Unlike traditional genograms, which focus primarily on lineage and medical history, creative genograms incorporate colors, symbols, and other elements to provide a deeper understanding of family dynamics and emotional connections.
Genograms are powerful visual tools that help map relationships, hereditary patterns, and social dynamics across generations. Understanding the types of genograms is essential for professionals in healthcare, psychology, counseling, and career planning, as well as individuals looking to explore their family history. This guide delves into different types of genograms, including family genograms, medical genograms, career genograms, and relationship genograms, highlighting their unique uses and significance.
Learning can feel overwhelming when there’s too much information to process. That’s where creative concept maps come in! They help organize thoughts visually, making it easier to understand and remember complex ideas.
Concept map graphic organizers help students and teachers turn complex ideas into clear, visual structures. They make learning more engaging, help with problem-solving, and improve memory by showing connections between concepts. Whether you’re a student organizing your thoughts or a teacher planning lessons, these concept map graphic organizers can make information easier to understand. In this guide, you’ll find a variety of concept map graphic organizer templates designed to simplify learning and teaching.
Biology is full of fascinating ideas, but sometimes, all the terms and concepts can feel overwhelming. That’s where biology concept maps come in! A concept map is a simple yet powerful tool that helps you see how different biology topics connect. Instead of just memorizing facts, you’ll be able to understand how things fit together—like how photosynthesis fuels life or how DNA determines our traits.
Learning new topics can sometimes feel overwhelming, especially when there’s a lot of information to remember. That’s where concept maps come in. A concept map is a visual tool that helps students organize ideas, see connections, and understand subjects more clearly. Instead of just reading or memorizing facts, concept maps allow students to break down complex information into smaller, easier-to-understand parts.
Learning can sometimes feel overwhelming, especially when there’s a lot of information to process. That’s where concept maps in education come in. A concept map is a simple yet powerful tool that helps students and teachers organize ideas, connect key concepts, and make learning more meaningful.
Have you ever felt overwhelmed by too many ideas or struggled to see how different concepts connect? Whether you’re studying for a test, planning a project, or brainstorming new ideas, organizing your thoughts can be challenging. That’s where concept maps ideas come in.
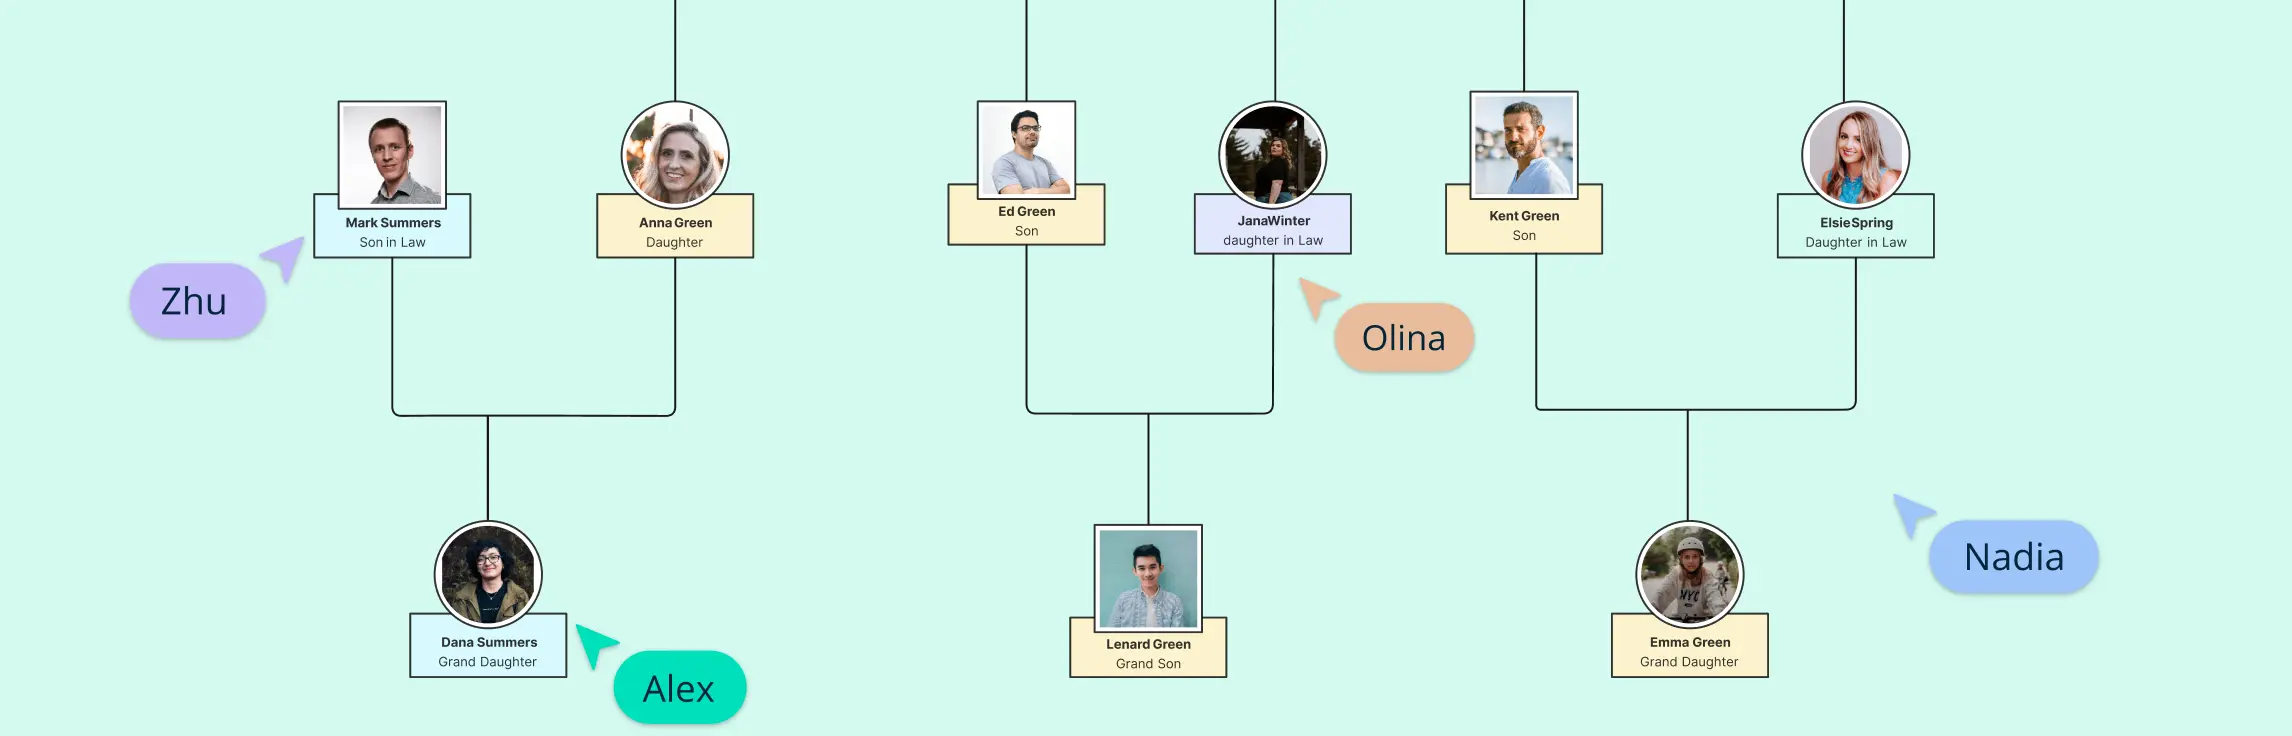
Looking for practical family genogram examples to help map your family’s structure, relationships, and health history? Whether you are charting a modern family genogram, exploring an extended family genogram, or creating a family health history genogram, this guide gives you editable templates to get started. Use these examples to uncover generational patterns and build a clearer picture of your family tree.
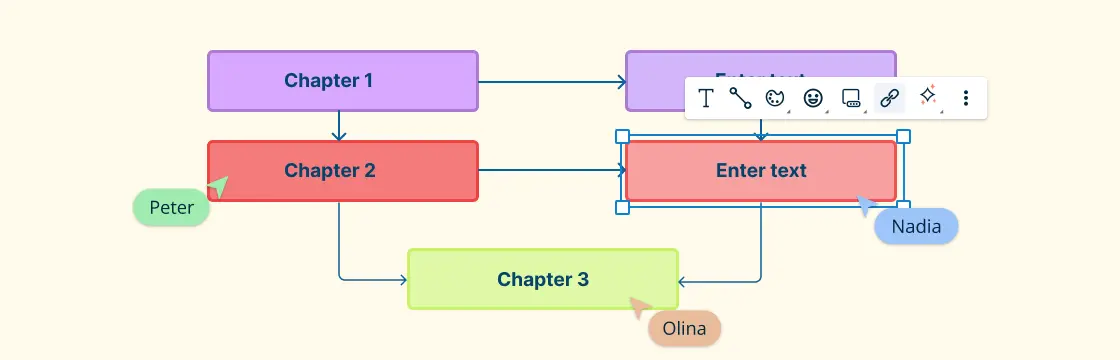
A genogram is a visual representation of family relationships and dynamics, often used to analyze hereditary patterns, psychological traits, and character development. In fiction, genograms help writers, researchers, and fans understand the complex relationships within stories, revealing generational conflicts, inherited traits, and hidden connections that shape a character’s journey.
Understanding family history and dynamics is crucial in therapy, and genograms provide a powerful way to visualize these connections. This guide explores how to use genograms in therapy to identify generational patterns, unresolved trauma, and emotional influences on mental health. You’ll discover 10 different types of therapy-focused genograms, their benefits, and how they help therapists create personalized treatment plans.
This guide explores different types of 6-member family tree templates, helping you visualize family relationships across generations and blended family structures. Whether you’re mapping parents, children, grandparents, or extended family members, these templates offer a structured way to preserve and share your family history. Plus, learn how Creately makes building and customizing your family tree simple and collaborative.
This guide explores the concept of a 4 Members Family Tree, providing various templates and formats to help you visualize family relationships clearly. Whether you’re looking for a simple structure, an illustrated version, or a unique circular layout, this guide covers different family tree designs suited for genealogy, heritage projects, or personal documentation. Additionally, it highlights how Creately simplifies the process with collaborative tools and customizable templates, making it easy to create and share your family tree effortlessly.
A 5 Members Family Tree visually represents relationships within a five-member family. This guide covers different templates for various family structures and how Creately simplifies creating and sharing them.
In today’s fast-paced digital world, organizations generate vast amounts of knowledge daily. However, without a structured approach to managing this knowledge, valuable insights can be lost, leading to inefficiencies and missed opportunities. Knowledge management is the systematic process of capturing, organizing, sharing, and utilizing information to enhance decision-making, innovation, and overall business performance.
A graphic organizer is a simple yet powerful tool that helps you visually arrange information, making it easier to understand and organize ideas. Think of it as a map for your thoughts—whether you’re planning a project, studying for a test, or brainstorming new ideas.
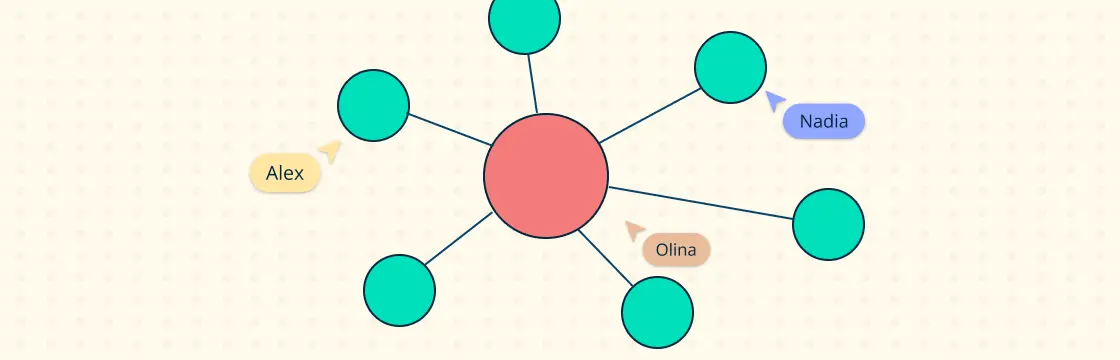
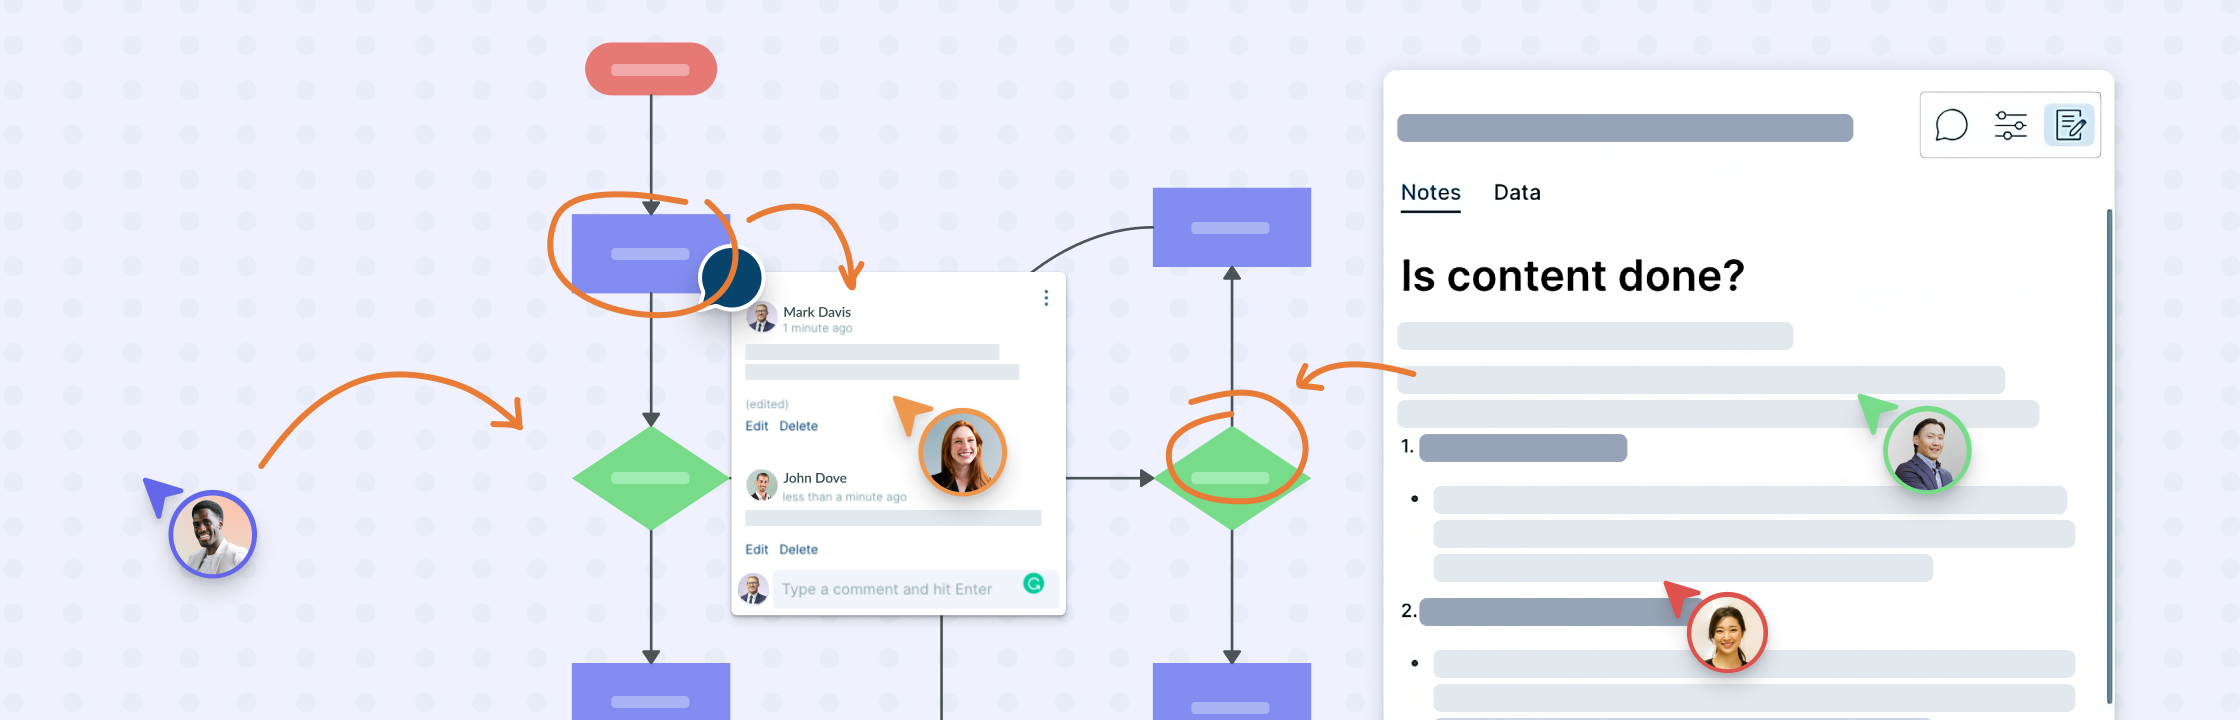
The Knowledge Management process involves capturing, organizing, sharing, and utilizing knowledge within an organization to enhance decision-making, innovation, and efficiency. An effective KM process eliminates silos, reduces redundancies, and fosters collaboration, driving productivity and a culture of continuous learning. A visual collaboration tool like Creately simplifies KM by providing intuitive visual solutions, such as flowcharts and knowledge maps, to capture and share information seamlessly. By making knowledge accessible and actionable, Creately helps organizations transform scattered insights into a cohesive, collaborative resource for improved performance.
In today’s rapidly evolving business landscape, effective knowledge management (KM) is crucial for driving innovation, improving efficiency, and enhancing decision-making. At the core of a successful KM strategy is the understanding that not all knowledge is the same. Knowledge within an organization can take many forms, from structured data and documented processes to personal expertise and intuitive insights. To harness the full potential of knowledge, organizations must recognize and manage different types of knowledge effectively.
Knowledge management (KM) is a systematic approach to capturing, organizing, sharing, and analyzing an organization’s knowledge to enhance its overall efficiency and effectiveness. It involves leveraging organizational knowledge as a strategic asset to improve decision-making, collaboration, and innovation. In this comprehensive guide, we delve into the definition, process, examples, strategies, and best practices associated with knowledge management.
A brace map is a powerful visual tool that helps break down complex concepts into smaller, manageable parts. Whether you’re in education, business, or problem-solving, brace maps allow you to clearly understand relationships by visualizing components in a structured way. In this guide, we’ll dive into what a brace map is, how to create one, and how you can use brace maps to organize your thoughts and ideas. Let’s explore how this tool can enhance your workflow with Creately’s versatile platform.
Have you ever wondered why some kids inherit their mother’s curly hair while others take after their father’s straight hair? The answer lies in genetics—the science of how traits are passed down from parents to their children.
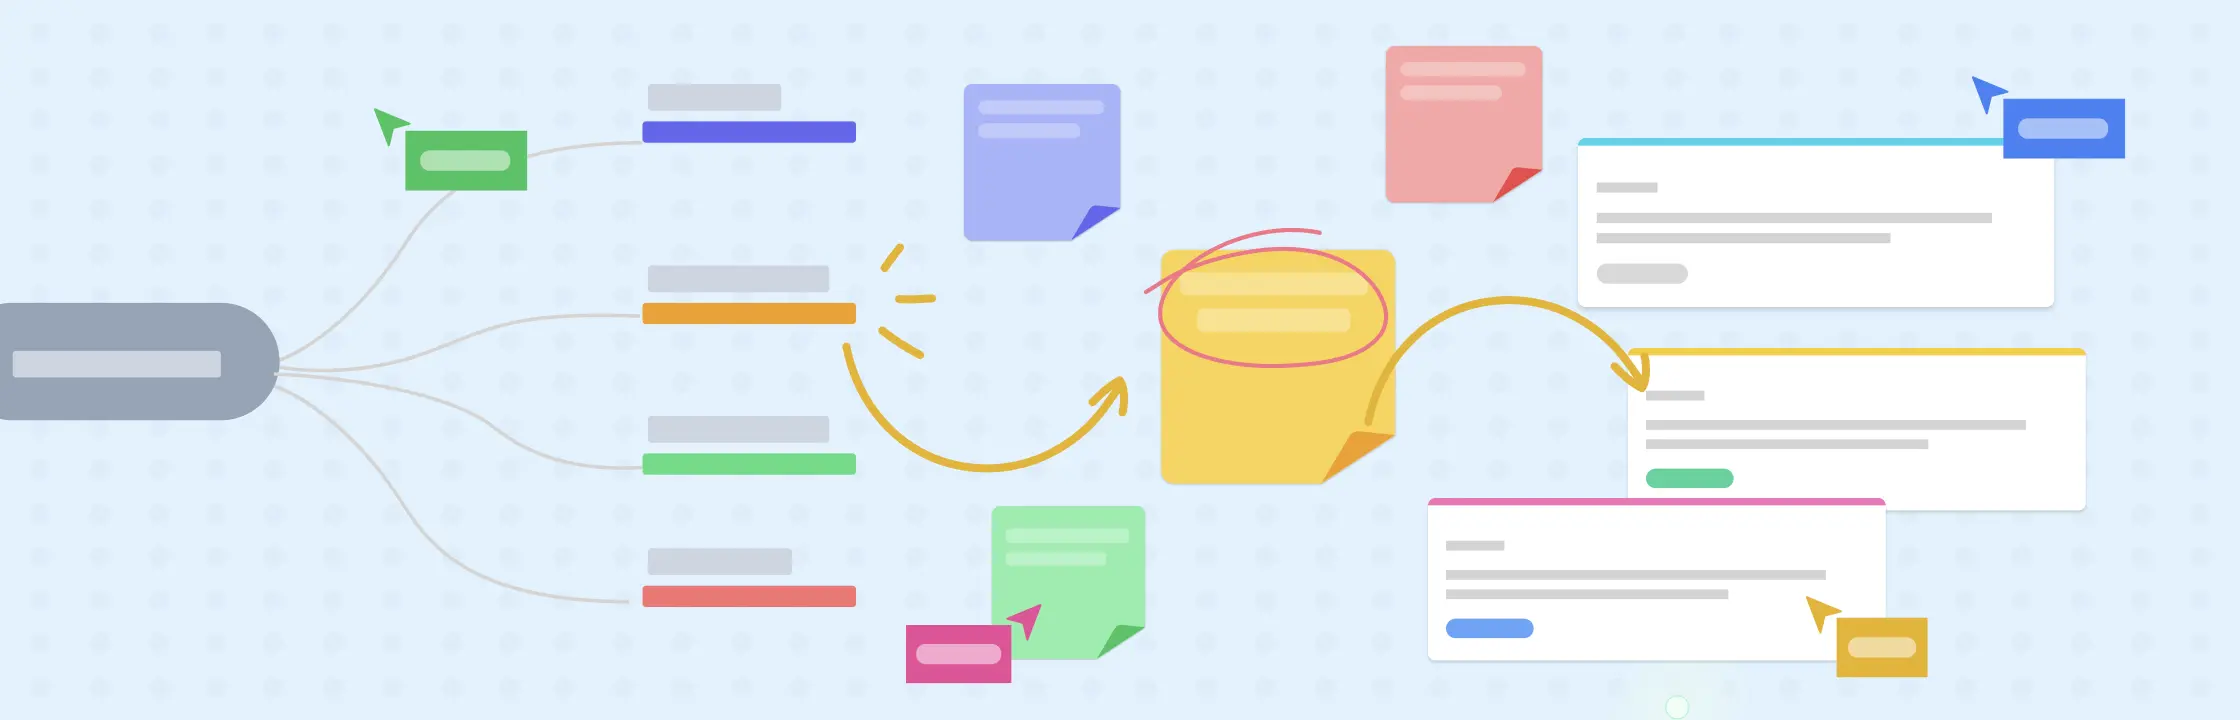
Have you ever felt overwhelmed by information? Or struggled to connect the dots between what you know and what you need to do? That’s where knowledge mapping comes in. Think of it as a way to visually organize your ideas, information, and insights into one easy-to-follow map.
We’ve all been there - sitting in meetings where ideas seem to fly past each other, or watching as crucial details get lost in a sea of emails and chat messages. It’s not uncommon to leave a brainstorming session feeling more confused than when you started, wondering if everyone is truly on the same page. The challenges of aligning diverse perspectives, capturing complex ideas, and reaching consensus can leave even the most seasoned professionals feeling frustrated. But what if there was a way to visually map out our collective thoughts, ensuring every voice is heard and every idea is captured? What if we could transform those chaotic discussions into clear, actionable plans? Enter the world of dialogue mapping - a powerful tool that’s revolutionizing how teams communicate and solve problems together.
Studying effectively is a challenge many students face, especially when dealing with large volumes of information. A mind map for studying offers a powerful solution by turning complex concepts into visually organized diagrams. This technique not only enhances understanding but also improves memory retention and encourages creative thinking. Whether you’re preparing for exams, brainstorming essay ideas, or grasping intricate theories, mind mapping can transform your study routine. In this guide, we’ll explore what a mind map for studying is, its benefits, and how to create one step-by-step. Plus, you’ll discover practical templates and tools to integrate mind mapping into your academic journey.
In a world where understanding the connections between causes and effects is vital for decision-making and learning, Multi Flow Maps emerge as an invaluable tool. These visual diagrams bring clarity to complex systems, offering a structured way to unravel the relationships that drive events, processes, or outcomes. Whether you’re a student exploring the intricacies of a historical event, a teacher simplifying challenging concepts, or a professional refining strategies, Multi-Flow Maps transform abstract ideas into tangible insights.
Designing an inclusive curriculum that addresses the diverse learning needs of students is a key challenge for modern educators. Every student has a unique way of processing information, whether they respond better to visual aids, auditory input, hands-on activities, or independent learning. The traditional one-size-fits-all approach to education often fails to engage all learners effectively.
In an era where educational paradigms are rapidly evolving, understanding and implementing effective learning methodologies has become more crucial than ever. The digital revolution has transformed how we process and absorb information, making visual learning a cornerstone of modern education. As our world becomes increasingly visual-centric, with information constantly bombarding us through screens, graphics, and multimedia, the ability to learn through visual means has evolved from a preference to a necessity. This shift in learning dynamics calls for a deeper understanding of visual learning methodologies and their implementation in educational settings. By exploring the intricate relationship between visual perception and cognitive processing, we can better appreciate how visual learning styles and strategies can revolutionize education, making it more accessible, engaging, and effective for learners of all ages and backgrounds.
Mind mapping is a creative way to take notes that helps you visualize and organize information clearly and effectively. It’s different from traditional note-taking because it makes use of branches and visuals, making it easier to understand and remember what you’ve learned. This guide will show you how to use mind maps for note-taking, and provide practical steps, templates, and useful tips to get started.
In a world where customer expectations are constantly evolving, businesses must understand the nuances of user interactions. This is where experience mapping comes into play. By visualizing and analyzing each stage of the user journey, organizations can gain valuable insights into customer needs, pain points, and opportunities for improvement. The result? Enhanced customer experiences that drive satisfaction, loyalty, and business growth.
In today’s fast-paced world, understanding the complexity of systems—whether in business, project management, or other—can make all the difference in decision-making. That’s where Causal Loop Diagrams (CLDs) come into play. These diagrams are powerful tools for illustrating how variables within a system interrelate through feedback loops, offering a holistic view of the intricate web of cause-and-effect relationships. This guide will walk you through everything you need to know about CLDs: how to create them, real-world applications, things to consider, and their benefits.
In a world teeming with ideas and information, organizing thoughts can often be a herculean task. Enter the Idea Wheel - a versatile graphic organizer designed to simplify the brainstorming process. By presenting ideas in a visually segmented manner, the Idea Wheel combines the essence of both spider maps and circle maps, fostering creativity and structured thinking.
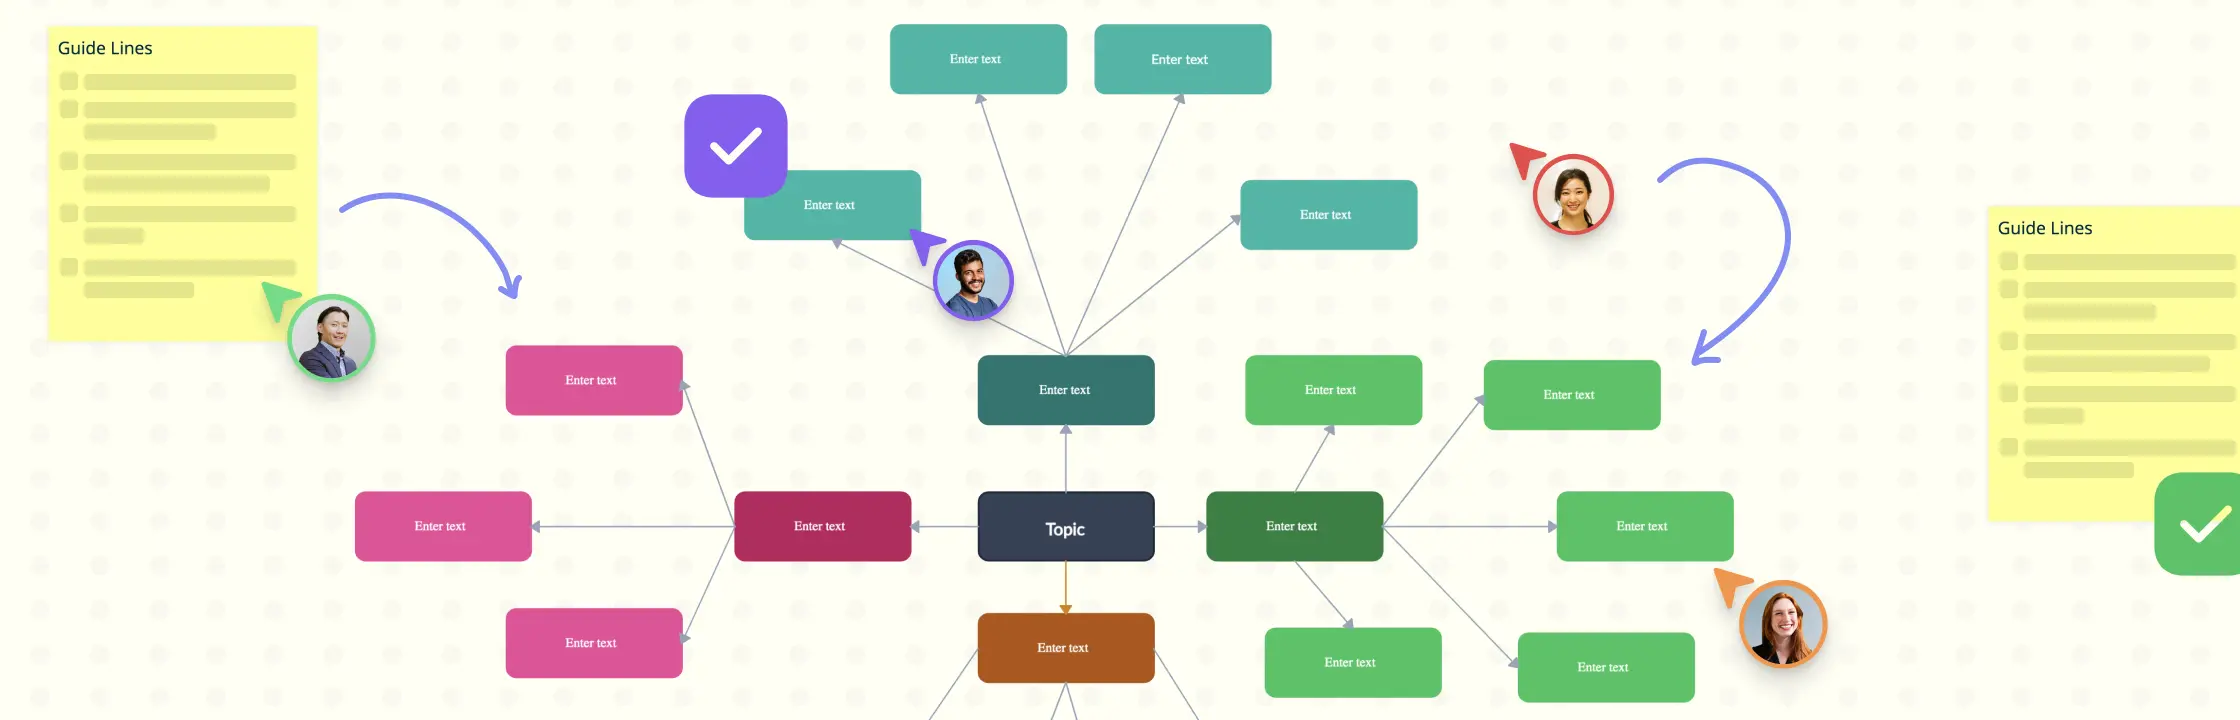
Mind maps are a simple yet powerful way to organize thoughts and ideas visually. They help you brainstorm, plan, and problem-solve by mapping out information around a central theme. Whether you’re a student, professional, or creative, mind maps make complex topics easier to understand and remember. This guide explores what mind maps are, their history, key features, benefits, and practical uses.
If you’ve already read our previous guide on what a mind map is, you know how useful this tool can be for organizing thoughts and ideas. In this guide, we’ll walk you through the straightforward steps on how to make a mind map. Whether you’re planning a project, brainstorming ideas, or studying for an exam, this guide will help you use mind maps effectively. Let’s get started!
Mind mapping is a powerful tool that helps you organize your thoughts, solve problems, and boost creativity. Whether you’re brainstorming ideas, planning a project, or studying a complex topic, mind mapping makes it easier to break down information and see connections between ideas. In this guide, we’ll explore different mind mapping techniques that can help you think more clearly and work more efficiently. You’ll learn how to structure your thoughts visually, making complex tasks simpler and improving your productivity. By the end, you’ll be able to apply these techniques in various situations, from personal projects to professional work.
Collaboration skills are essential for workplace efficiency and team synergy. They encompass a wide range of abilities that enable individuals to work effectively together towards achieving a common goal. Mastering these skills is crucial in today’s dynamic work environment, where teamwork and cooperation are often the keys to success.
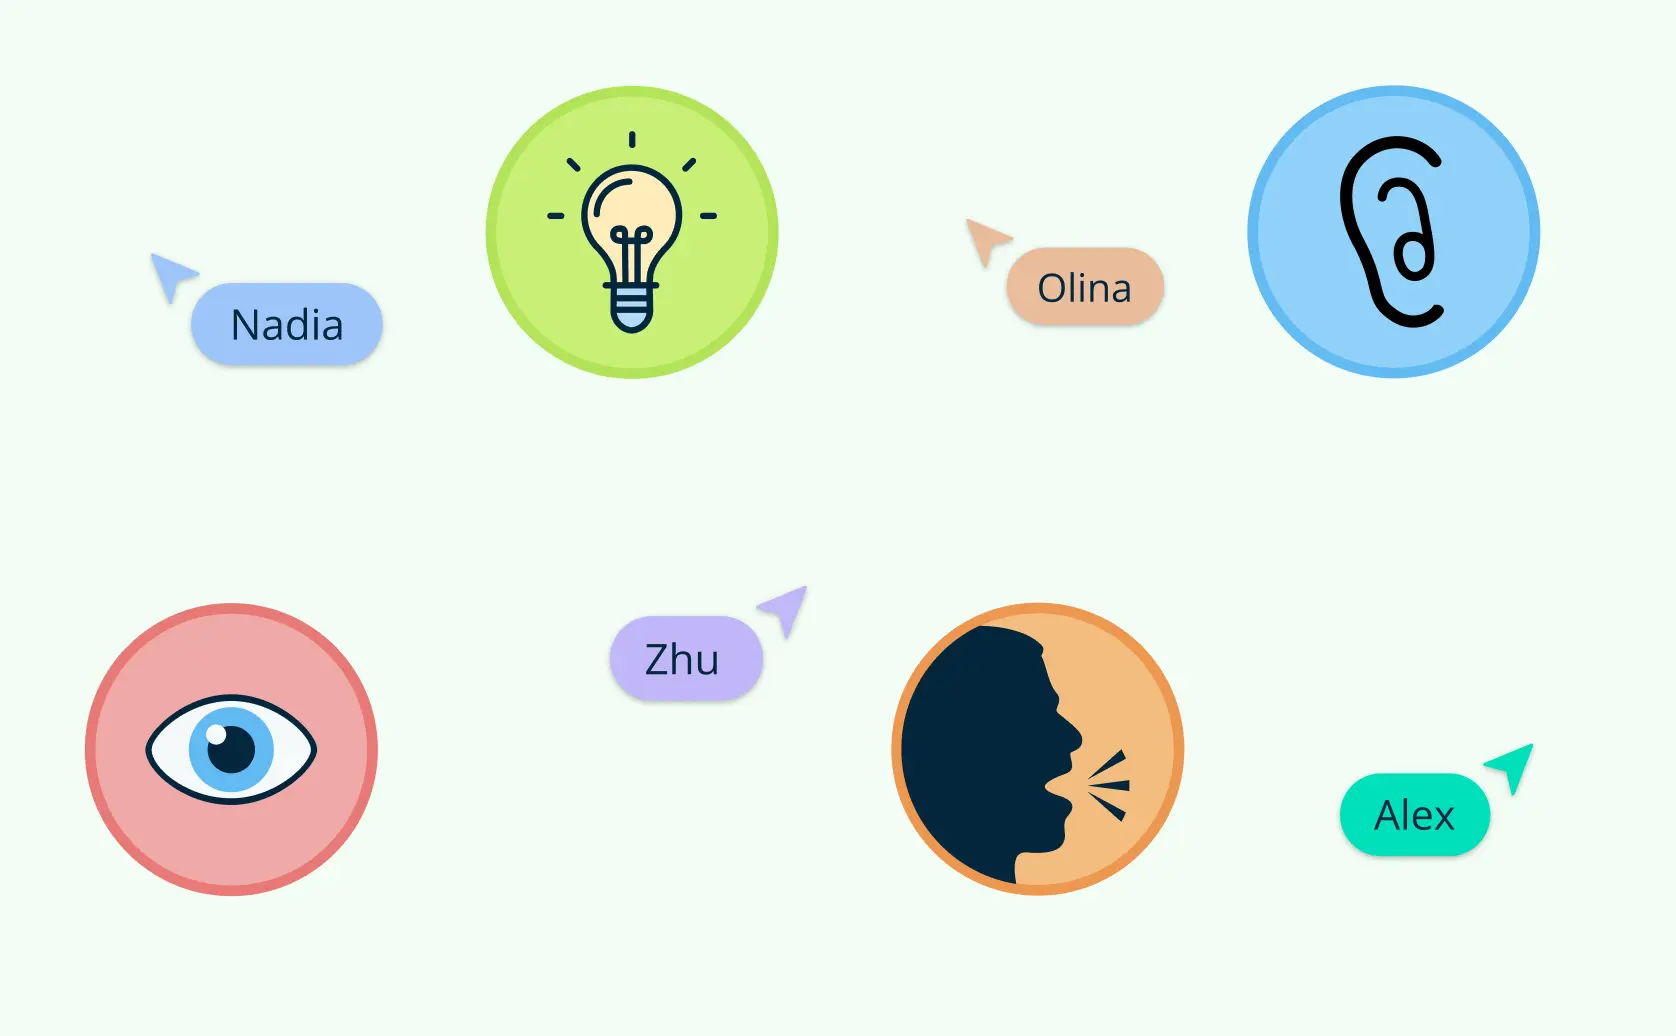
Understanding Types of Communication Communication is the exchange of information, ideas, or feelings, essential for human interaction and relationship-building. It plays a vital role in personal and professional success. The main types of communication include verbal, nonverbal, written, visual, and listening, each with unique purposes and benefits.
Collaborative learning is all about students working together to achieve shared goals. It’s not just about group work—it’s about meaningful interaction that helps students learn better. When students collaborate effectively, they engage more with the material and with each other, which leads to better outcomes for everyone. This guide will show you how to use collaborative learning strategies to improve classroom interaction and make learning more engaging and effective.
Have you ever found yourself staring at a blank page, struggling to organize your thoughts for a crucial presentation or a compelling essay? We’ve all been there. Whether you’re a student trying to ace that debate class, a professional aiming to win over clients, or an activist hoping to inspire change, the art of persuasion can sometimes feel like an elusive skill.
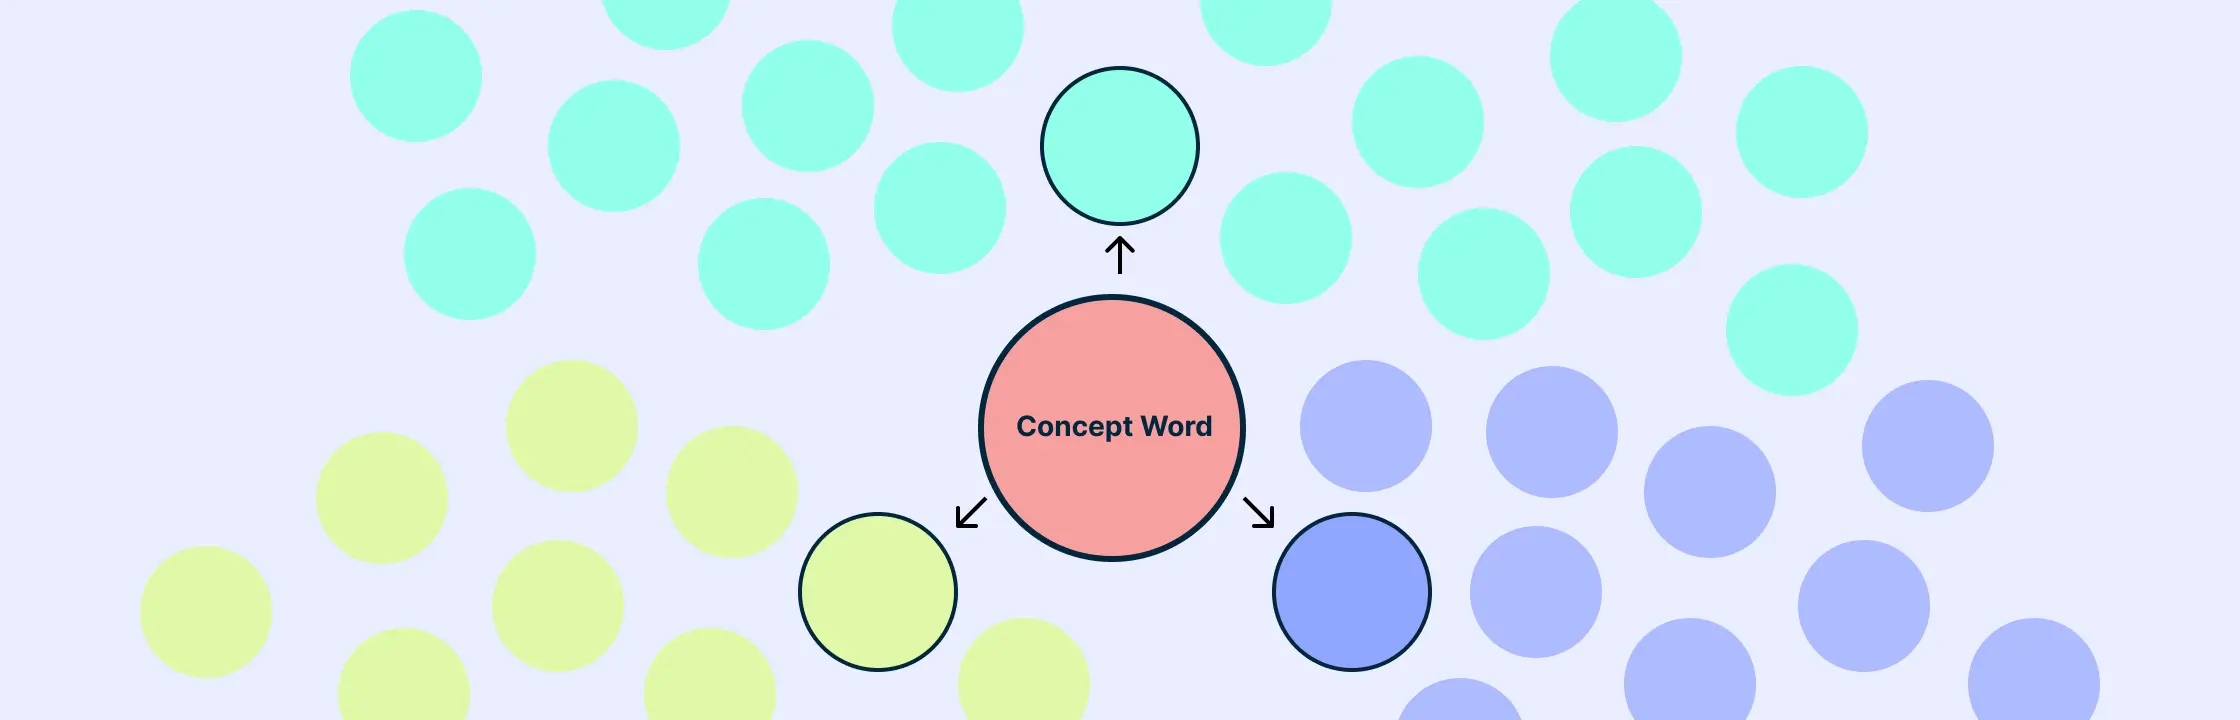
In a world where ideas are constantly evolving, finding the right tools to organize and clarify your thoughts is crucial. One such tool that has proven invaluable in both educational and professional settings is the Circle Map. Whether you’re brainstorming, problem-solving, or simply trying to visualize complex data, Circle Maps offer a structured way to capture and expand on your ideas. This blog post delves into the fundamentals of Circle Maps, breaking down their components and offering practical guidance on how to create and use them effectively. Dive in to discover how this simple yet powerful tool can enhance your thinking and communication processes.
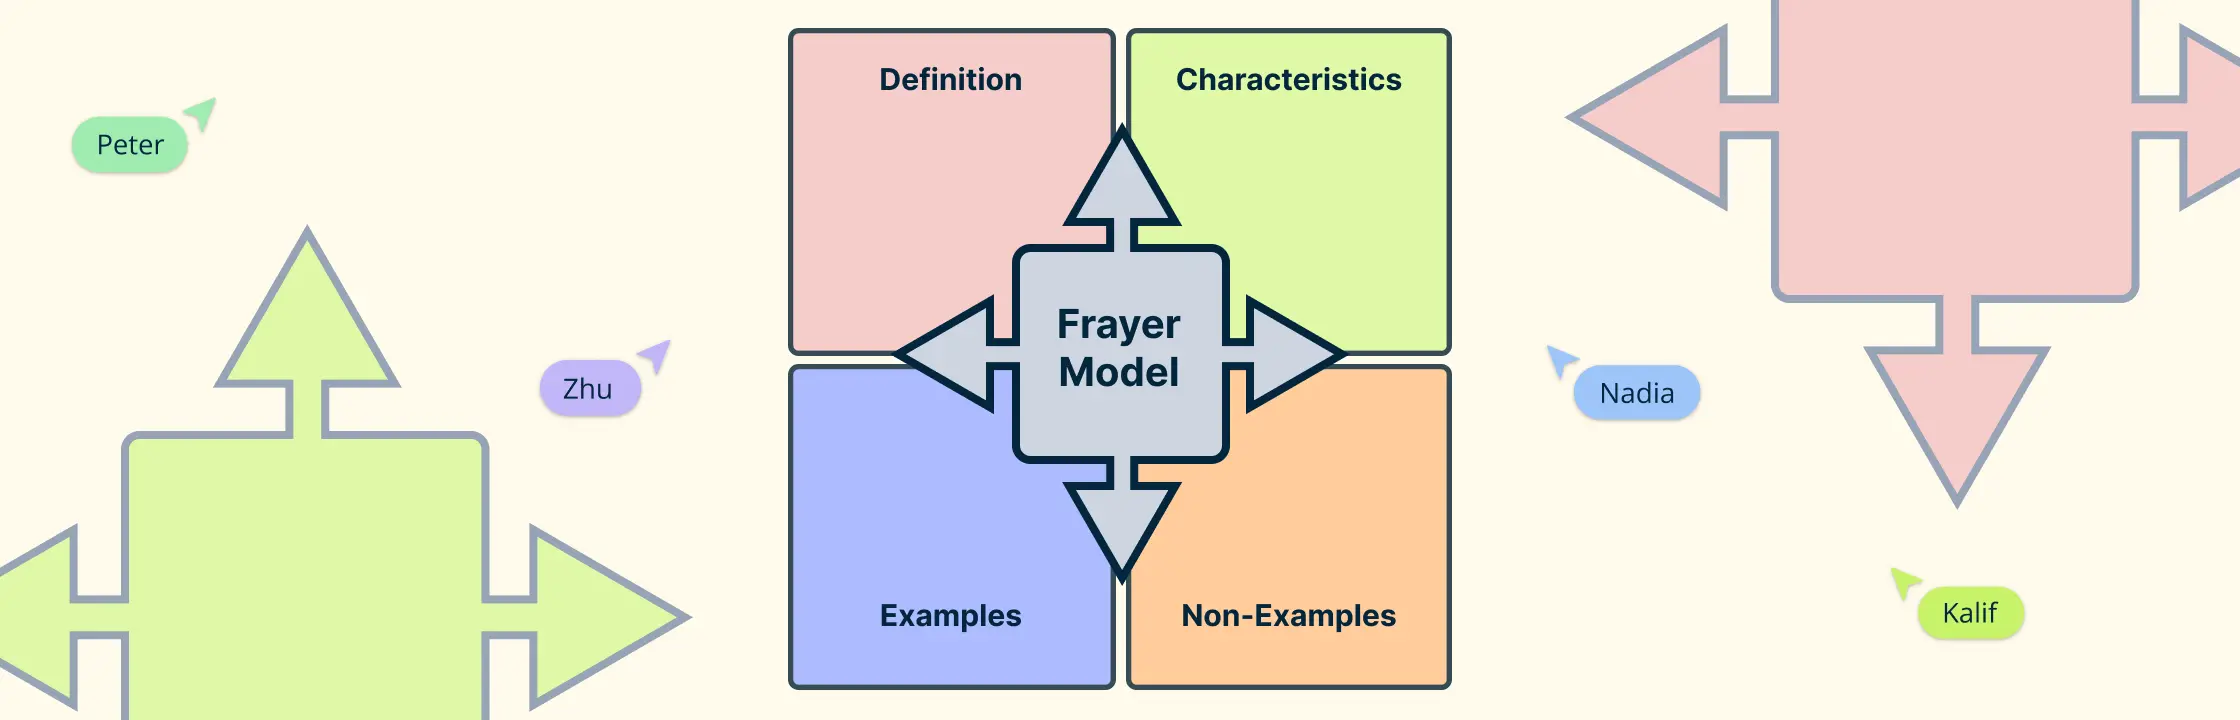
In the ever-evolving landscape of education, finding effective strategies to teach remains a persistent challenge. If you’ve ever witnessed students struggle to grasp new terms or retain complex concepts, you’re not alone. Fortunately, there’s a powerful tool at our disposal that can transform how we approach vocabulary instruction: the Frayer Model.
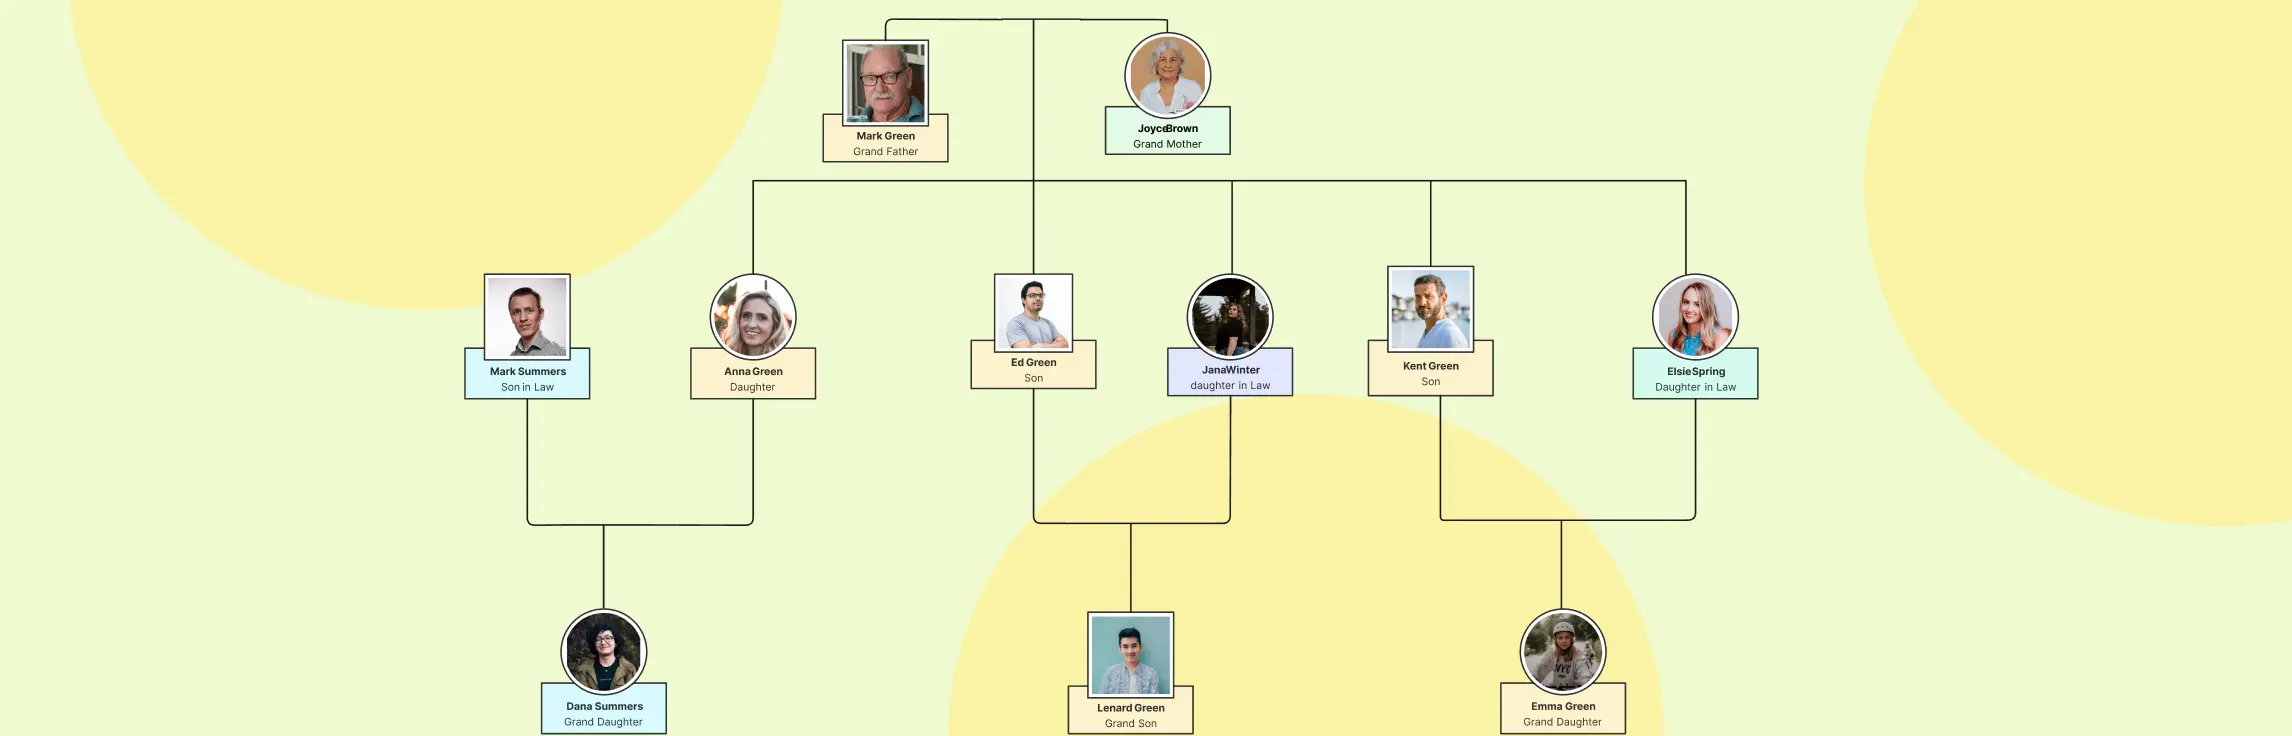
What is a Family Tree? A family tree is a diagram that visually represents a person’s lineage by tracing their ancestry and showing the relationships between various family members over multiple generations. This graphical illustration helps understand how families are interconnected, charting a visual journey through time to display familial relationships. From a simple sketch on paper to detailed digital renderings, family trees can vary greatly in complexity.
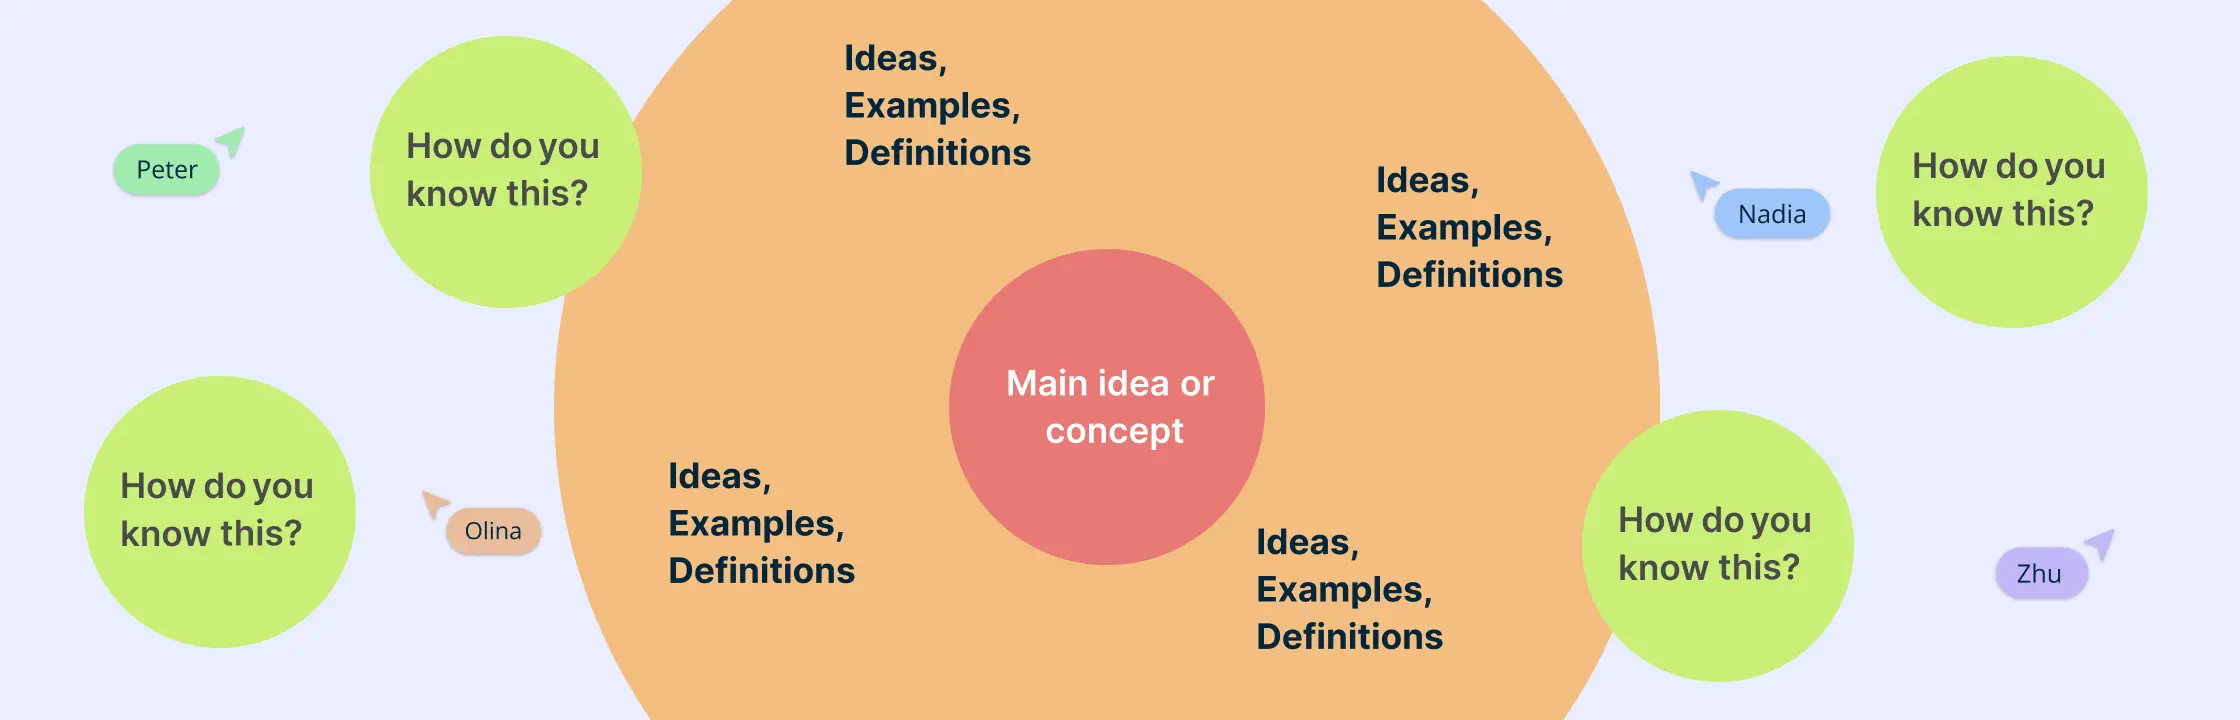
What is a Semantic Map A semantic map is a graphic organizer that visually represents relationships between concepts, words, and ideas. Primarily used in educational settings, semantic maps help students and educators alike by clarifying connections and fostering a deeper understanding of new information. The fundamental purpose of semantic mapping is to link new knowledge to existing knowledge, making it an essential tool for vocabulary acquisition, comprehension, and critical thinking.
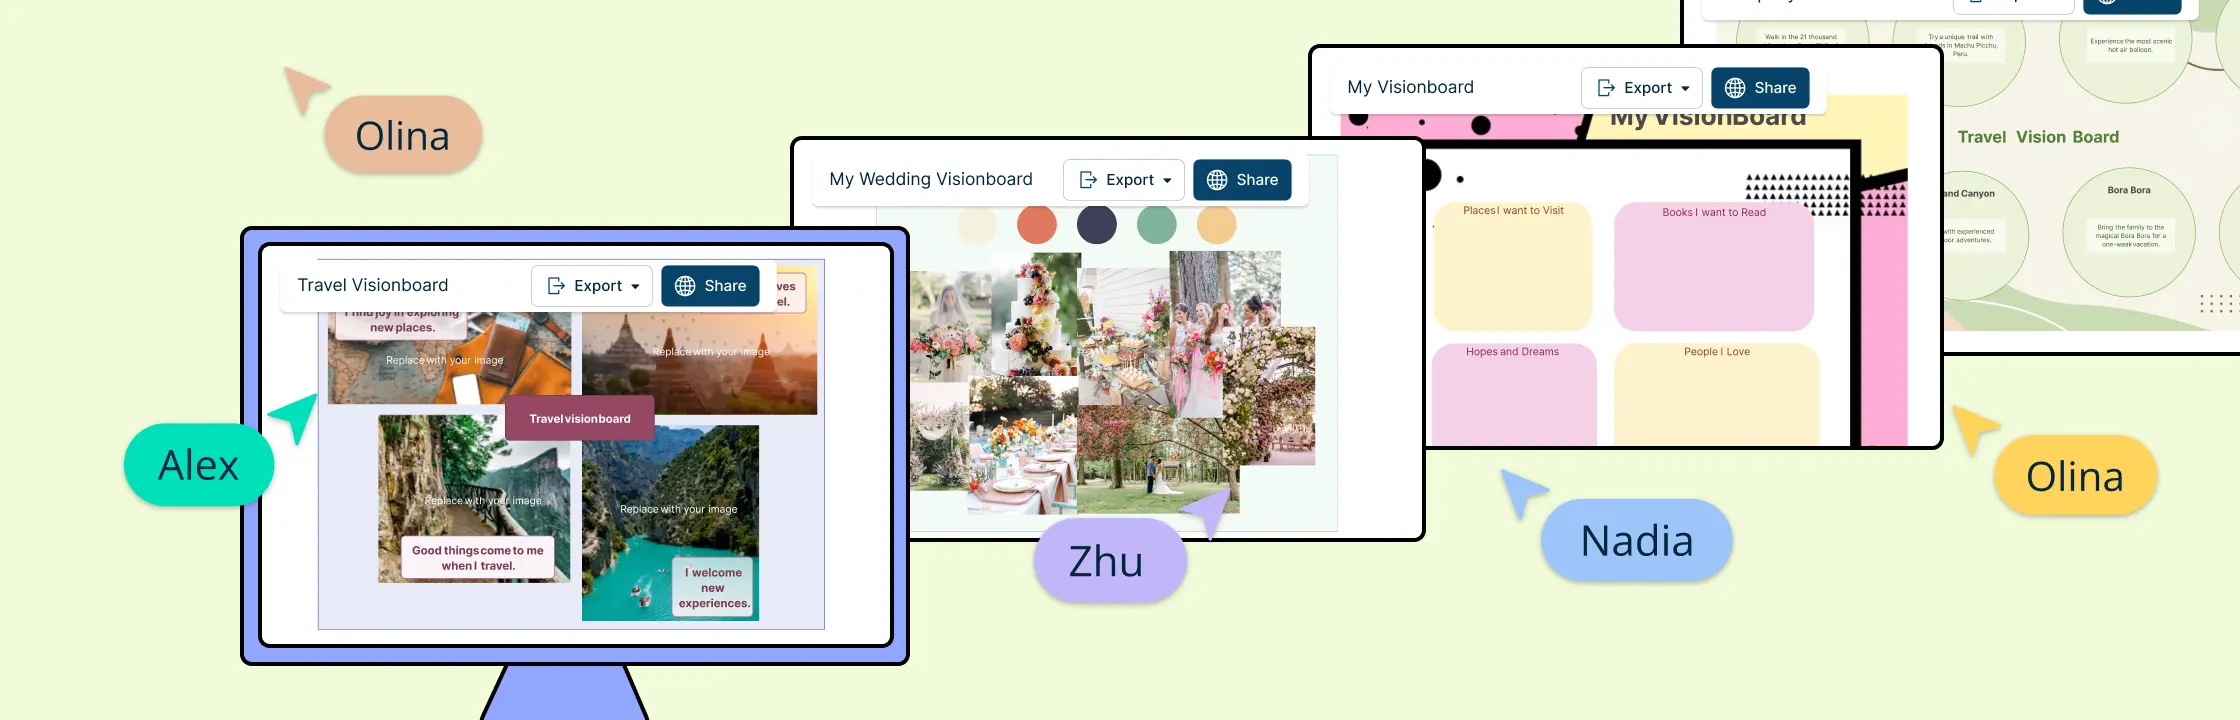
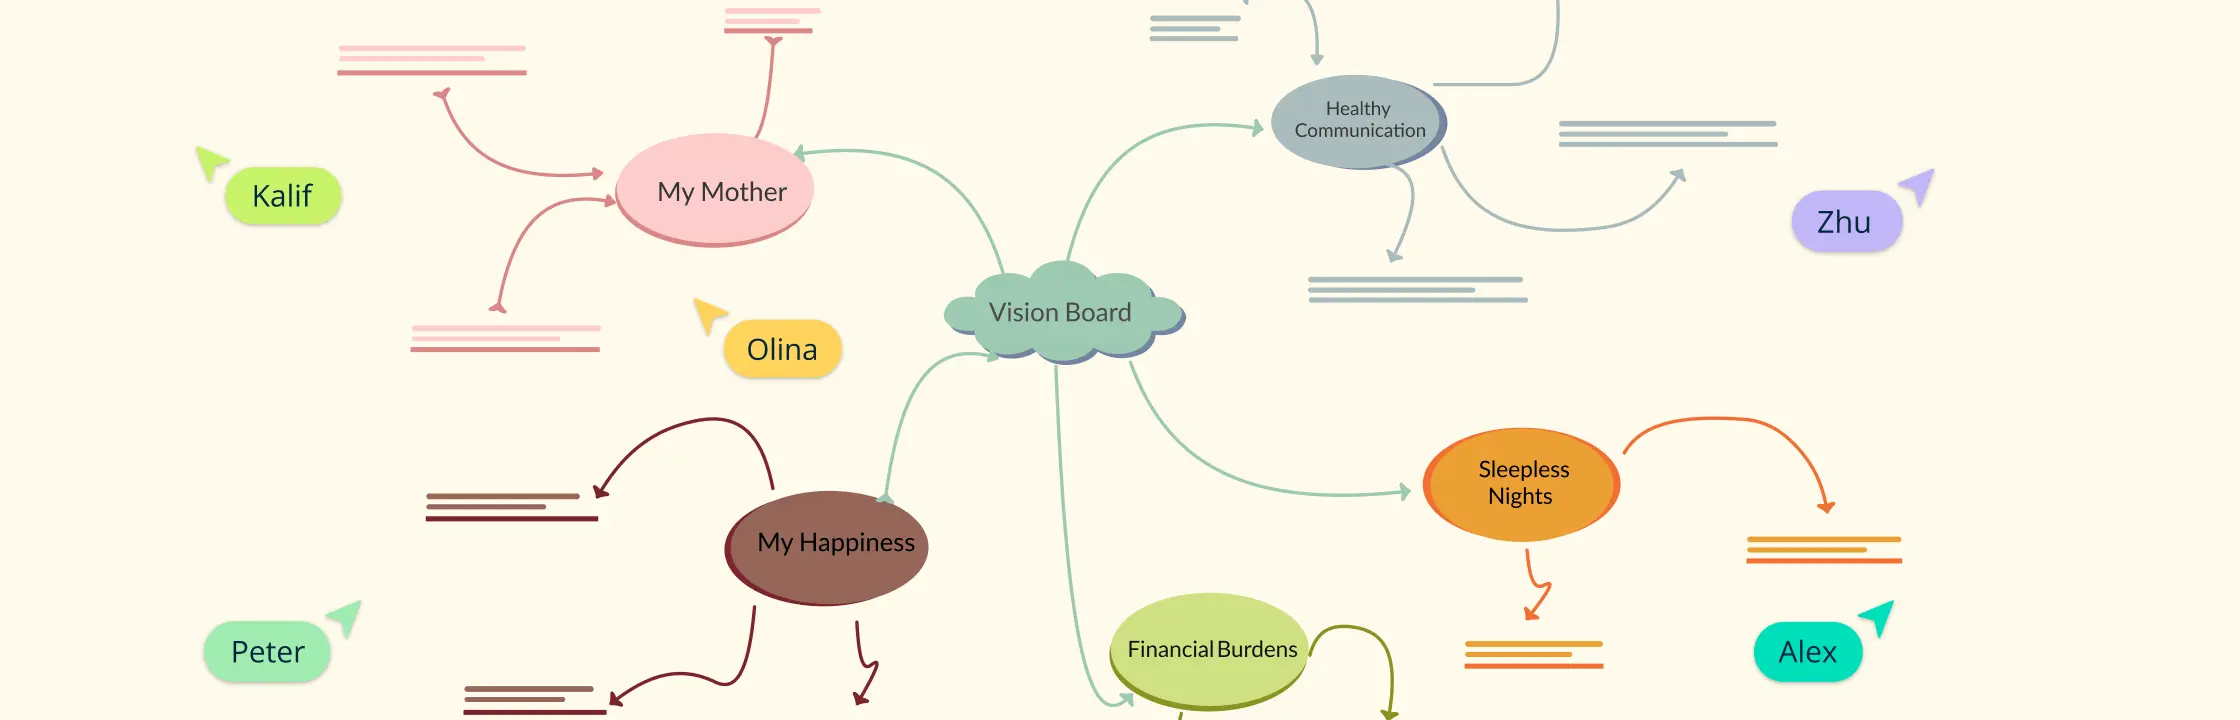
A vision board is a powerful tool for turning your dreams into reality. By gathering images, quotes, and reminders, you keep your goals in sight and stay motivated. In this guide, you’ll find 40 unique vision board ideas to inspire and help you achieve your dreams. From travel and career goals to personal wellness and creative projects, these ideas will help you create a vision board that motivates and guides you on your journey. Let’s explore how to bring your aspirations to life with these simple and effective concepts.
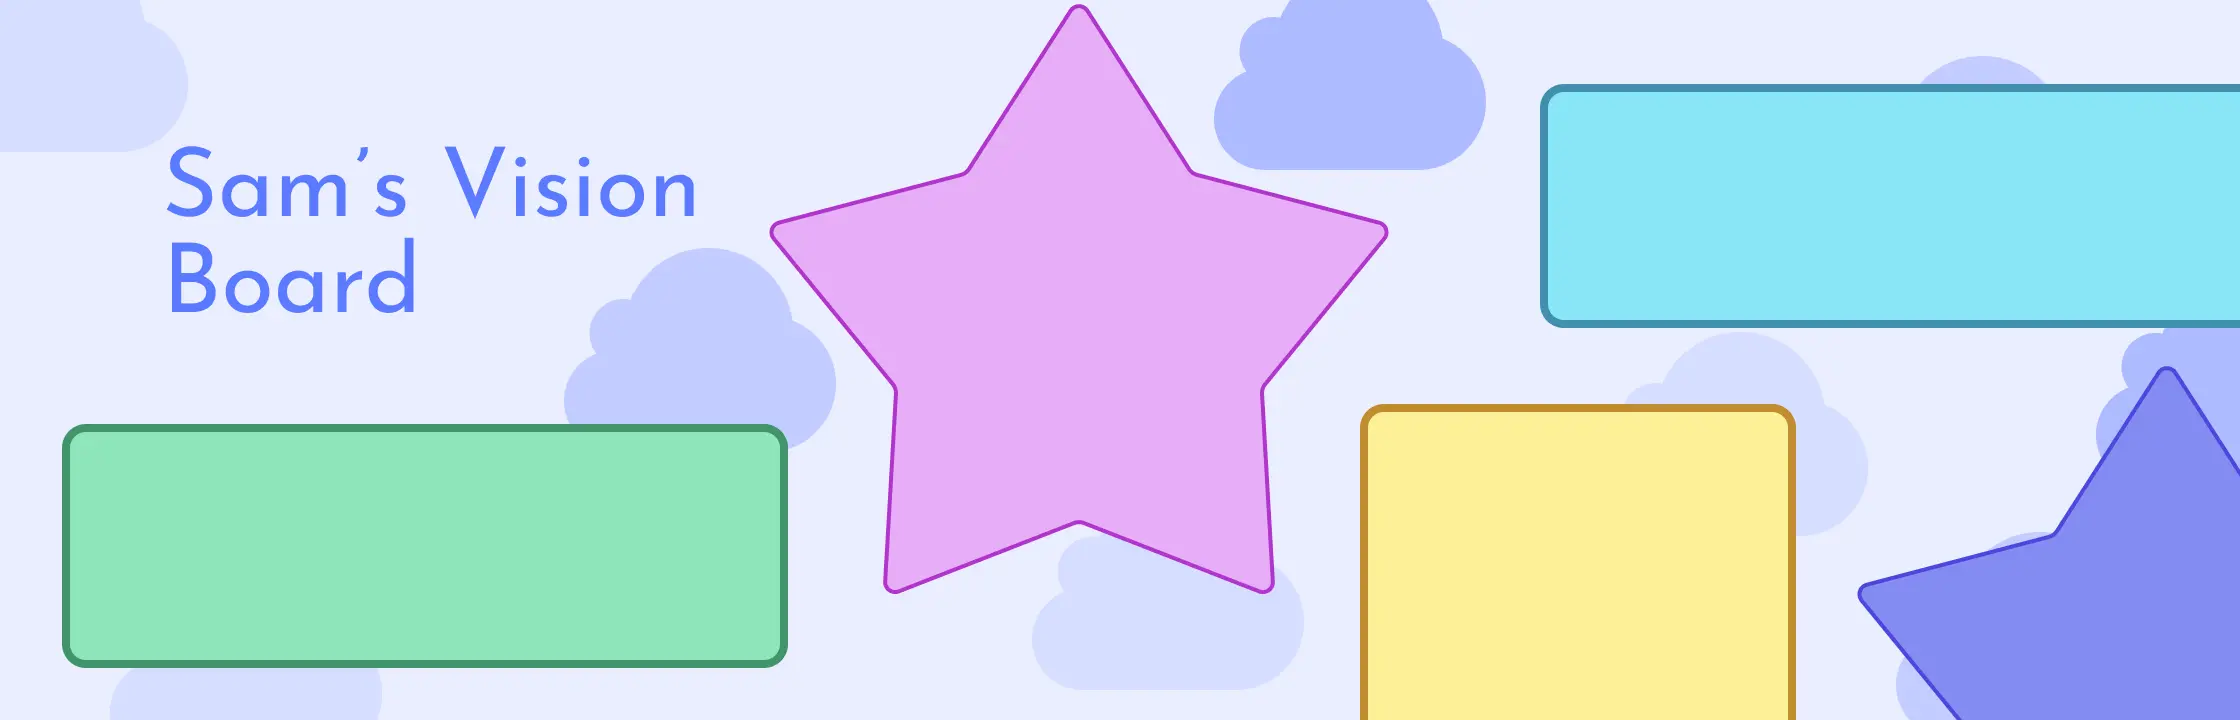
What is a Student Vision Board? A vision board for students is a powerful visualization tool designed to help students articulate and pursue their educational and personal goals. By creating a collage of images, words, and symbols, students can visually represent their aspirations and motivations, making their goals more tangible and actionable.
In a world where distractions abound and goals can sometimes feel out of reach, empowering our children with tools to visualize and achieve their dreams is more important than ever. One such tool that holds immense power is the humble vision board. In this post, we’ll delve into the wonders of the vision board for kids and how it can transform the way our little ones perceive and pursue their aspirations.
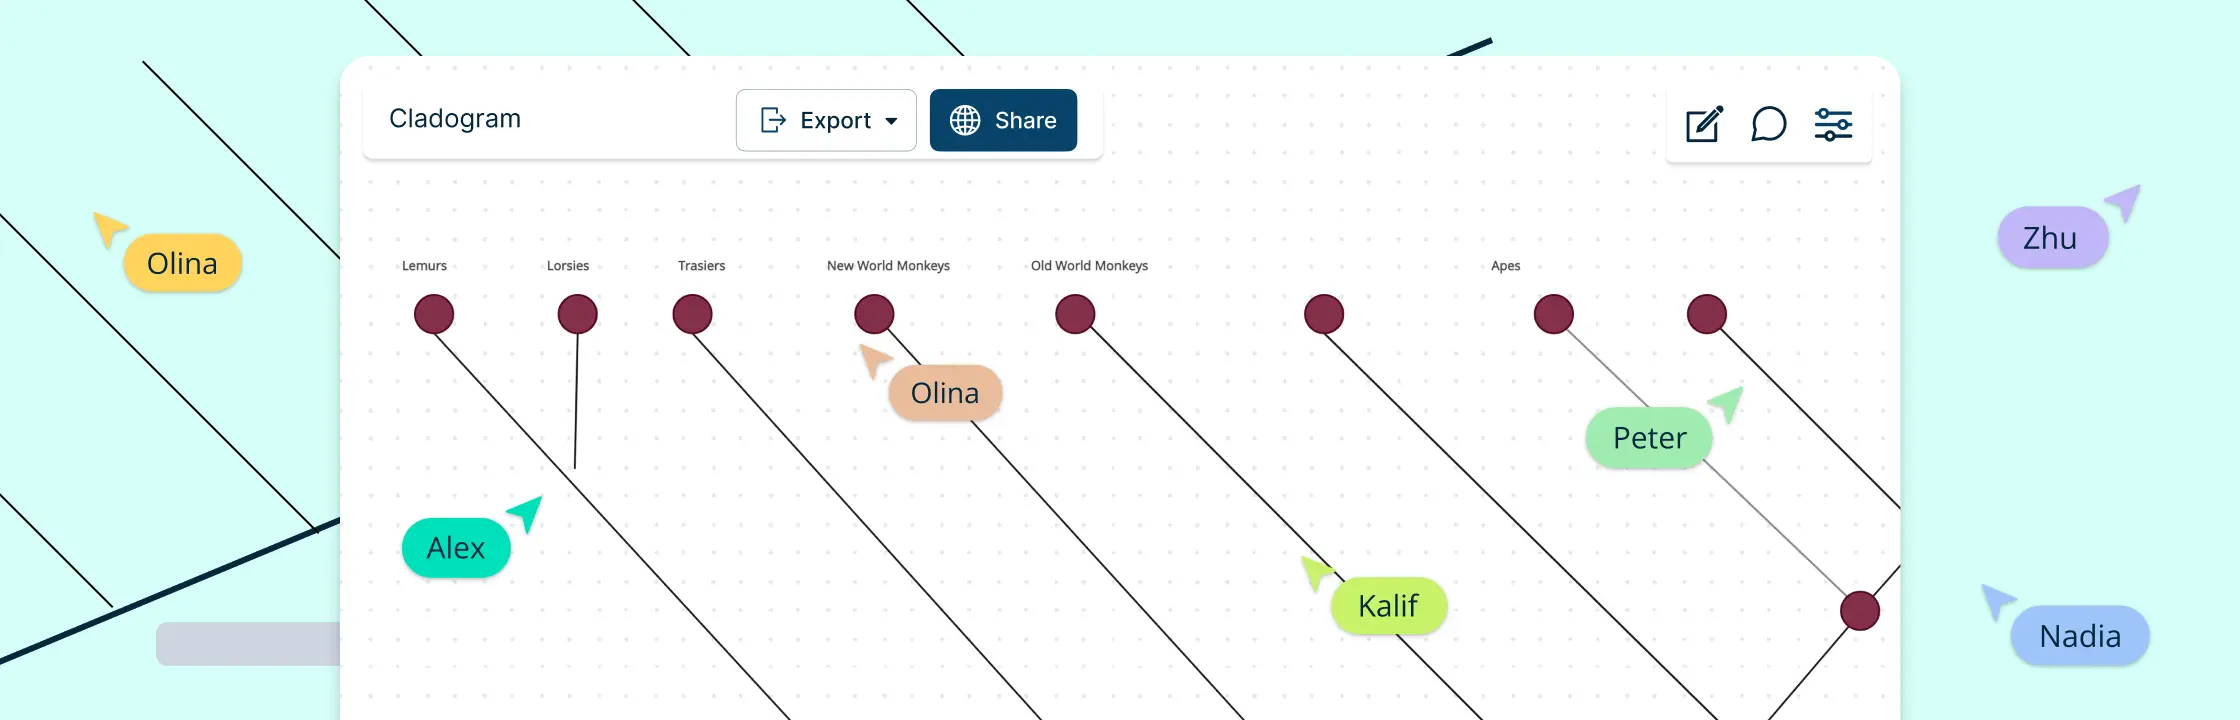
What is a Cladogram? Definition of a Cladogram A cladogram is a branching diagram that represents the evolutionary relationships among various biological species based on their shared common ancestors. These diagrams are used extensively in the field of evolutionary biology to illustrate the point where lineages split or diverge over time, aiding in the visualization of traits shared among groups of organisms.
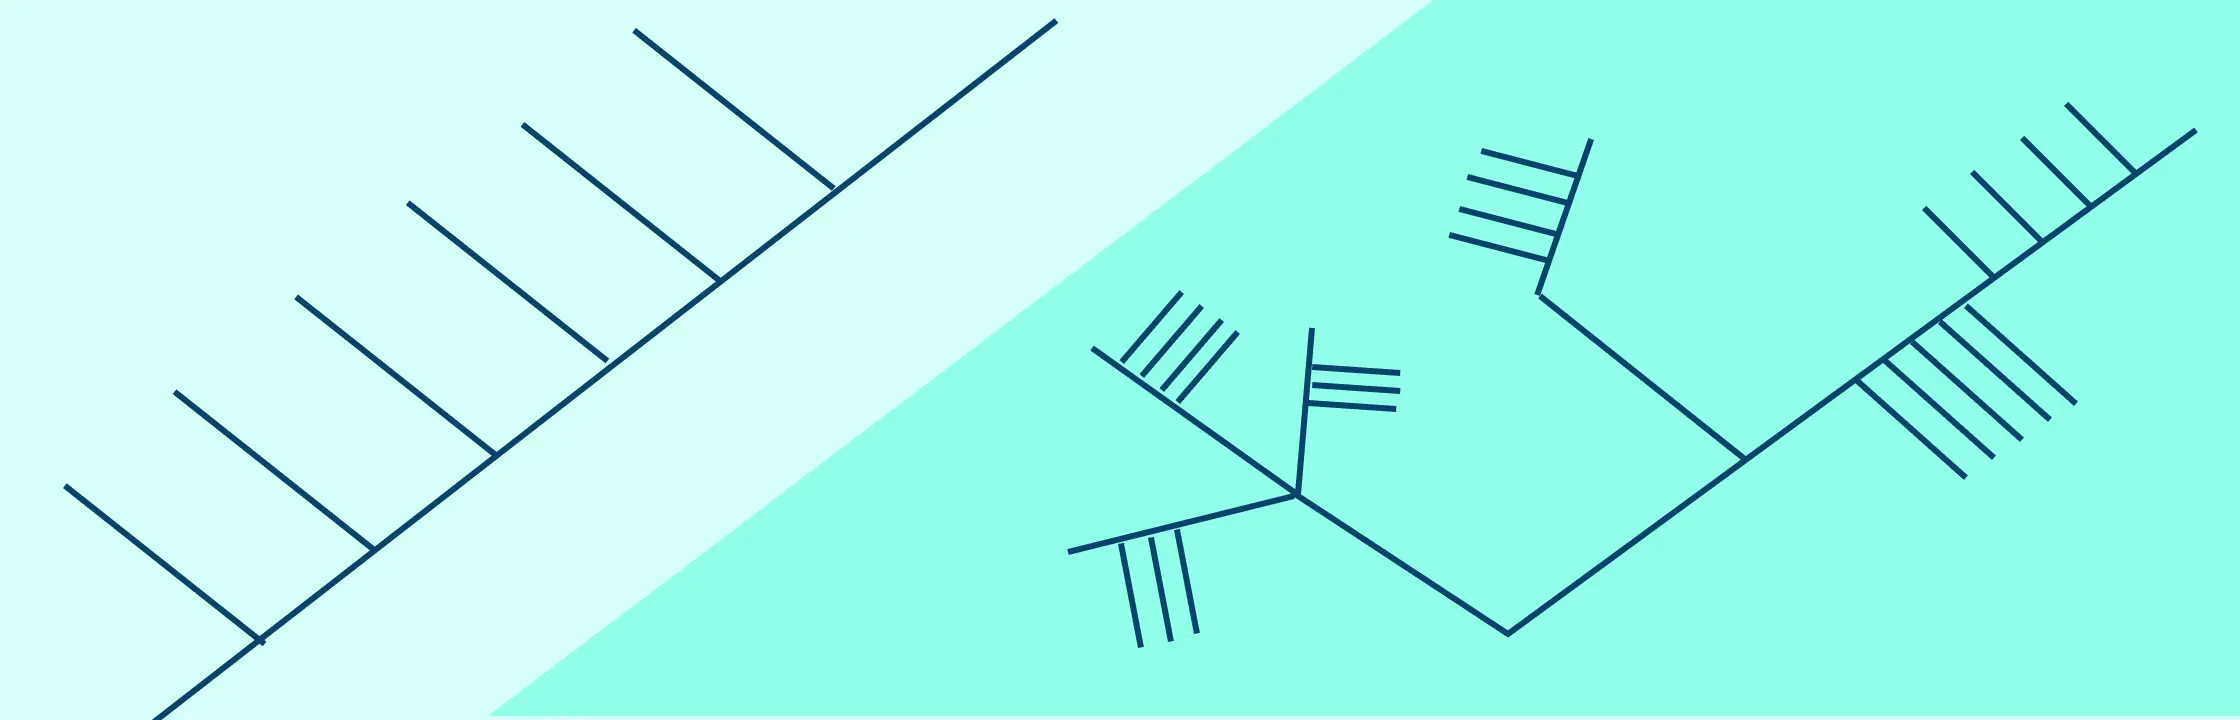
In the study of biological diversity and evolution, diagrams play an essential role in visualizing relationships among various species. Two primary types of diagrams used for this purpose are cladograms and phylogenetic trees. While they may appear similar, understanding their distinctions is crucial for accurate interpretation.
Cladograms are visual tools used by scientists to illustrate the evolutionary relationships among different species. Understanding how to read and interpret these diagrams is crucial for anyone studying evolutionary biology, paleontology, or related fields. Here’s a step-by-step guide to help you navigate and understand cladograms.
In today’s fast-paced work environment, personal development is essential for achieving professional success and job satisfaction. Setting personal development goals helps you grow your skills, expand your knowledge, and advance in your career. In this blog post, we’ll explore how to effectively set personal development goals for work to help you thrive professionally.
Professional development is crucial for teachers. It not only strengthens teaching skills but also improves student outcomes and supports career growth. This blog post outlines a comprehensive approach to setting and achieving professional development goals for teachers, guiding you through each step with clear, actionable advice.
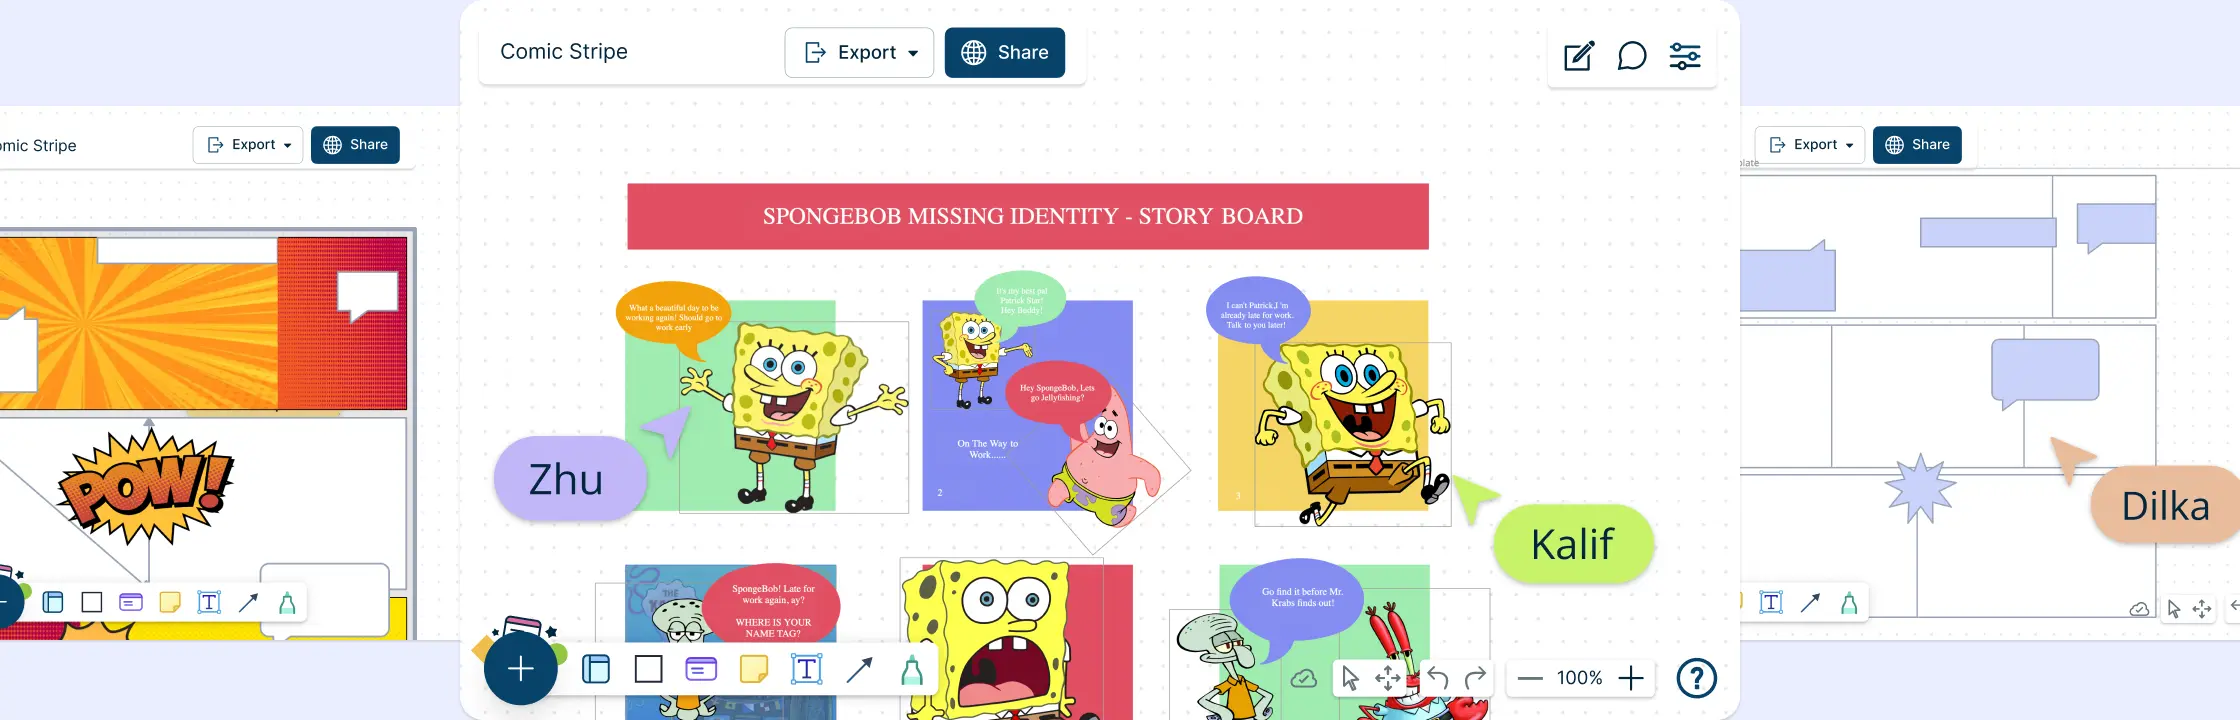
Creating a comic strip is an exciting way to express your creativity, tell engaging stories, and connect with readers. Whether you’re inspired by classics like “Peanuts” or modern hits like “Calvin and Hobbes,” making your own comic strip can be a rewarding experience. In this guide we will look at how to make a comic strip along with handy templates to help you get started.
Comic strips are more than just humor on paper; they’re a creative outlet that blends storytelling with visual artistry. Whether you’re a seasoned cartoonist or a beginner looking to explore the world of comic strips, finding fresh ideas can sometimes be challenging. Here, we’ve curated a list of comic strip ideas and prompts to ignite your imagination and help you craft engaging comic strips.
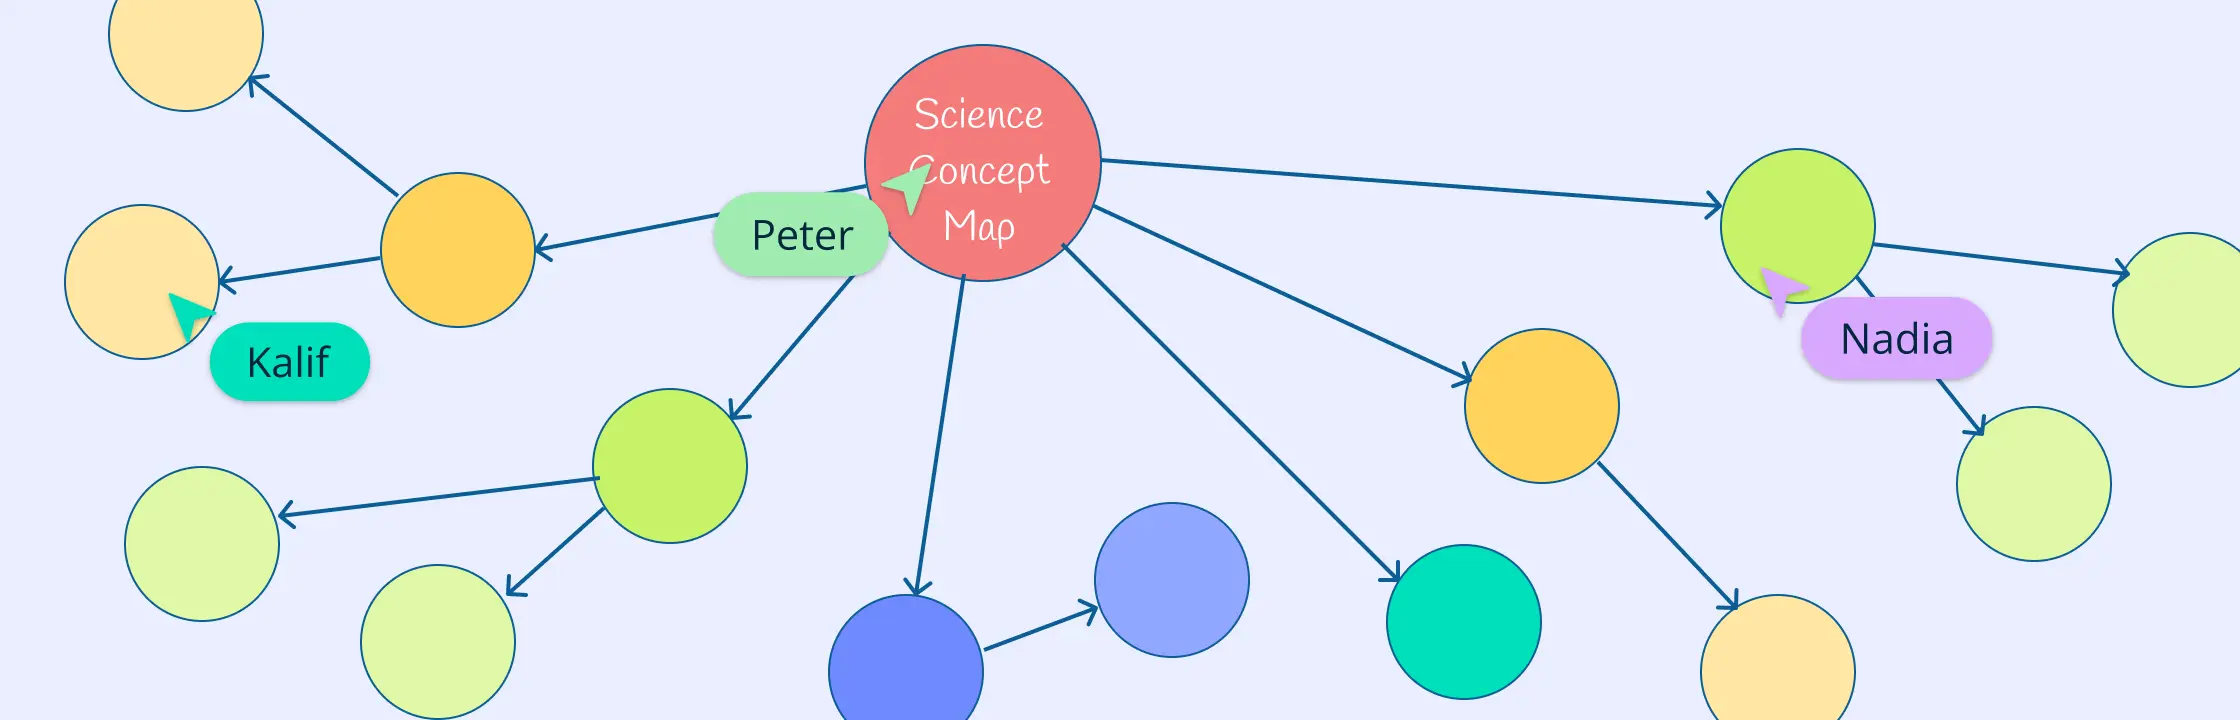
Concept maps are powerful tools in science education, serving as visual representations that organize and structure knowledge. They are particularly effective in enhancing scientific understanding and making complex information more accessible.
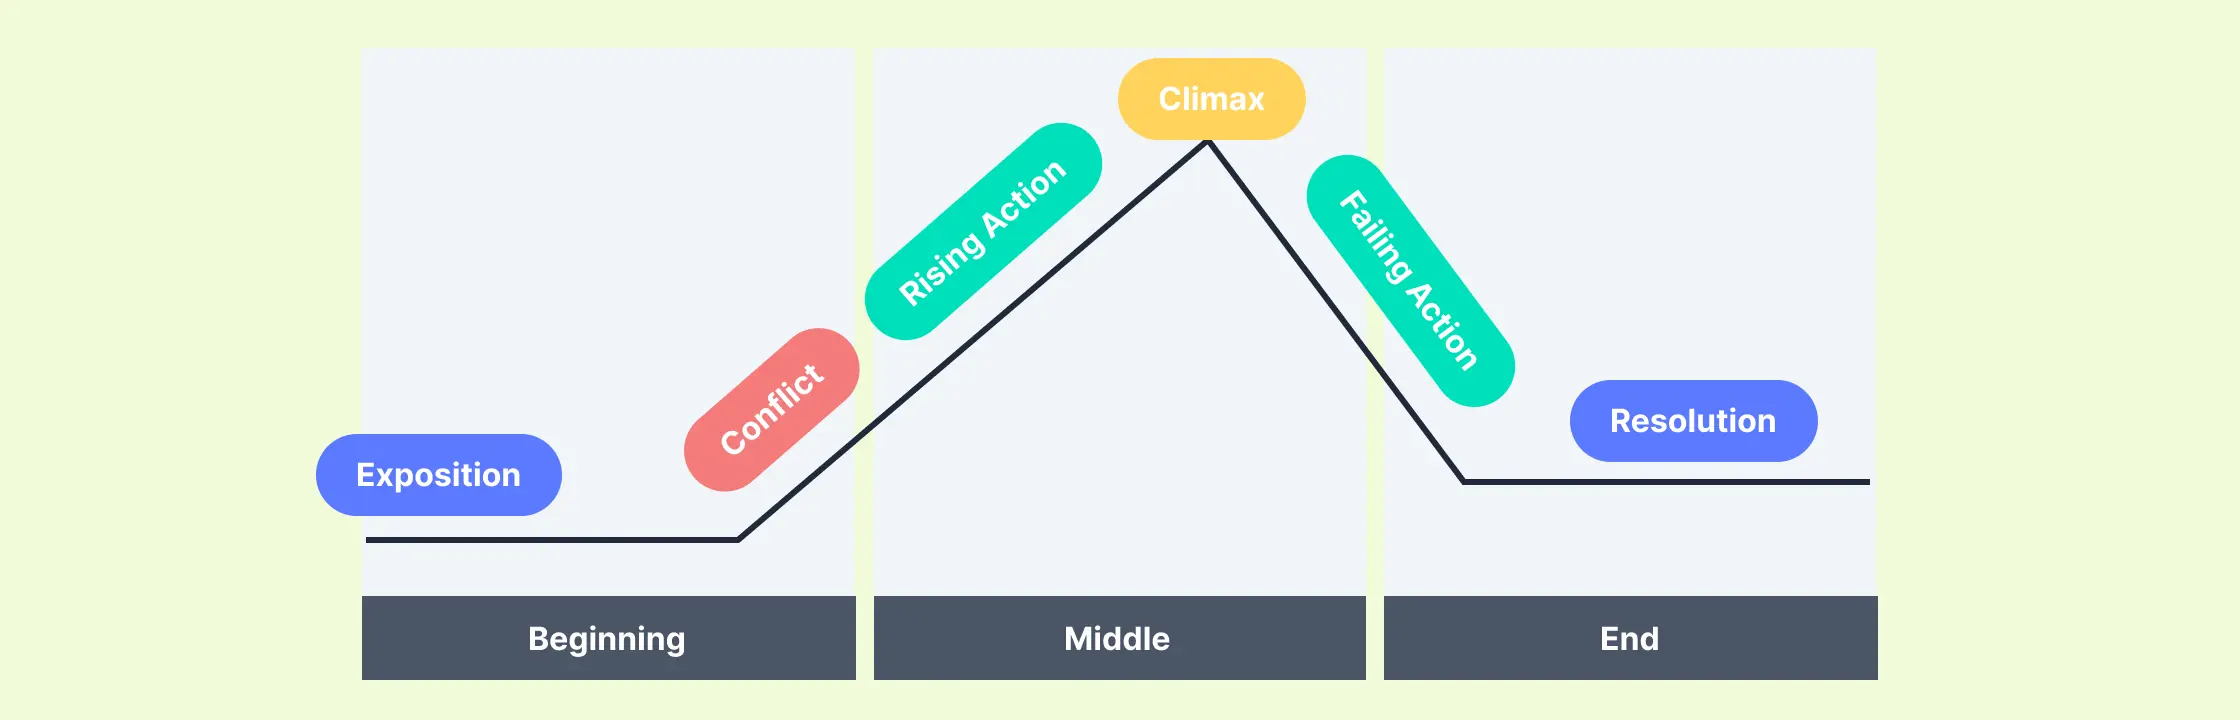
Plot Diagrams: What They Are and How to Use Them for Storytelling A plot diagram helps writers visualize the structure of their stories. By mapping out the main events, a plot diagram ensures a clear and cohesive flow, making it easier to identify the critical moments that drive the narrative forward. In this blog post, we are delving into how to create a plot diagram and how to use it to craft stories.
A conceptual framework in research is not just a tool but a vital roadmap that guides the entire research process. It integrates various theories, assumptions, and beliefs to provide a structured approach to research. By defining a conceptual framework, researchers can focus their inquiries and clarify their hypotheses, leading to more effective and meaningful research outcomes.
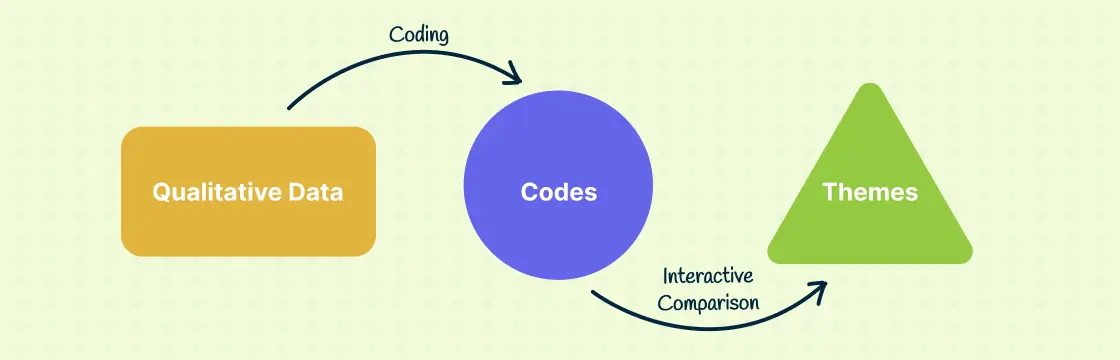
Have you ever wondered how researchers dive into the depths of words to extract common themes and ideas? Well, thematic analysis is their trusty tool for the job! In this guide, we’ll walk you through the basics of thematic analysis, breaking down its six-step process into simple, digestible chunks. By the end, you’ll not only understand how this method works but also gain insights into how it can illuminate the hidden gems within textual data.
Have you always been curious about your family history and where your ancestors came from? Creating a family tree chart is a great way to learn more about your lineage and discover interesting stories from your family’s past. A family tree visually maps the relationships between you and your parents, grandparents, great-grandparents, and beyond. It can give you a sense of identity, heritage, and connection to those who came before you. In this guide, we will discuss how to make a family tree chart along with best practices, templates and benefits.
Kinship diagrams offer a simplified yet informative way to explore family history. They offer a clear snapshot of lineage, descent, and the complexities of extended kin networks. From tracing the roots of a family tree to understanding the dynamics of larger ancestral connections, kinship diagrams play an important role in genealogy, anthropology, and sociology.
Bubble maps are a powerful tool for brainstorming, organizing ideas, and visualizing data. They can help stimulate creative thinking and make complex ideas easier to understand and remember. In this blog post, we will provide an overview of how to create a basic bubble map, including templates and tips.
In today’s information-overload landscape, the ability to communicate in a clear, concise, and visually engaging manner has never been more critical. Modern visual documentation techniques have evolved to meet this demand, offering a dynamic approach to explaining complex processes, visualizing data, and presenting information comprehensively. Adaptable online whiteboard platforms like Creately enable users to create, collaborate, and communicate more effectively. In this article, we will explore various modern visual documentation techniques and how Creately can enhance your visual documentation efforts on our site.
As the old adage goes, “A picture is worth a thousand words”; using images, diagrams, and other visual aids to convey complex information is becoming an essential tool for effective communication and knowledge sharing. A strong visual presentation can make all the difference in communicating, understanding, and retention of information, and collaboration in a variety of fields, from project management to education and beyond.
Visual documentation is becoming popular among users because it is a more engaging and effective way to communicate information. Using visuals such as diagrams, charts, and images can help document complex and lengthy processes easily and quickly. In turn, they also help users to better understand complex concepts, and retain information more effectively than text alone.
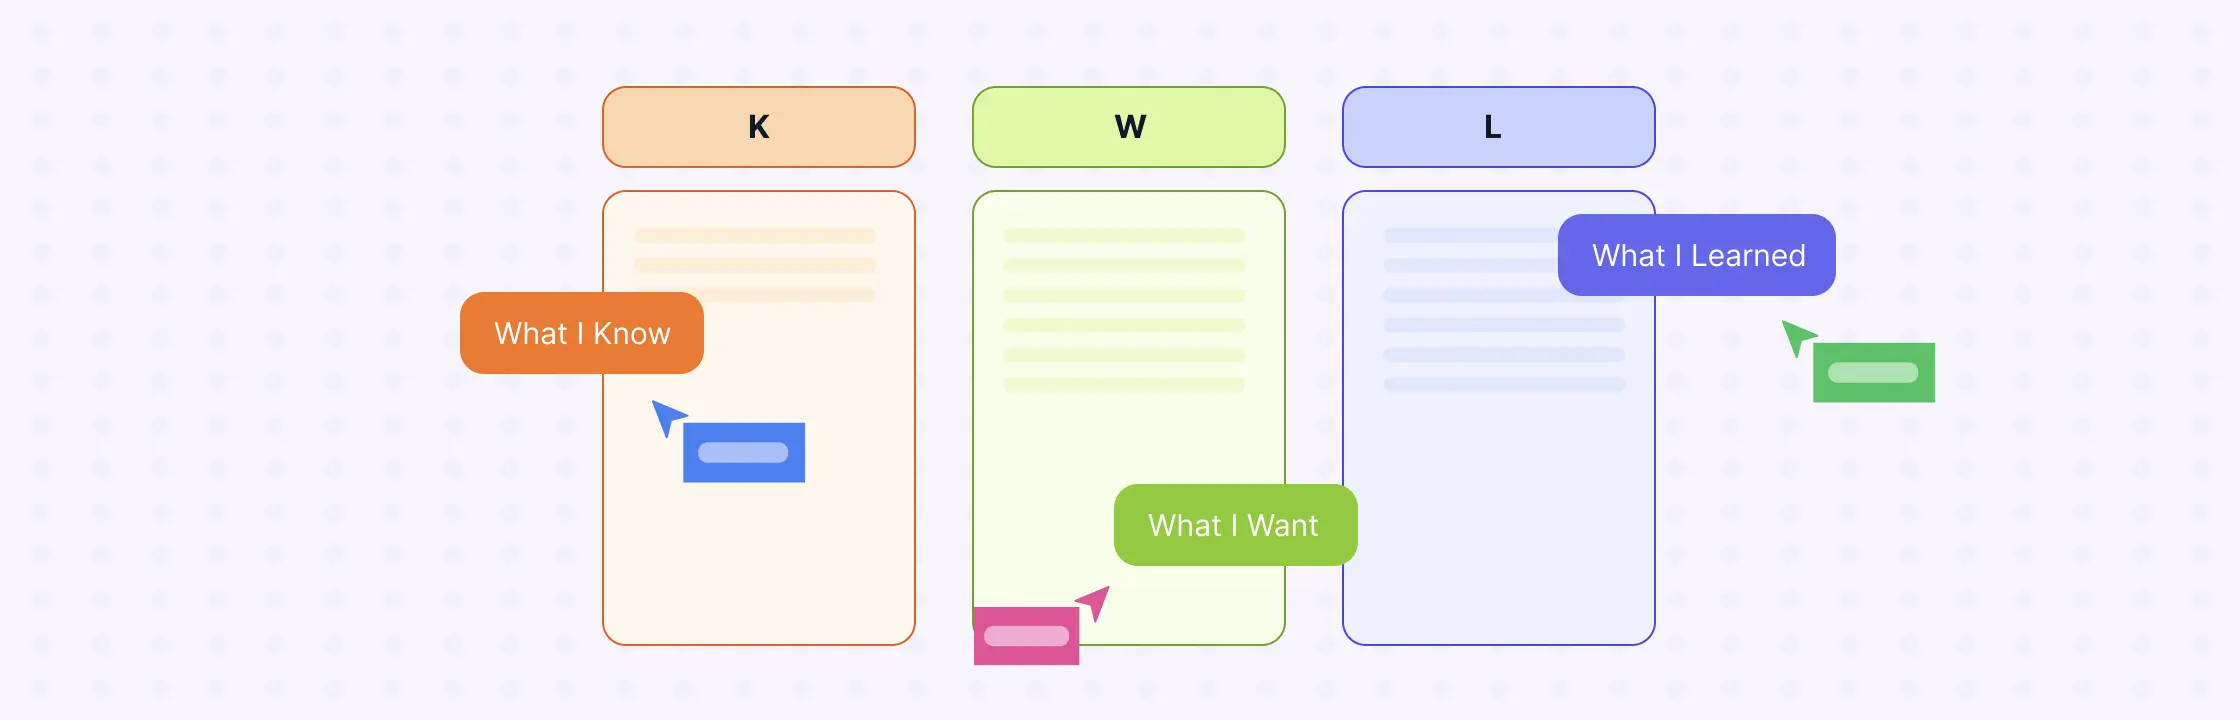
Education is an exciting journey, and every teacher wants to give students the best tools for success. KWL charts are one such effective tool that teachers can use to guide students through a three-step-process to gather knowledge about a particular subject, create purposeful learning experiences and help summarize what they learned. Using KWL charts in the education process encourages students to explore, question, and learn actively.
Do you ever get stuck in front of a blank screen, desperately trying to brainstorm content ideas? We’ve all been there. In the ever-evolving world of online content, coming up with exciting and unique ideas is like finding hidden treasures. At those times when you hit a content roadblock, you can rely on content brainstorming to jump-start your creativity.
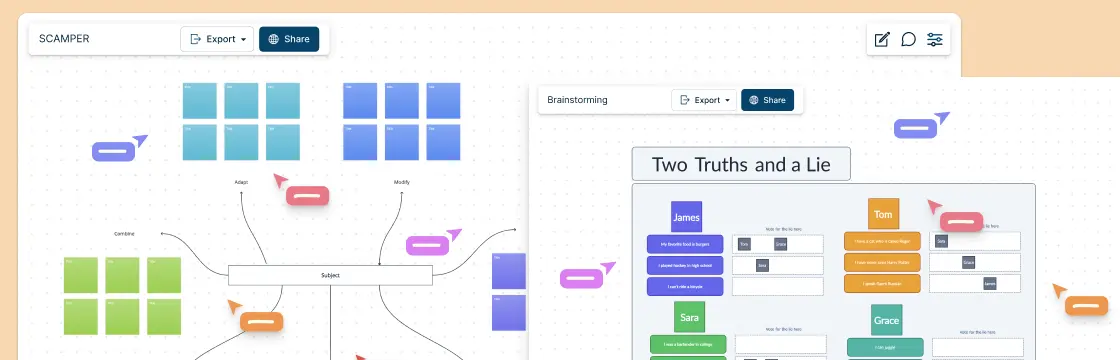
Collaborative brainstorming sessions are the secret sauce that can fuel a team’s innovation, and creativity. Many times it’s just the thing you need to keep your team feeling active and engaged. However, finding ways to keep a session structured and useful can be a real challenge. It’s easy to get lost in the brainstorming wilderness, where ideas stay on sticky notes and never see the light of day.
Brainstorming, often the go-to method for generating fresh ideas and solving complex problems within teams, has a mixed reputation. While some individuals thrive on the creative energy it brings, others dread the thought of it. So, why do many brainstorming sessions end up being ineffective, leaving participants staring expectantly at each other, instead of producing innovative ideas? In this article, we will explore why brainstorming often falls short of expectations and provide practical solutions to transform this process into a powerful tool for idea generation.
After brainstorming, you take the ideas you generated and turn them into actionable plans and solutions. What comes after brainstorming is a structured process that makes sure that creativity is harnessed effectively to address the problem or achieve the desired goals.
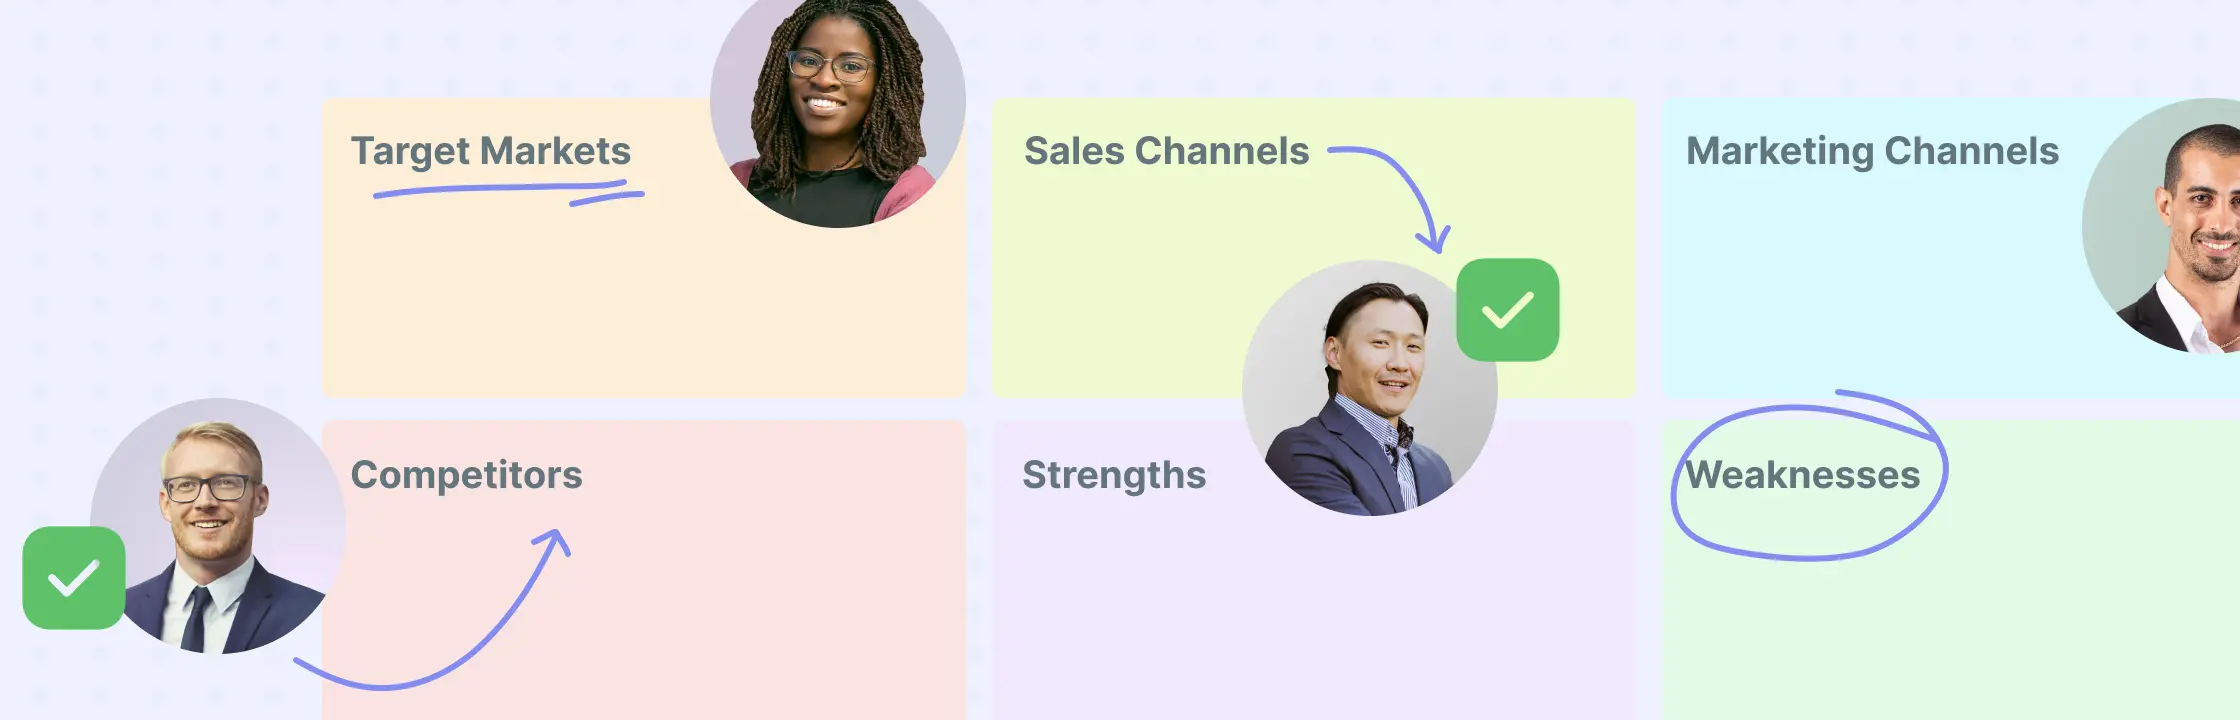
Brainstorming in business is an indispensable tool; it helps ignite creativity, align goals, and sharpen problem-solving skills. From coming up with new product ideas to mitigating risks, brainstorming is used to find solutions faster in every business, big or small.
A brainstorming workshop is a structured and collaborative way to come up with ideas, solve problems, and innovate. Whether you’re a business leader seeking innovative solutions, an educator looking to spark students’ creativity, or simply someone eager to explore new horizons, running an effective brainstorming workshop can be a game-changer.
While everyone is familiar with the concept of brainstorming, brainstorming running an actual brainstorming session can be as challenging as any other traditional meeting. That’s where brainstorming rules come in. They serve as guidelines to make brainstorming work smoother. And establishing a set of ground rules can help you overcome these challenges more effectively.
It’s no secret that marketing professionals face fierce competition and constantly changing consumer preferences. So, how do we rise above the noise and create marketing campaigns that truly resonate with our audience? The answer lies in the art of brainstorming.
One of the most effective ways to foster team creativity is group brainstorming sessions. These collaborative sessions allow team members to unleash their creativity, generate new ideas, and find innovative solutions. However, it is crucial to find the right balance to maximize the output of your team. Group brainstorming is like a carefully choreographed dance. Sometimes you lead, sometimes you get led. In this blog post, we will explore strategies for boosting team creativity through group brainstorming and discuss how to maintain this delicate balance. By implementing these strategies, your team can tap into their collective genius and unlock their full creative potential.
Brainstorming, is a tried-and-true method for sparking fresh ideas and solving problems. It’s where honest conversations thrive, and innovative solutions are born.
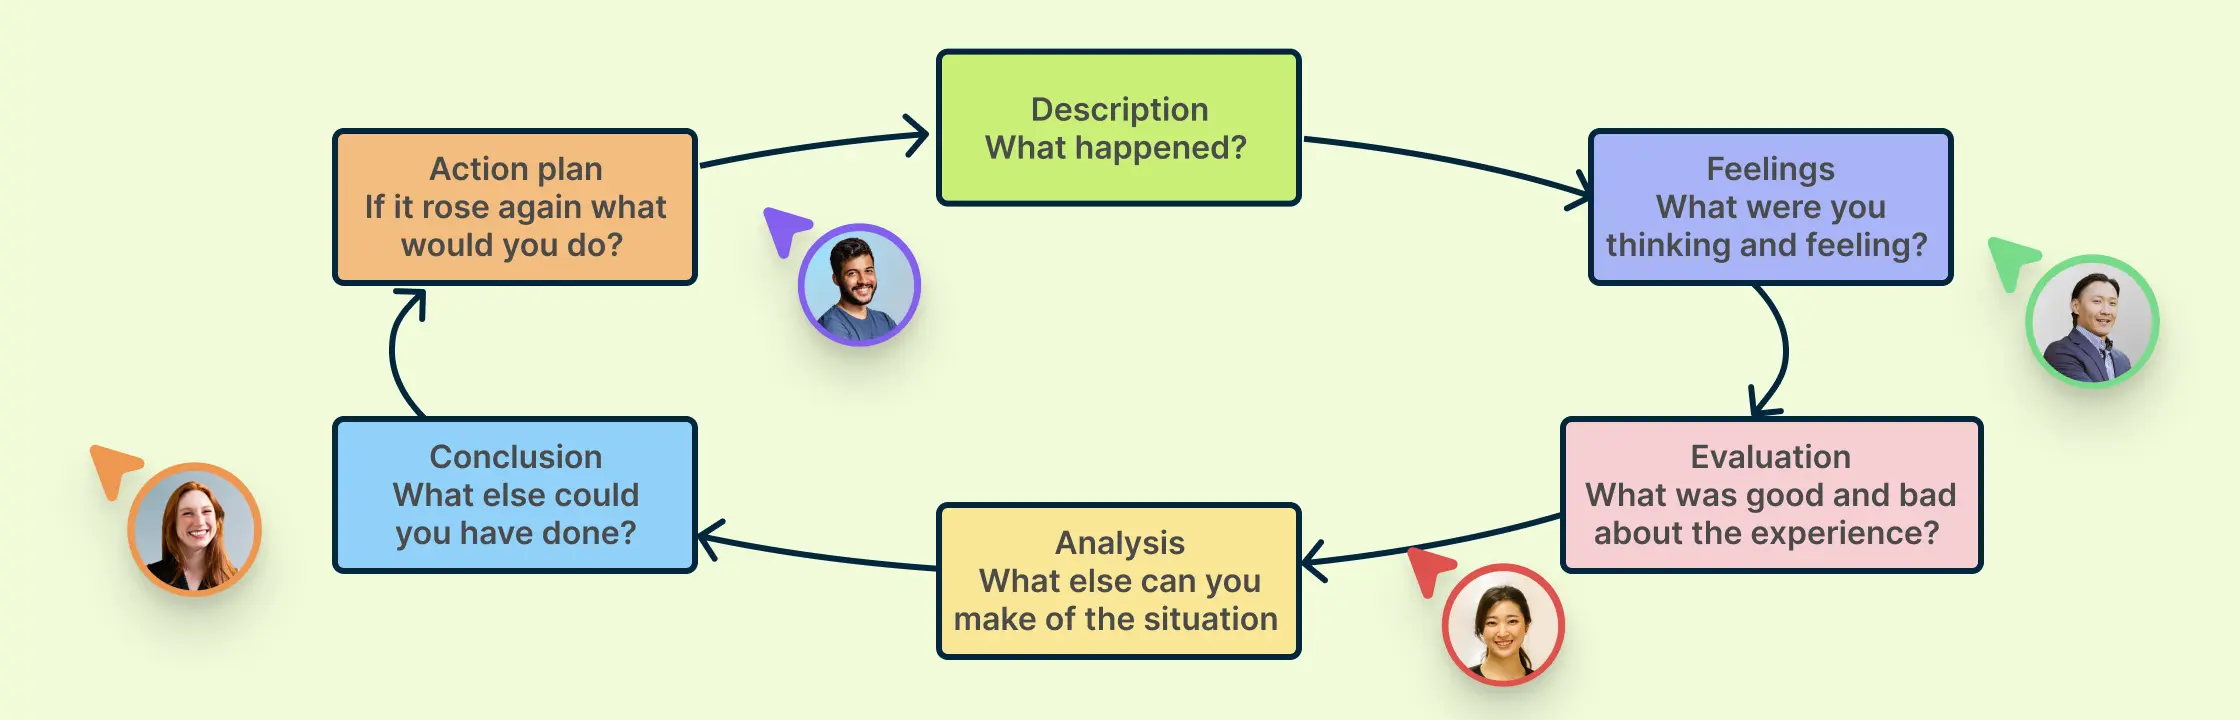
Reflective practice involves engaging in a thoughtful examination of your actions, feelings, and responses to experiences. This process enhances self-awareness and promotes continuous personal and professional growth. Reflective practice encourages critical thinking, improving decision-making and problem-solving abilities. Here’s a comprehensive guide to the Gibbs reflective cycle and how you can use it for personal and professional reflection and development.
Medical genograms are visual tools that map a family’s health history across generations, helping to identify inherited conditions and patterns. By using accurate medical genogram symbols, these diagrams go beyond family trees to reveal genetic, emotional, and psychological health links. Whether you’re building a health history genogram or exploring medical genogram examples, they’re essential for preventive care, genetic counseling, and understanding long-term health risks.
A preparatory interview to draw a genogram helps in gathering family information about a l person or family members being interviewed. It helps build a detailed and comprehensive picture of the family system which in turn will help with making an accurate genogram.
Whether you’re a therapist, counselor, social worker, or healthcare professional, understanding genograms can greatly boost your ability to comprehend and analyze family dynamics. With this comprehensive guide, we will cover everything you need to know about genograms, from what they are to how to create a genogram, and how to understand what they mean.
Ask any student – essay writing is one of the most despised tasks of their educational career. Perhaps there is so much displeasure associated with the task because it’s perceived as too linear – there isn’t enough visual and creative appeal. But if you use graphic organizer for writing essays then you can make writing enjoyable – or at least less terrible.
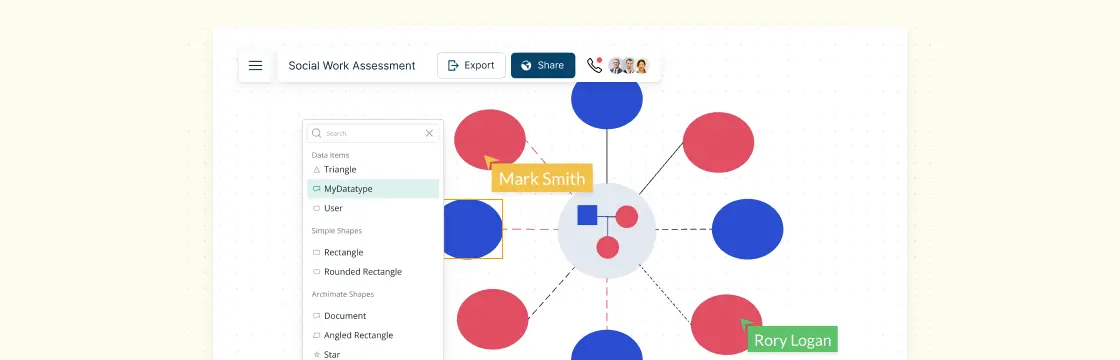
There are many social work assessment tools that help social workers with examining their clients and their situation. In this post, we will be looking at several visual tools that help understand the clients’ relationships and situation in-depth.
Looking for an easy and efficient way to visualize your projects, plans, or events? Check out Creately’s Free Timeline Templates! These customizable templates are perfect for professionals, students, and anyone in need of a clear and concise way to present information over a period of time.
Dichotomous Key Definition A dichotomous key is a widely used tool in biology and other sciences to identify and classify organisms or objects based on observable characteristics. It works through a series of two-part choices. These choices can be based on qualitative traits (like color or shape) or quantitative traits (like number of legs or height), and the key can be presented in written or graphical (flowchart) form.
Graphic organizers combine text and visuals, making them a scientifically proven tool for effective teaching and learning. They are highly beneficial for teachers and students alike, helping to create more engaging lessons and enhancing comprehension. Below, we’ve outlined different types of graphic organizers that you can use in various scenarios—whether it’s reading, writing, conducting research, or preparing for exams. The types of graphic organizers below include a ready-to-use template to get you started instantly.
There are times even the typical brainstorming techniques with your team would hit a roadblock. Coming up with fresh new ideas isn’t always so easy.