Gantt charts are an essential tool in project management, providing a visual timeline for tasks and milestones. Whether you’re managing a small team or overseeing a large-scale project, Gantt charts can simplify complex processes and improve communication among stakeholders. This guide will walk you through everything you need to know about creating a Gantt chart, from understanding its components to templates and best practices.
What is a Gantt Chart?
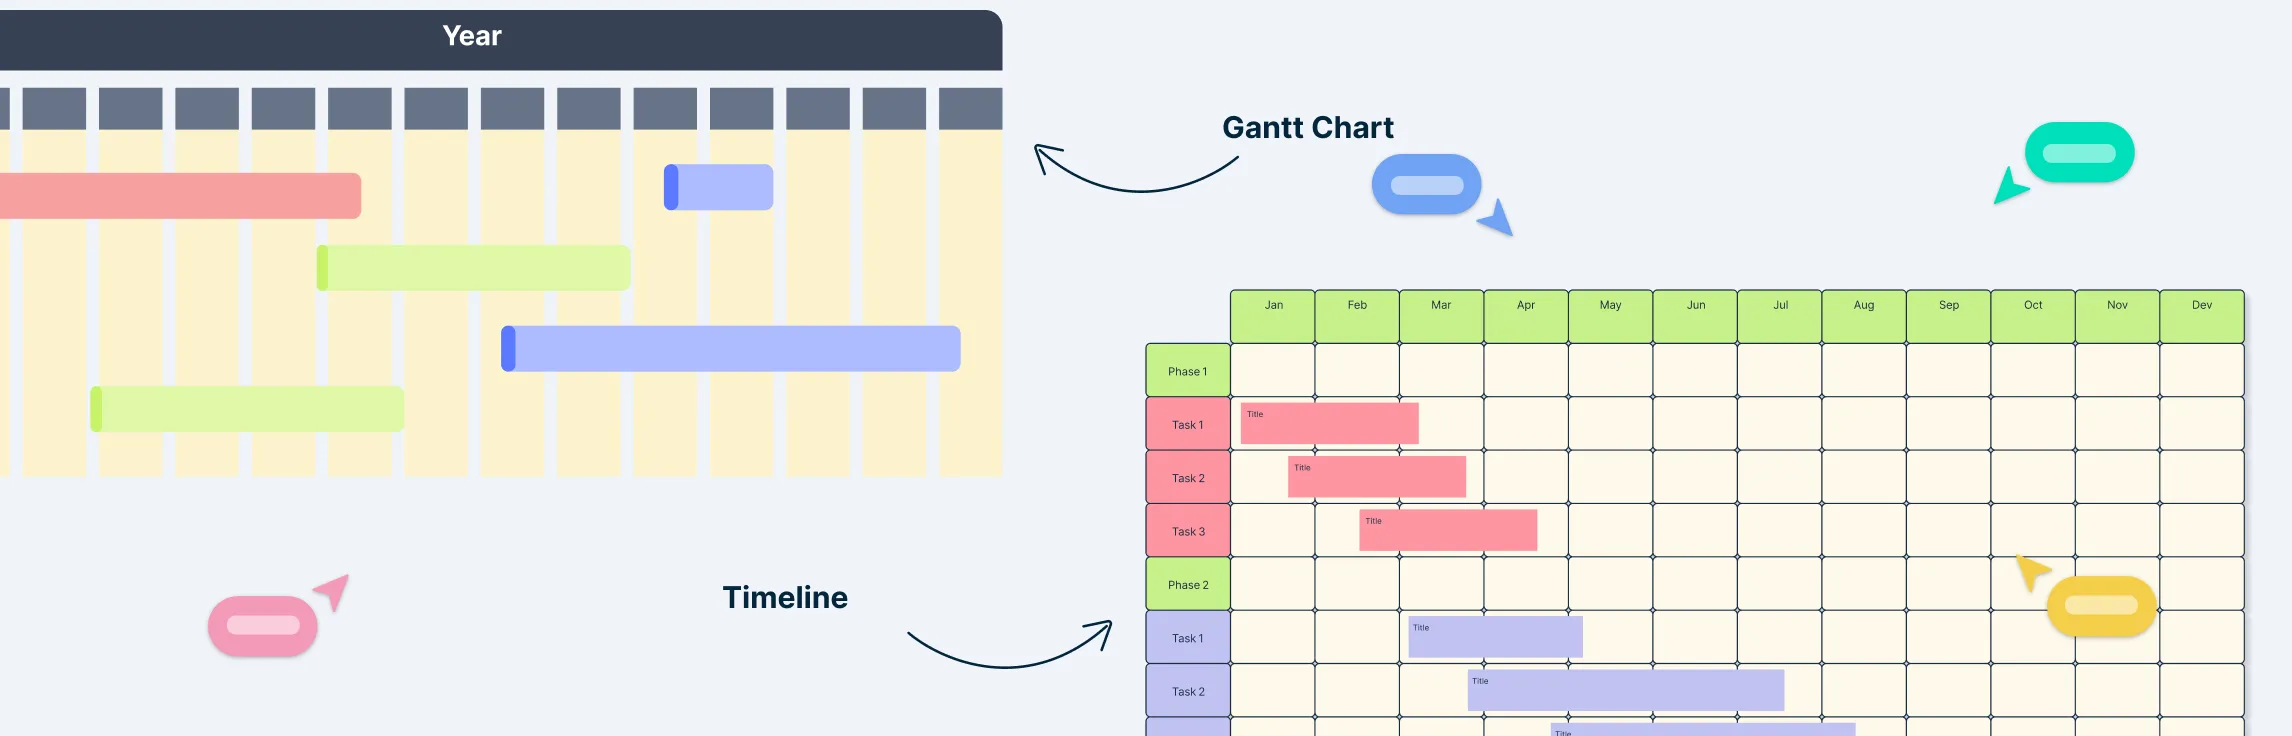
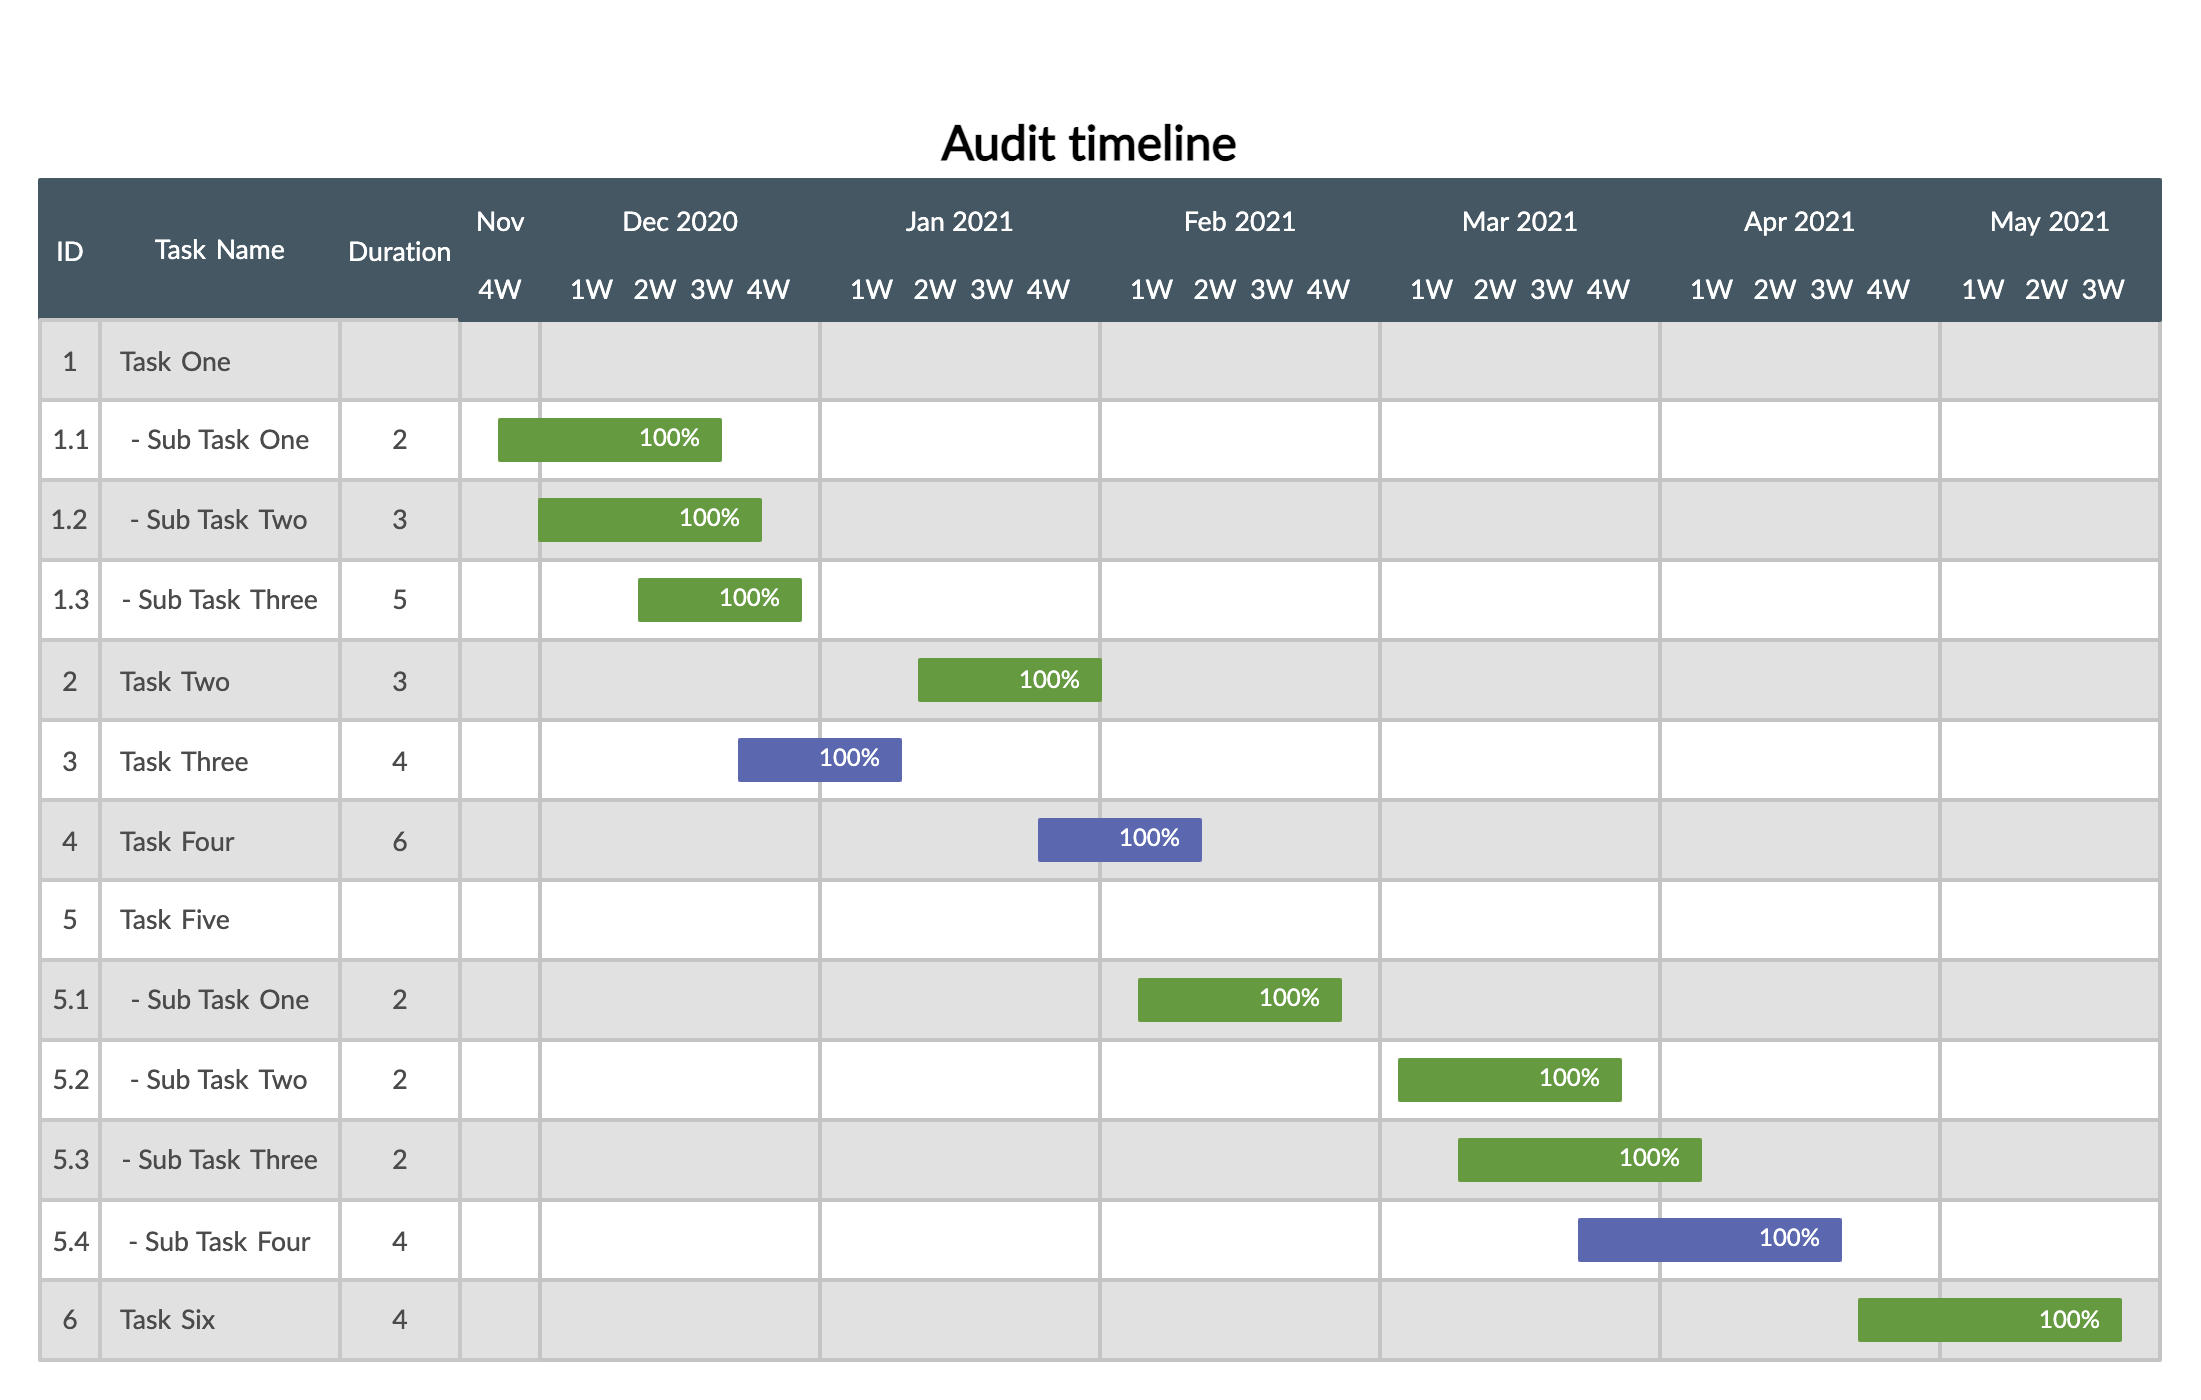
A Gantt chart is a type of bar chart that represents a project schedule. It illustrates the start and finish dates of various elements of a project, including tasks, subtasks, and milestones. It plots tasks against a timeline, showcasing each task’s start and end dates, dependencies, and overall progress. This visual representation helps project managers and teams understand the flow of tasks, prioritize activities, and track milestones effectively. It is useful for managing complex projects with numerous tasks and dependencies. This is increasingly relevant because 92% of companies report redesign as important and 80%+ are actively restructuring or recently restructured (Deloitte, 2016).


Create a Gantt chart with Creately’s Gantt chart maker.
Brief History of Gantt Charts
The Gantt chart was developed by Henry Gantt in the early 20th century. Initially, it was designed to streamline the production processes within factories. Over time, its application expanded beyond manufacturing to various industries, becoming a cornerstone of modern project management.
- Construction: Used to plan different phases of construction projects and manage everyday tasks.
- IT and software development: Assists in roadmap planning, bug tracking, and feature release scheduling.
- Education: Helps in curriculum development and tracking academic projects.
Key Components of a Gantt Chart
- Tasks and subtasks: These are the individual activities that need to be completed as part of the project. Tasks are usually broken down into smaller, more manageable subtasks.
- Timelines: Each task and subtask is associated with a specific start date and end date. The timeline helps in visualizing the duration of each task and the overall project.
- Milestones: Milestones are significant points or events in the project timeline, such as the completion of a major phase. They are typically represented as diamond shapes on the chart.
- Dependencies: Dependencies show the relationships between tasks, indicating which tasks must be completed before others can begin. This helps in identifying the sequence of activities and potential bottlenecks.
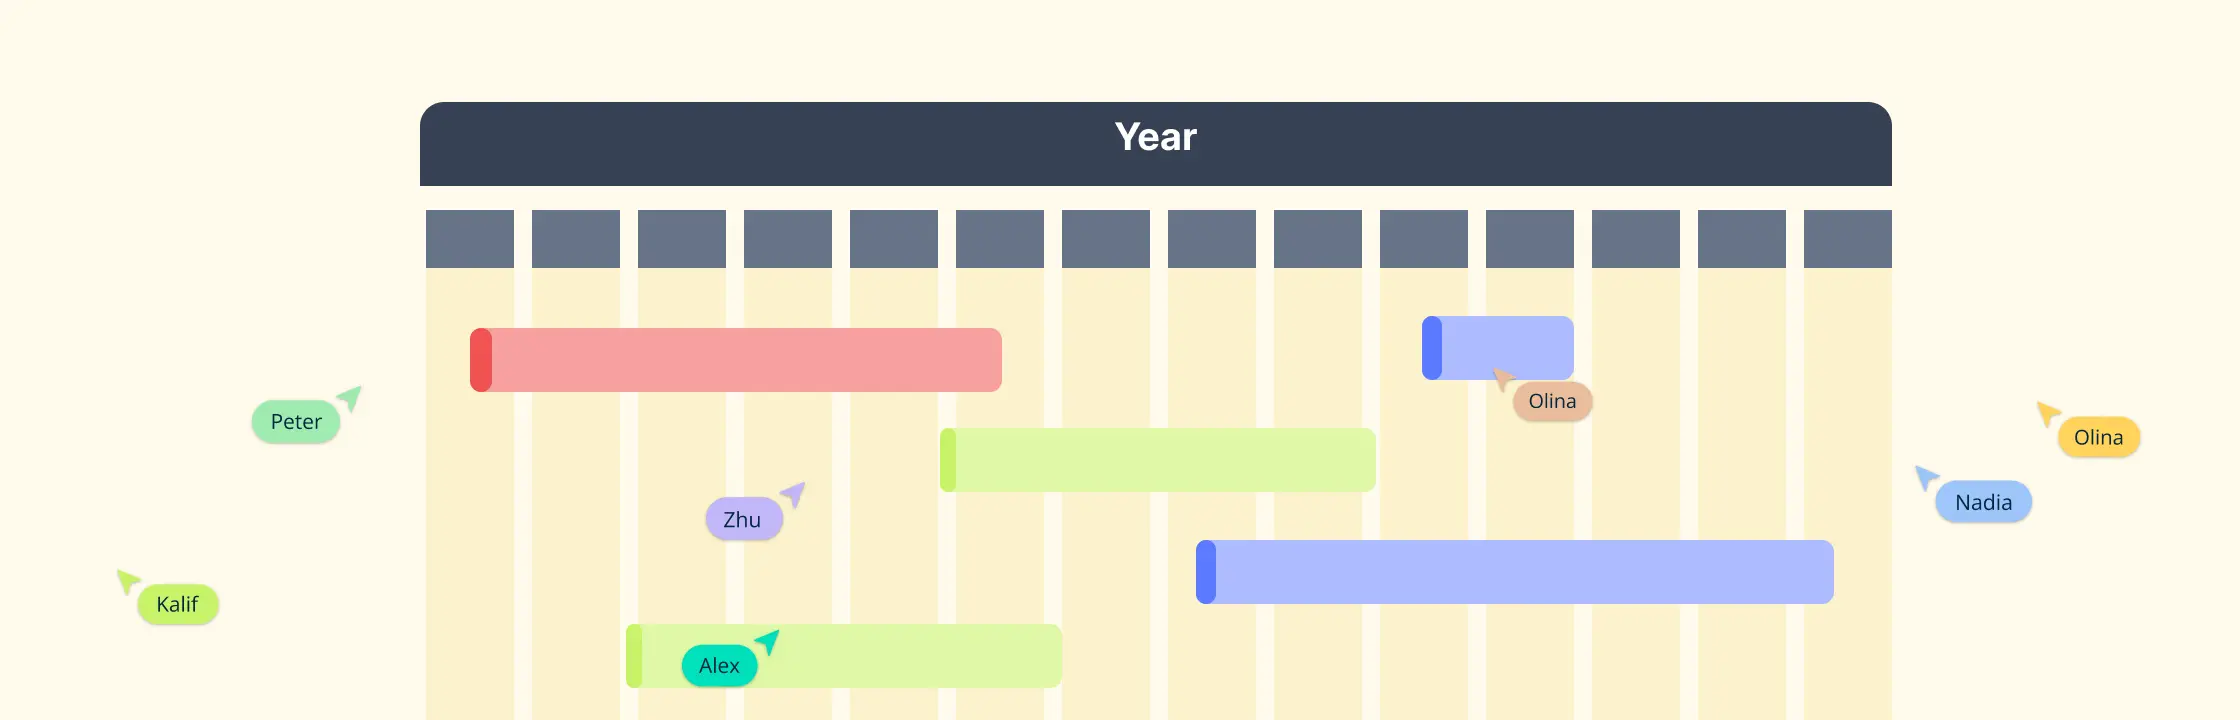
- Resources: Resources refer to the personnel, equipment, or materials required to complete tasks. Assigning resources to tasks helps in managing workload and ensuring availability.
How to Create a Gantt Chart
Creating a Gantt chart is a straightforward process that involves defining your project’s tasks, timelines, and dependencies. Follow these steps to create an effective Gantt chart:
1. Define the project scope
Start by clearly outlining the objectives and deliverables of your project. Understand what needs to be accomplished to set the foundation for your Gantt chart. This includes detailing the overall goal of the project, the key deliverables, and the expected outcomes. Having a well-defined project scope helps in ensuring that all necessary tasks are accounted for and provides a clear direction for the project.
2. List tasks and subtasks
Break down the project into smaller, manageable tasks and subtasks. This step helps in organizing the project and identifying all necessary activities. Each major deliverable should be divided into actionable tasks, and if needed, those tasks should be further broken down into subtasks. This granular approach ensures that nothing is overlooked and that each task is specific and actionable.
3. Establish timelines
Assign start and end dates to each task. Make sure that the timelines are realistic and consider the overall project duration. When establishing timelines, take into account factors such as resource availability, potential risks, and any external dependencies. It’s crucial to set achievable deadlines to keep the project on track and avoid unnecessary delays.
4. Identify dependencies
Determine the relationships between tasks. Identify which tasks depend on the completion of others and illustrate these dependencies with arrows or lines. Understanding task dependencies is vital for sequencing activities correctly and ensuring that tasks are performed in the right order. This helps in preventing bottlenecks and ensures a smooth workflow throughout the project.
5. Assign resources
Allocate the necessary resources, such as team members and equipment, to each task. This helps manage workloads and ensure the availability of resources. Clearly defining who is responsible for each task, and what resources are required, helps in balancing the workload and avoiding resource conflicts. It also provides clarity to the team on their specific roles and responsibilities.
6. Set milestones
Identify significant points in the project timeline and mark them as milestones. Milestones are key events or deadlines that help in tracking the project’s progress. These could include the completion of major phases, important meetings, or delivery dates. Setting milestones provides checkpoints to monitor progress and celebrate achievements, helping to keep the team motivated and focused.
7. Create the Gantt chart
Use Gantt chart software or tools like Creately to create the chart. Enter the tasks, timelines, dependencies, resources, and milestones into the tool. Creately provides features such as drag-and-drop scheduling and collaborative functionalities, making it easier to create and maintain the Gantt chart.
8. Review and adjust
Regularly review the Gantt chart to monitor progress and make necessary adjustments. Ensure that the chart is up-to-date with the current project status and adjust timelines, resources, or tasks as needed. Periodic reviews help in identifying any deviations from the plan and taking corrective actions promptly. It also allows for reallocation of resources and adjustment of schedules based on the actual progress and any new developments.
Gantt Chart Examples
Gantt charts can be adapted to fit any type of project, from software development and marketing campaigns to construction projects and event planning. Here are some Gantt chart examples to get you started.


Explore more Gantt chart templates.
When to Use Gantt Charts
Gantt charts are incredibly useful for various aspects of project management.
- Project planning and scheduling: Gantt charts are ideal for visualizing project timelines and ensuring all tasks are accounted for. They help in setting and tracking deadlines, keeping the project on schedule.
- Task management: They are excellent for organizing the project into manageable tasks and assigning responsibilities. Gantt charts also allow you to monitor progress, helping you identify which tasks are on track or delayed.
- Resource allocation: Use Gantt charts to assign team members and equipment to specific tasks. They help in balancing workloads and identifying potential resource conflicts.
- Identifying dependencies: Gantt charts show relationships between tasks, helping you plan the sequence of activities. They allow you to focus on critical tasks that directly impact the project’s completion date.
- Milestone tracking: Gantt charts are useful for highlighting and tracking significant project milestones.
- Communication and collaboration: They keep stakeholders informed about project progress and enhance team communication with a clear visual project plan. Better communication and collaboration in interaction-heavy work has been associated with 20-25% productivity gains (Keller and Meaney, 2013).
- Managing large projects: For complex projects, Gantt charts provide a comprehensive view of all tasks and timelines.
- Risk management: Gantt charts help in identifying potential risks and their impact on the project timeline.
Who Uses Gantt Charts
Gantt charts are versatile tools used by a wide range of professionals across various industries to plan, manage, and track projects.
- Project managers: Project managers use Gantt charts to plan project timelines, allocate resources, track progress, and ensure that projects stay on schedule. They rely on these charts to visualize tasks, dependencies, and milestones.
- Team leaders: Team leaders use Gantt charts to coordinate the activities of their team members, assign tasks, and monitor progress. This helps in maintaining clarity and ensuring everyone is aware of their responsibilities and deadlines.
- Construction managers: In the construction industry, Gantt charts are essential for scheduling the various phases of construction projects, coordinating with subcontractors, and tracking progress against the planned timeline.
- Event planners: Event planners use Gantt charts to organize events, from initial planning through execution. They help in scheduling tasks such as venue booking, catering arrangements, and guest invitations, ensuring everything happens on time.
- Marketing managers: Marketing managers rely on Gantt charts to plan and track marketing campaigns. These charts help in scheduling content creation, distribution, and performance analysis, ensuring that marketing activities are well-coordinated and timely.
- Software developers: Software development teams use Gantt charts to manage development cycles, including coding, testing, and deployment phases. They help in visualizing the timeline of software projects and tracking progress.
- Researchers: Researchers use Gantt charts to plan and track the progress of research projects. This includes scheduling experiments, data collection, analysis, and report writing, ensuring that research activities are systematically organized.
- Educators and academic administrators: Educators and academic administrators use Gantt charts to plan course schedules, academic projects, and administrative tasks. They help in coordinating teaching activities, assignment deadlines, and examination schedules.
- Consultants: Consultants use Gantt charts to manage client projects, from initial assessment through implementation and review. They provide a clear timeline of activities, ensuring that client engagements are well-structured and deadlines are met.
Pros and Cons of a Gantt Chart
Gantt charts are powerful tools for project management, but they also have their limitations. Understanding the pros and cons can help you use them effectively.
| Pros | Cons |
|---|---|
| Visual clarity: Gantt charts provide a clear visual representation of the project timeline, making it easy to see the start and end dates of tasks, their duration, and the overall schedule. | Complexity in large projects: For very large or complex projects, Gantt charts can become unwieldy and difficult to manage. The level of detail can make the chart cluttered and hard to read. |
| Improved planning: By breaking down the project into tasks and setting timelines, Gantt charts help in creating a detailed plan. This ensures that all tasks are identified and scheduled properly. | Maintenance: Keeping a Gantt chart up to date can be time-consuming, especially if there are frequent changes to the project schedule or scope. Regular updates are necessary to maintain accuracy. |
| Progress tracking: Gantt charts allow project managers to track progress in real time. By comparing planned timelines with actual progress, they can identify which tasks are on track and which are delayed. | Focus on deadlines: Gantt charts emphasize deadlines and timelines, which can sometimes lead to a focus on task completion dates over other important aspects like quality or team morale. |
| Task dependencies: Gantt charts clearly show the relationships between tasks, indicating which tasks need to be completed before others can start. This matters in complex environments where 43% of people in highly matrixed organizations report complexity harms decision quality and speed (Marmolejo et al., 2021). | Limited flexibility: Traditional Gantt charts can be rigid, making it difficult to adapt to changes quickly. |
| Enhanced communication: Sharing Gantt charts with teams and stakeholders helps everyone understand the project timeline and their roles. | Resource allocation challenges: Gantt charts show timelines and dependencies but do not inherently address resource allocation conflicts or overloading. |
| Milestone tracking: Gantt charts help mark significant points in the project timeline such as the completion of major phases or key deliverables. | Initial setup time: Creating a detailed Gantt chart can take time initially because it requires careful planning and accurate task estimation. |
Gantt Charts in Project Management
Gantt charts are essential tools in project management, offering a clear visual timeline of a project’s tasks and durations. They help project managers and teams plan, schedule, and track tasks effectively, making sure that projects are completed on time and within scope. By illustrating start and end dates, task dependencies, and key milestones, Gantt charts provide a comprehensive overview of the project’s timeline and progress, making it easy to identify bottlenecks and manage task sequences.
Gantt charts not only track progress but also improve communication and coordination among team members and stakeholders. They do this by clearly displaying the project timeline and individual responsibilities. Gantt charts also help with efficient resource allocation, ensuring that team members and equipment are used optimally. Overall, Gantt charts are essential for maintaining organization, improving communication, and achieving successful project outcomes.
Gantt Chart Best Practices
To make the most of Gantt charts, it’s important to follow best practices that ensure accuracy, clarity, and effectiveness. Here are some key tips:
- Define clear objectives: Start with a clear understanding of the project’s goals and deliverables. This helps in setting a solid foundation for the Gantt chart.
- Break down the project: Divide the project into manageable tasks and subtasks. This makes it easier to assign responsibilities and track progress.
- Set realistic timelines: Assign realistic start and end dates for each task. Consider the availability of resources and potential risks when setting timelines.
- Identify dependencies: Clearly mark task dependencies to show which tasks need to be completed before others can start. This helps in planning the sequence of activities.
- Use milestones: Include key milestones to mark significant points in the project timeline. Milestones help track progress and ensure the project stays on course.
- Regularly update the chart: Keep the Gantt chart up-to-date with the latest project information. Regular updates help in monitoring progress and making necessary adjustments.
- Communicate with the team: Share the Gantt chart with team members and stakeholders. Regular communication ensures everyone is aware of their roles, deadlines, and any changes.
- Use Gantt chart software: Use reliable Gantt chart software that offers flexibility and advanced features. Tools Creately can improve your ability to manage projects effectively.
- Monitor progress and adjust: Regularly review the Gantt chart to monitor progress. Be prepared to adjust timelines, resources, and tasks as needed to address any issues that arise.
- Keep it simple: Avoid overcomplicating the Gantt chart. Focus on essential tasks and milestones to maintain clarity and usability.
Using Creately to Create and Manage Your Gantt Chart
Creating a Gantt chart with a visual collaboration platform like Creately can streamline your project management process. It offers various features to create and manage Gantt charts effectively.
Easy-to-use interface
Creately’s user-friendly interface makes it easy for anyone to create Gantt charts, even without prior experience. You can easily add, move, and adjust tasks using drag-and-drop actions.
Templates and customization
Creately offers a variety of pre-designed Gantt chart templates to help you get started quickly. And you can easily create your Gantt chart with Creately’s advanced Gantt chart or table shape and customize the look of it with different preset color themes, shapes, fonts, and styles to match your project’s needs and preferences.
Collaboration tools
- Real-time collaboration: Team members can collaborate in real-time with synced previews and live mouse tracking, making it easy to work together on the same Gantt chart.
- Comments and annotations: Add comments and annotations with contextual comments to tasks for better communication and clarity among team members.
- Version control: Track changes and revert to previous versions if needed.
- Microsoft Teams integration: Use Creately’s Microsoft Teams plugin to connect and interact with your team as you create and manage your Gantt chart during project planning meetings.
Task management
- Task breakdown: Easily break down your project into tasks and subtasks with clear labels and descriptions.
- Dependencies: Visualize task dependencies by connecting tasks with arrows or lines to show the sequence of activities.
- Milestones: Mark significant milestones in your project timeline with distinct shapes or icons.
- Assign resources: Allocate team members or resources to each task with integrated data fields, ensuring everyone knows and gets notified of their responsibilities.
- Integrations: Creately integrates with various tools and platforms such as Google Drive, Slack, and Confluence, making it easier to incorporate your Gantt chart into existing workflows.
- Export formats: Export your Gantt chart in multiple formats, including PDF, PNG, and SVG, for easy sharing and presentation.
Conclusion
Gantt charts are invaluable in project management, offering a clear and organized view of your project’s timeline and progress. By following the steps and best practices outlined in this guide, you can create a Gantt chart that helps keep your project on track. Don’t forget to use available templates and software to make the process smoother and more efficient.