Understanding the connections in someone’s life, people, services, and systems can reveal key strengths and struggles. Ecomaps give a fuller picture of a person’s support network and stressors. This comprehensive guide to how to create an ecomap explains what to include and how to use it as a meaningful, ongoing support tool in social work, counseling, education, or healthcare.
What Is an Ecomap
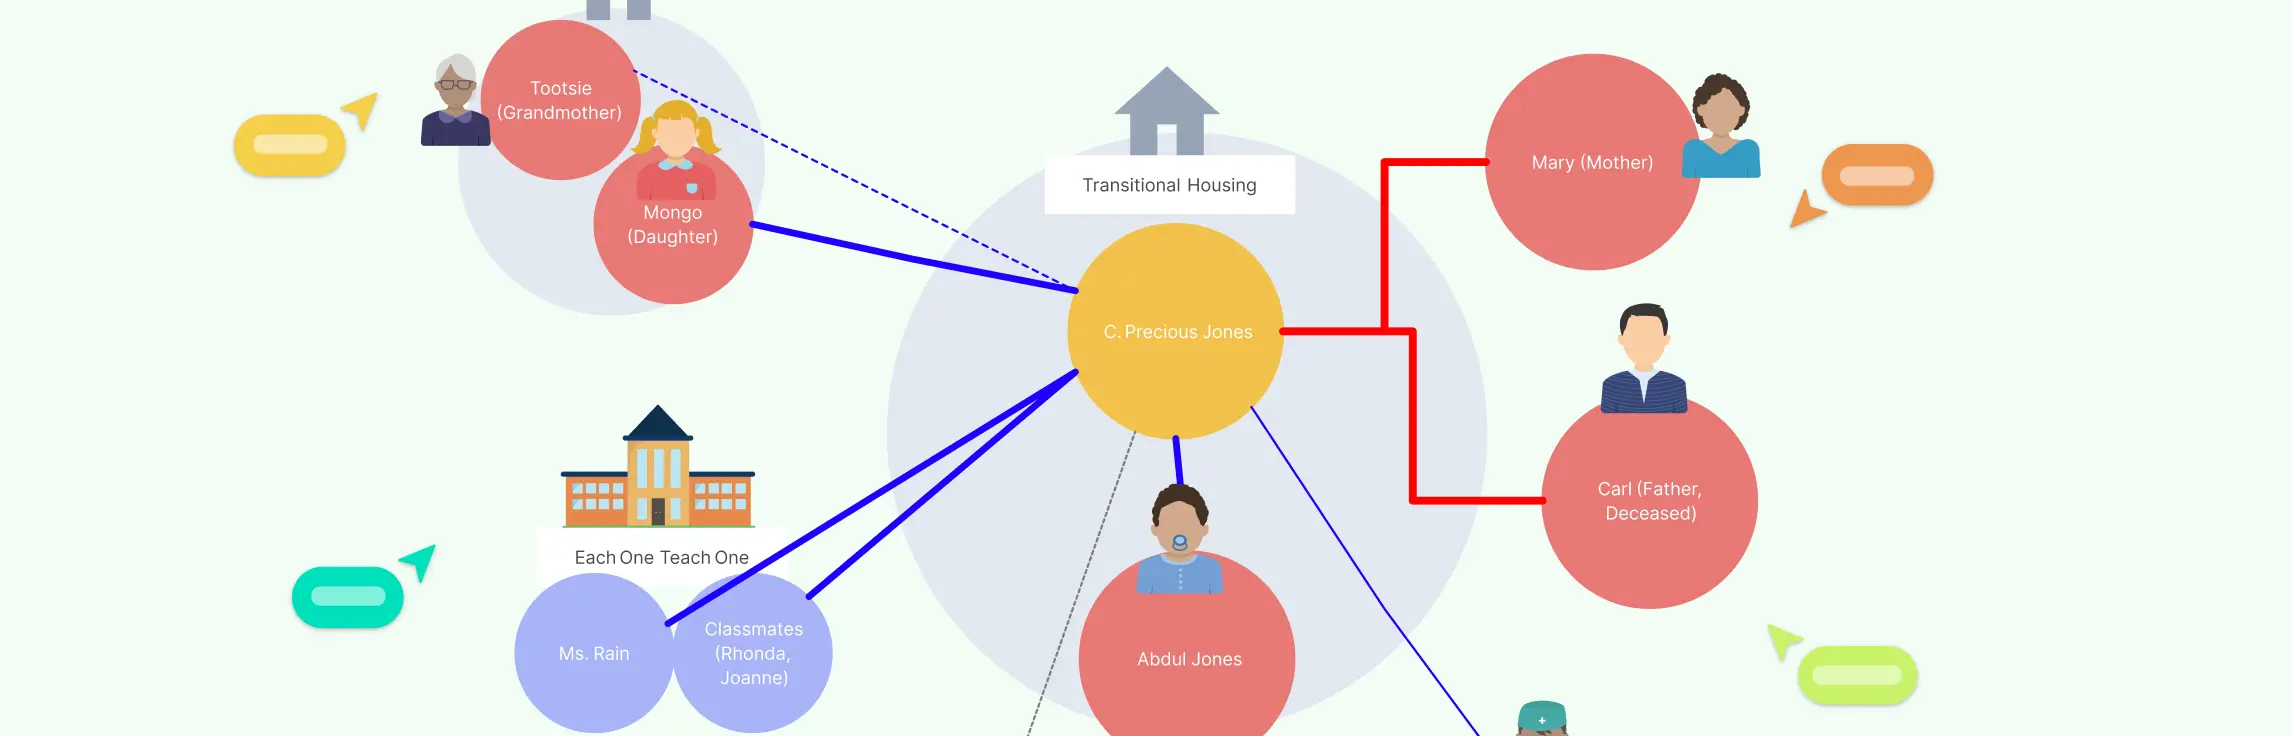
An ecomap is a visual tool that shows a person’s or family’s relationships with the people and systems around them. It helps highlight who supports them, where there might be stress, and how these connections impact their life. It’s often used in social work, counseling, and healthcare to better understand someone’s environment and needs.


How to Create an Ecomap in 6 Steps
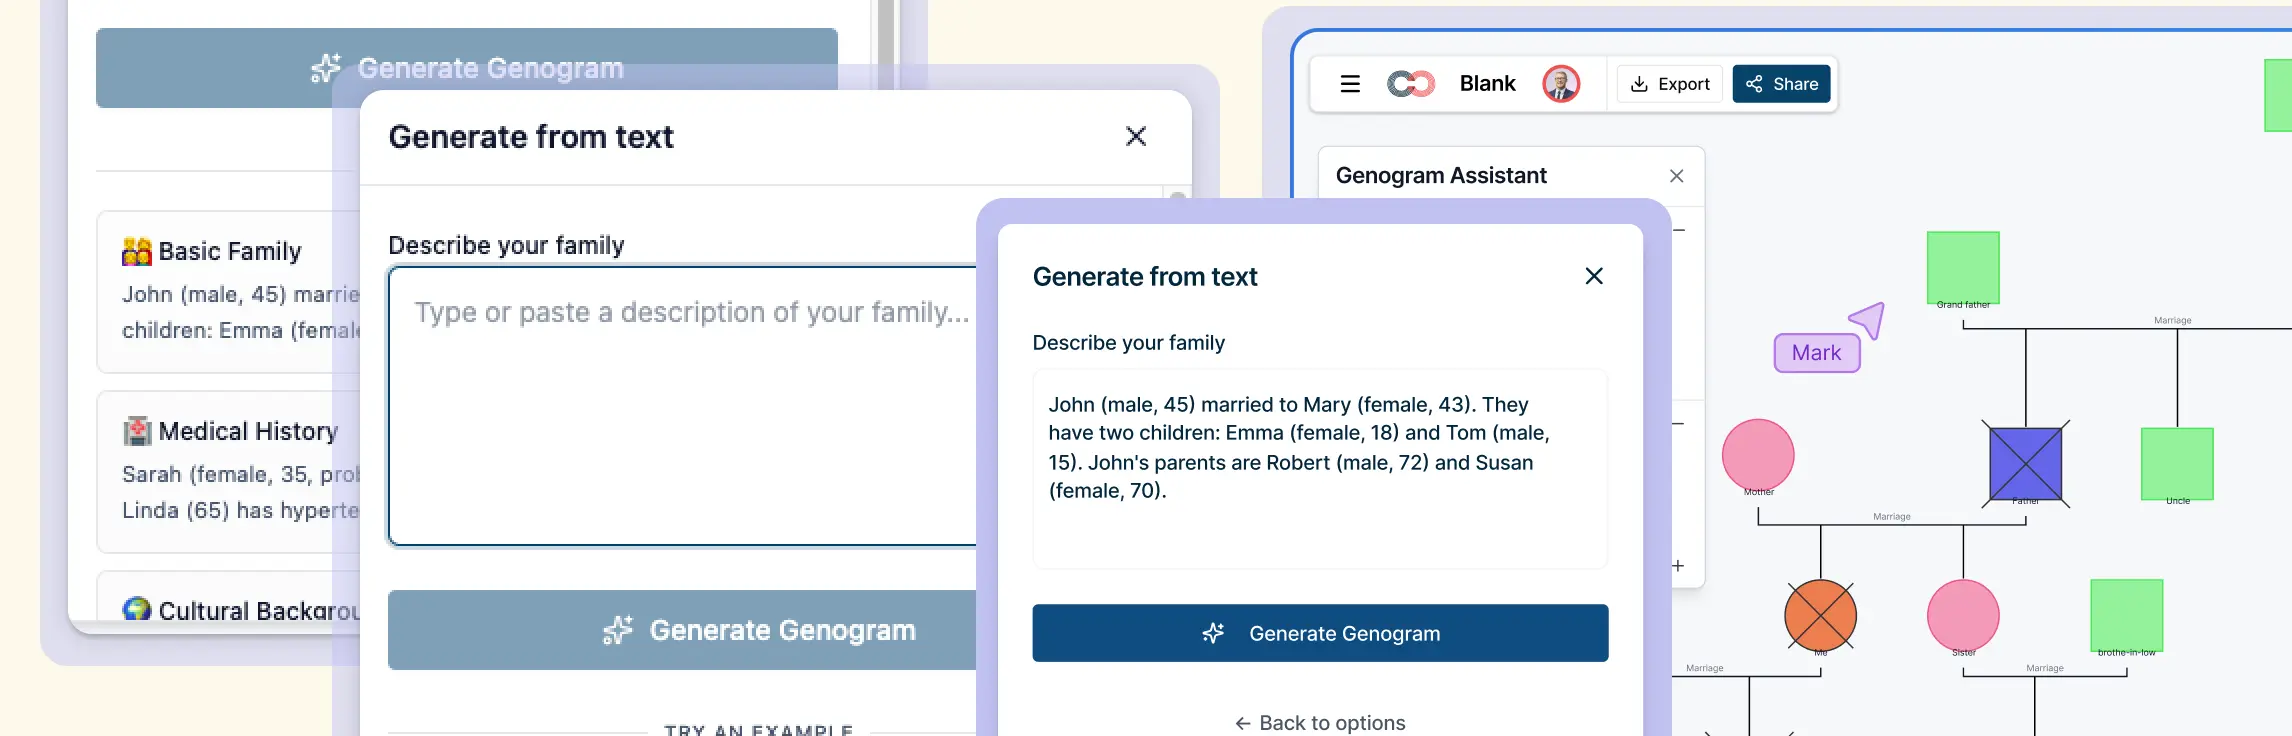
Creating an ecomap might sound complex at first, but it’s really just about visually laying out someone’s key relationships and supports. It helps you understand not just who is in their life, but how those relationships are working. Here’s a step-by-step guide on how to create an ecomap and how to use Creately to do it more effectively:
Step 1. Start with the person or family in the center
Begin by drawing a big circle in the middle of your page. This is the person or family you’re focusing on. Write their name inside the circle. If it’s a family, you can write the names of all the household members.
This central circle is where the story begins — it’s the starting point for understanding the connections that shape their daily life. With Creately’s drag-and-drop smart shapes, you can quickly create a neat, labeled circle to represent the individual or family. No design skills needed.
Step 2. Identify the people, groups, and systems in their life
Now think about who and what plays a role in their world. These are the relationships and systems that surround them — some might offer support, some might create stress, and others might be somewhere in between.
Here are some common examples:
- Close and extended family
- Friends and neighbors
- School, work, or daycare
- Doctors, therapists, or counselors
- Religious groups or spiritual communities
- Social services (like housing support or food assistance)
- Legal or justice systems
- Community centers, clubs, or teams
Draw smaller circles (or symbols) around the center for each of these connections. Try to place them loosely based on how central they are to the person’s life — closer ones might be more involved, while distant ones might play a smaller role.
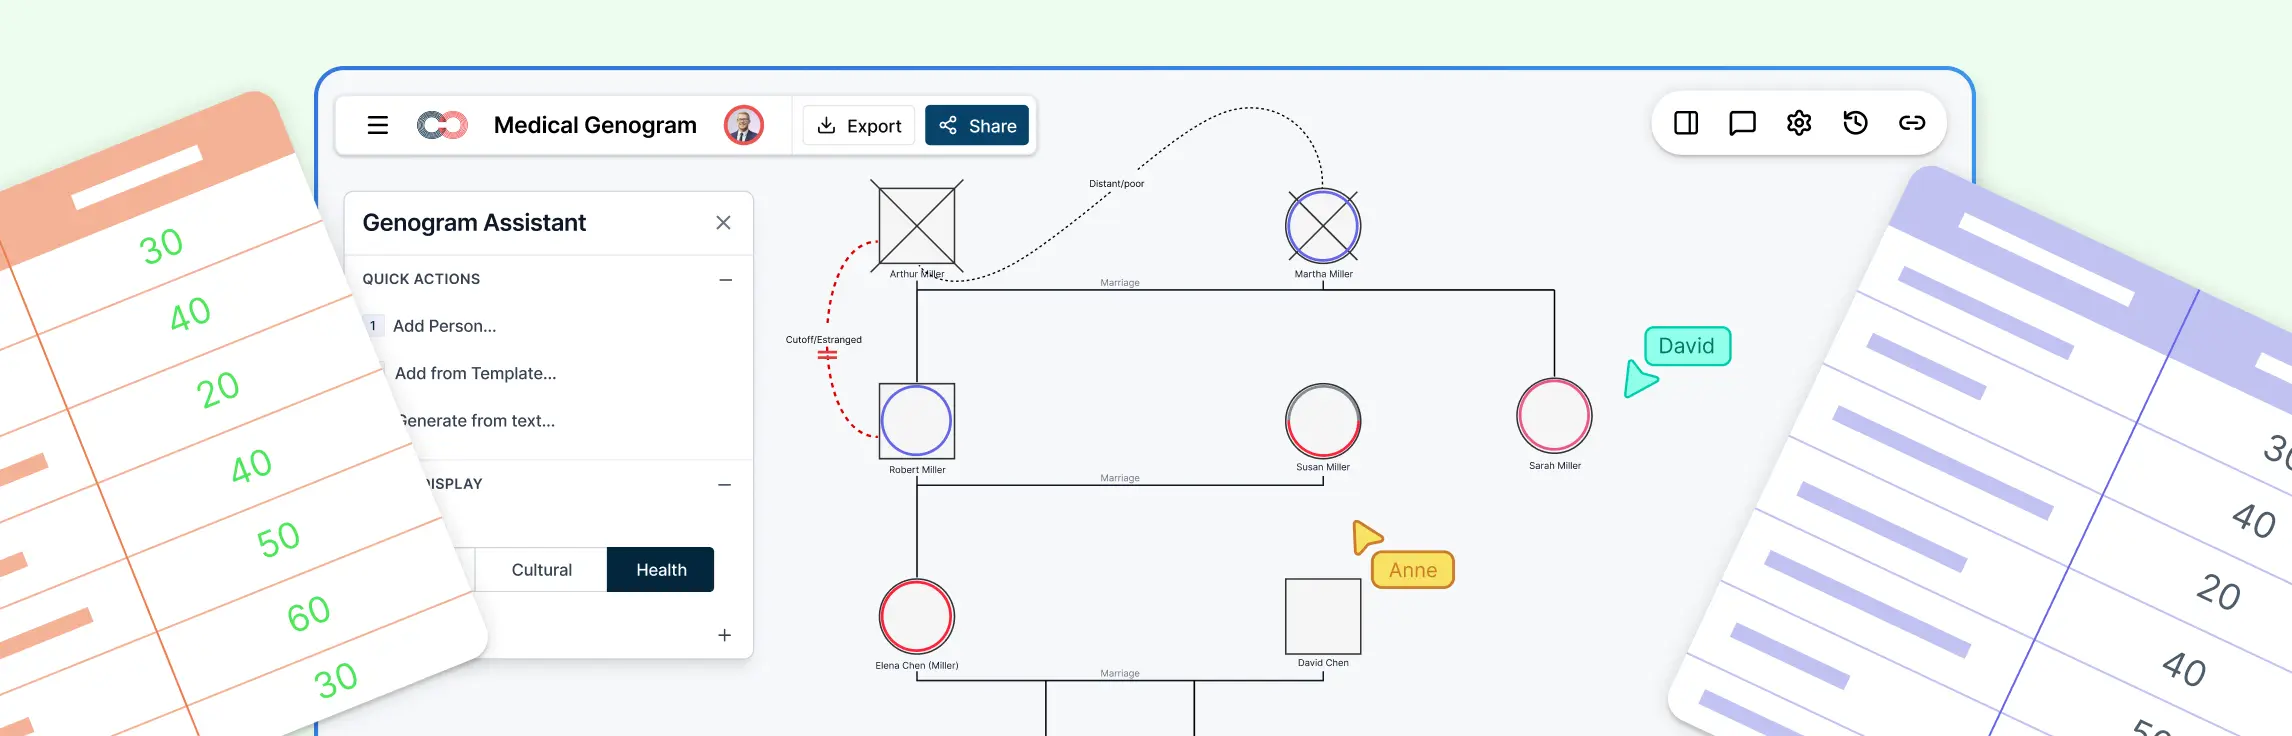
You can use Creately’s infinite canvas and reusable templates to easily arrange people and systems around the central figure. The smart layout tools make organizing everything intuitive — and you can even color-code or group elements visually.

Step 3. Map the relationships with lines
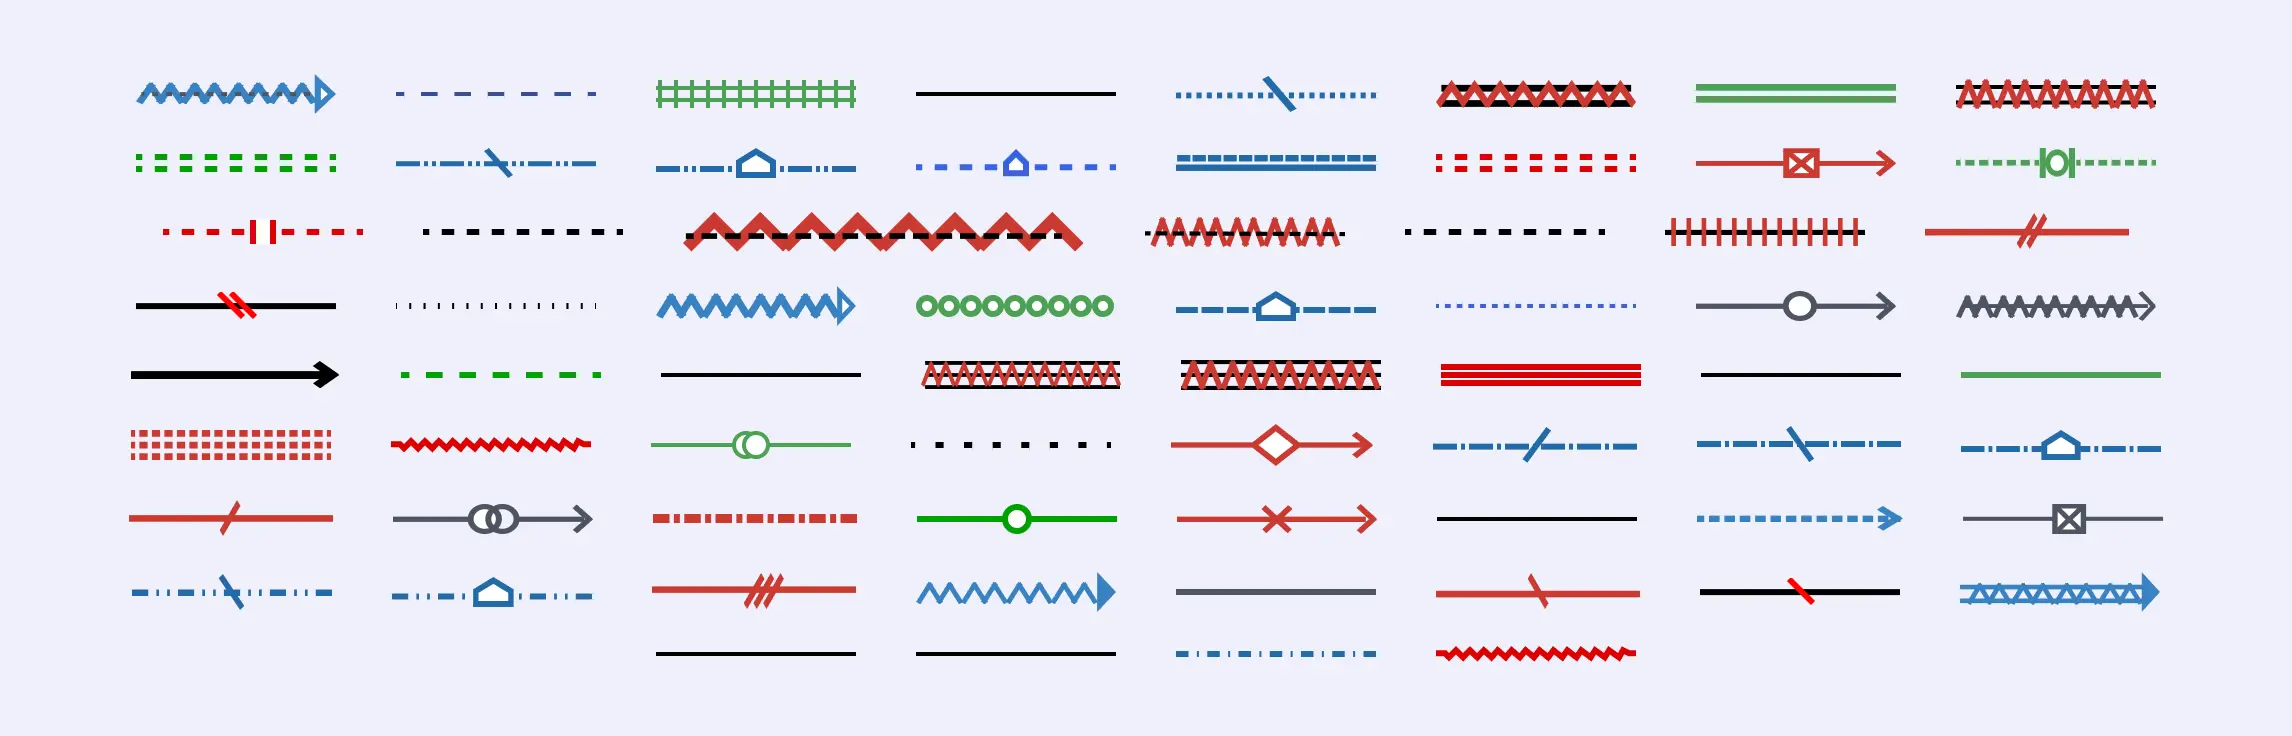
Next, draw lines connecting the center to each of these outer circles. These lines represent the nature of each relationship:
- Solid line: a strong, positive, or supportive relationship
- Dotted line: a weaker, less consistent, or distant connection
- Jagged or zigzag line: a strained, conflicted, or stressful relationship
This part helps you visually understand not just who’s involved, but how those relationships feel — which ones lift the person up and which might be weighing them down.
With customizable line styles, you can use solid, dotted, or jagged lines right from the toolbar. Just click to connect elements, and Creately’s smart connectors snap into place — no messy formatting.

Step 4. Use arrows to show the flow of support
Relationships are rarely one-sided. Add arrows to show where the support is going:
- An arrow pointing toward the central figure means they’re receiving help
- An arrow pointing away means they’re the one giving support
- Two-way arrows show mutual support — a give-and-take relationship
This detail is important because sometimes a person might seem connected to a lot of people, but they’re actually doing all the giving — which can be exhausting if they’re not getting much back.
Arrows are easy to add in Creately, and you can label each connection with notes to give more context. It’s clear, fast, and visual.

Step 5. Add colors or symbols for clarity
To make the map easier to understand at a glance, you can use colors or different shapes:
- One color for professional supports (like doctors or social workers)
- Another for personal connections (like family or friends)
- You might even use symbols to show emotional tone — like a smile for positive connections or a warning sign for tough ones
Just make sure you include a small legend explaining what each color or symbol means. This is especially helpful if the ecomap will be shared with others in a team or support setting.
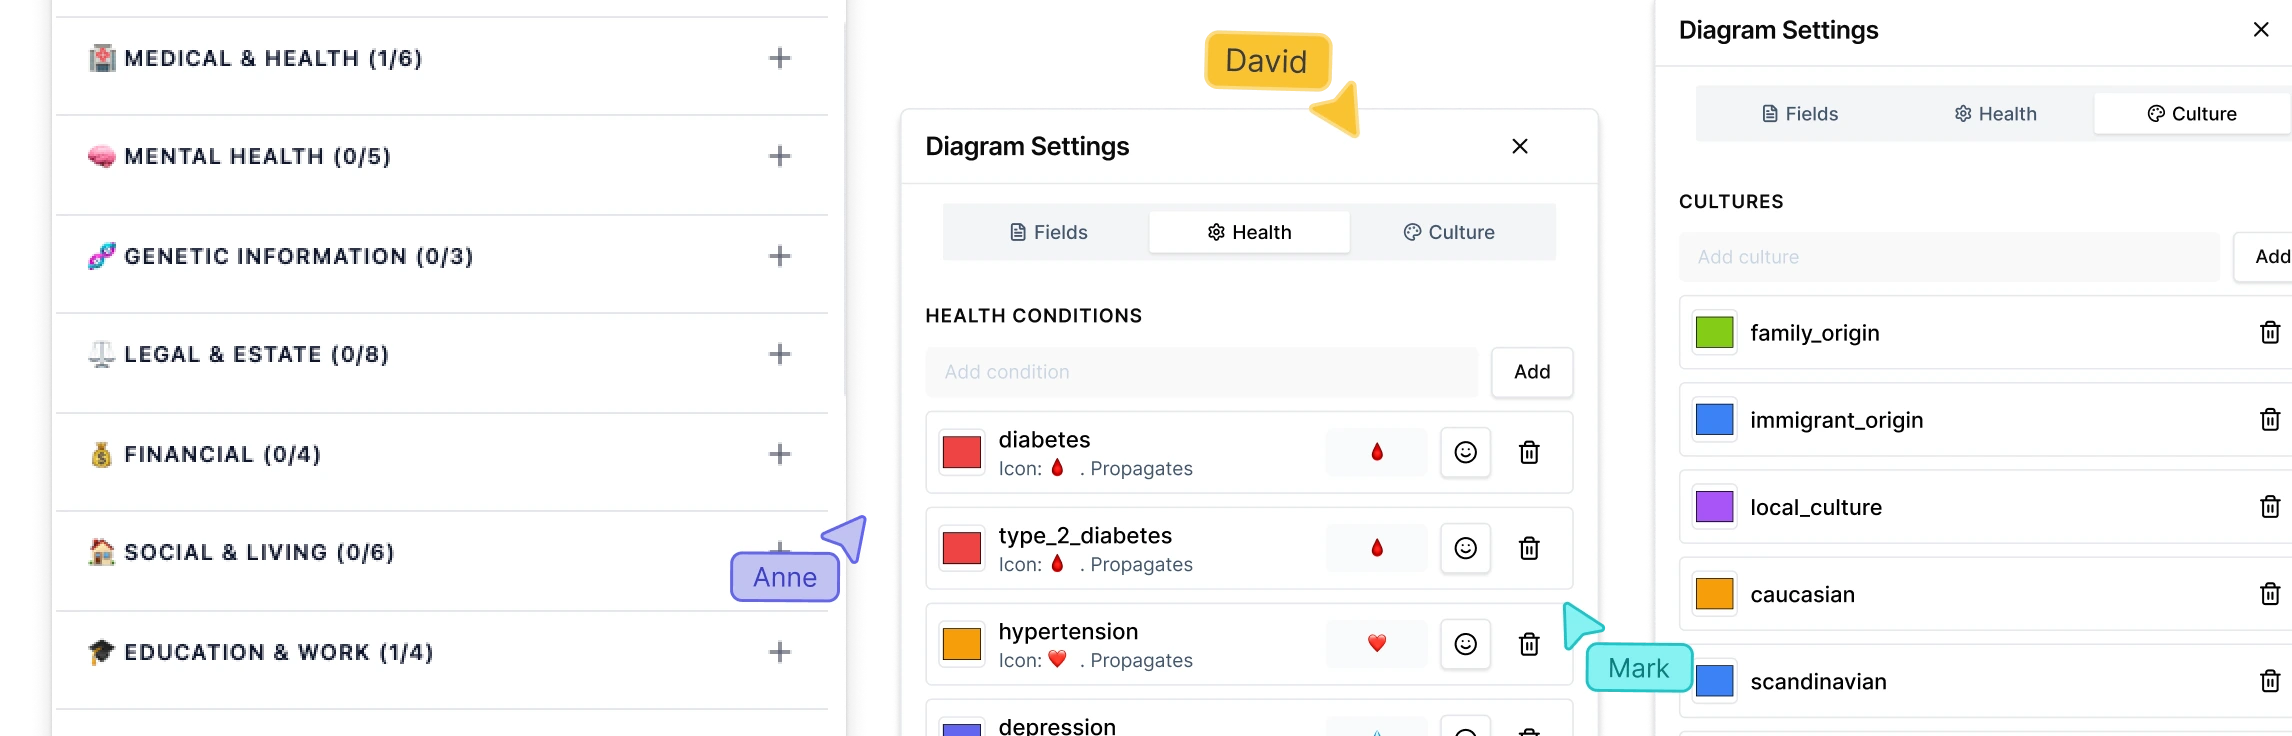
You can customize everything — shape color, line color, emoji icons, and even add a built-in legend using Creately’s visual tools. Templates already come with common color coding, which you can tweak as needed.

Step 6. Review it together — and reflect
If you’re making the ecomap with someone (which is always a good idea), take time to step back and look at it together. You can ask questions like:
- What stands out the most to you?
- Where do you feel most supported right now?
- Are there areas where you feel alone or overwhelmed?
- Is there anyone you wish was more involved in your life?
This conversation can open up space for honesty, reflection, and even healing. It can help someone feel seen — not just in terms of what’s going wrong, but also in what’s going right.
Collaborate in real time, whether you’re in-person or remote with Creately. You and your client (or team) can work on the map together, add comments, or make live updates. It creates a safe and interactive space for shared understanding.
Creately makes creating ecomaps easier, clearer, and more collaborative. It’s built to help you visually map out relationships and systems in someone’s life — without needing design skills or complicated tools. Here’s how Creately’s ecomap maker makes it a great fit for ecomap creation:
Practical Tips for Creating Effective Ecomaps
Creating an ecomap is not just about drawing circles and lines — it’s about understanding someone’s world. Here are some practical tips to help you create ecomaps that are not only accurate but genuinely useful and respectful.
1. Keep it clear and focused
It’s easy to want to include everything, but too much information can make the map confusing. Focus on the connections that truly impact the person’s day-to-day life — the people and systems that support them, stress them, or matter deeply to them. A simple, clear map often says more than a crowded one.
2. Make it a shared process
An ecomap is most meaningful when it’s created with the person, not just about them. Invite them to help you build it. Ask questions, listen closely, and let them guide what feels important. When someone helps create their own ecomap, they often feel more seen — and more involved in shaping their future.
3. Respect culture and perspective
Everyone sees relationships differently, and what feels supportive in one culture might feel overwhelming in another. Be open and respectful to how the person describes their connections — even if it’s not how you’d describe them. Let their voice lead the way, not your assumptions.
4. Treat it as a living tool
Life changes — and so should the ecomap. Encourage the person to update it as new supports come in or old connections shift. What’s true today might not be true next month, and that’s okay. Revisit the map from time to time as part of checking in or planning next steps.
Common Mistakes to Avoid When Creating an Ecomap
Creating an ecomap can be a powerful and eye-opening process — but like any tool, it works best when used thoughtfully. Here are some common mistakes to watch out for, and how to avoid them:
1. Making assumptions
Avoid filling in the map based on what you think is important. Always ask and listen. The person’s experience of a relationship might be very different from how it looks on paper. Just because someone has family nearby, for example, doesn’t mean that support is strong — or even present.
2. Leaving the person out of the process
An ecomap should be made with the person, not for them. If you create it without their input, you might miss key connections or misrepresent the nature of certain relationships. Involving them not only makes the map more accurate — it also makes it more empowering.
3. Ignoring emotional tone
Not all relationships are positive, and it’s important to show that. An ecomap that only shows who’s involved — without showing how those connections feel — gives an incomplete picture. Use lines, colors, or notes to reflect emotional tone, whether it’s supportive, stressful, or somewhere in between.
4. Using overly clinical or technical language
The power of an ecomap lies in its simplicity. Avoid jargon or overly complex symbols that might confuse the person you’re working with. Keep the language and visuals clear, especially if they’ll be looking at or using the map themselves.
5. Forgetting to update it
An ecomap isn’t meant to be a one-time exercise. People’s relationships and environments change — and so should the map. Make it a habit to revisit and revise it over time, especially if you’re using it to guide support or care planning.
6. Treating it as just a formality
If it feels like “just paperwork,” it loses its purpose. Done with care, an ecomap can be a deeply personal and even healing tool. Take the time to sit with the person, explore their world, and use the map to truly understand what’s going on in their life.
References
Ray, R.A. and Street, A.F. (2005). Ecomapping: an innovative research tool for nurses. Journal of Advanced Nursing, [online] 50(5), pp.545-552. doi:https://doi.org/10.1111/j.1365-2648.2005.03434.x.
Saragosa, M., Singh, H., Gray, C.S., Tang, T., Orchanian-Cheff, A. and Nelson, M.L.A. (2023). Use of eco-mapping in health services research: a scoping review protocol. BMJ Open, [online] 13(5), p.e072588. doi:https://doi.org/10.1136/bmjopen-2023-072588.