An entity relationship diagram is a visual representation of the structure of a database. It illustrates how entities (such as people, objects, or concepts) relate to one another within a system. Entity relationship diagrams are essential for designing databases, ensuring data is organized efficiently, and facilitating clear communication among stakeholders.
In this post, we’ll explore how to create an ER diagram and highlight best practices to help you create clear, effective designs.
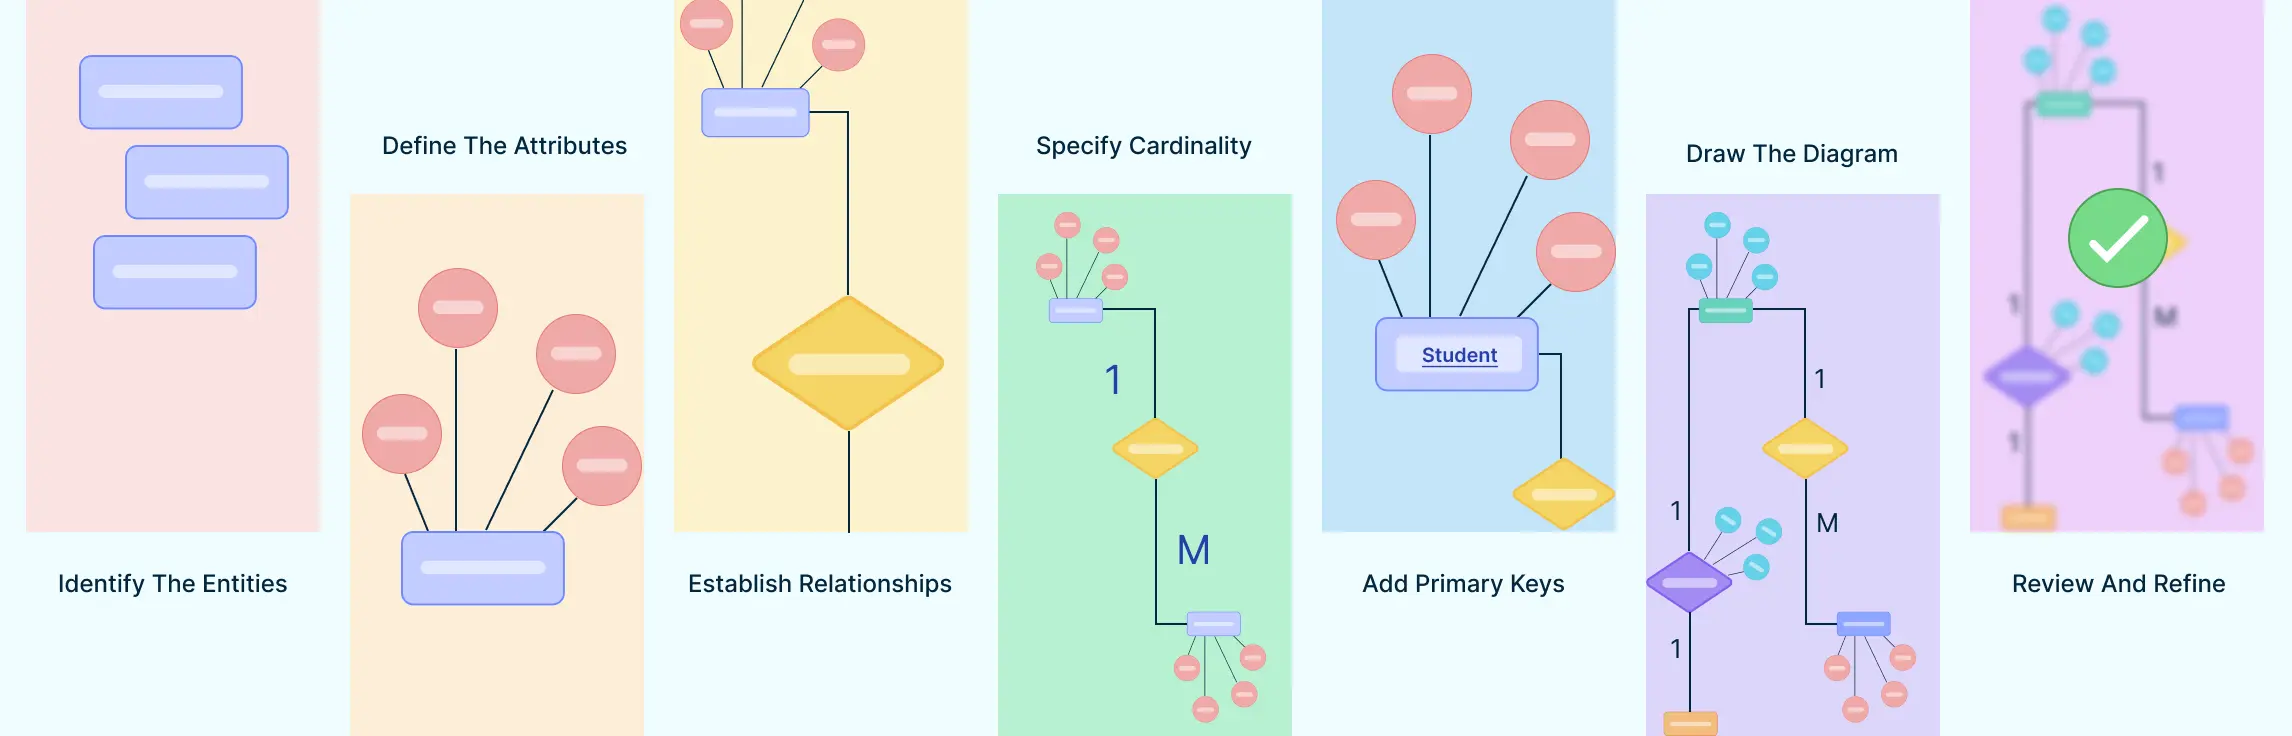
How to Draw an ER Diagram in 7 Simple Steps
Here are the steps you can follow to draw an ER diagram clearly and accurately. By following these steps, you can create a clear and organized diagram that accurately represents the structure of your database.
Step 1. Identify the Entities
Entities are the things or objects that have data stored about them. They are the primary subjects in the system you’re modeling, such as a Person, Place, Event, or Object.
Example:
Imagine you’re creating an ER diagram for a University Database. In this case, some entities might be:
- Student
- Course
- Instructor
- Department
How to identify entities:
- Look at the system or domain you’re modeling and ask, “What are the important objects or concepts that need their own data?”
- Entities are usually represented by rectangles in an ER diagram.
Step 2. Define the Attributes
Attributes are the details or characteristics that describe the entities. They provide more information about an entity. Each entity can have one or more attributes.
Example:
For the Student entity, you might define the following attributes:
- StudentID (a unique identifier for each student)
- Name
- Email Address
- Date of Birth
Attributes are represented by ovals connected to their respective entities.
How to define attributes:
- Consider what information you would need to describe the entity. For example, for a Course entity, you might have attributes like CourseID, Title, and Credits.
- Attributes are often written inside ovals and connected to the corresponding entity with a line.
Step 3. Establish Relationships
Relationships describe how entities are linked to one another. A relationship represents an association between two or more entities. For example:
- A Student enrolls in a Course.
- An Instructor teaches a Course.
How to establish relationships:
- Look for interactions or connections between entities. Ask yourself, “How do these entities relate to each other?”
- For example, a Student and a Course are related through the Enrolls In relationship.
- Relationships are represented by diamonds and connected to entities using lines.
Step 4. Specify Cardinality
Cardinality defines the number of instances of one entity that can be associated with instances of another entity. There are several types of cardinality relationships:
- One-to-One (1:1): One instance of Entity A is associated with one instance of Entity B.
- One-to-Many (1:M): One instance of Entity A is associated with multiple instances of Entity B.
- Many-to-Many (M:N): Multiple instances of Entity A can be associated with multiple instances of Entity B.
Example:
- A Student can enroll in many Courses, but each Course can have many Students. This is a Many-to-Many relationship.
- For a Student and Instructor, one instructor can teach many students, but each student only has one Instructor for a particular course. This is a One-to-Many relationship.
How to specify cardinality:
- Cardinality is typically shown by placing annotations like crow’s feet (for “many”), or using numbers (e.g., 1, N, or M) near the relationship lines.
Step 5. Add Primary Keys
A primary key uniquely identifies each instance of an entity. It’s important to choose an attribute (or set of attributes) that uniquely identifies each record in the database.
Example:
- StudentID might be the primary key for the Student entity because each student has a unique ID.
- CourseID might be the primary key for the Course entity because each course has a unique identifier.
How to add primary keys:
- Underline the attribute(s) that act as the primary key in each entity.
Step 6. Draw the Diagram
At this point, you’ve gathered all the necessary components: entities, attributes, relationships, cardinalities, and primary keys. Now it’s time to draw the ER diagram.
How to draw the diagram:
- Draw a rectangle for each entity.
- Add ovals for each attribute and connect them to the appropriate entity.
- Use diamonds to represent relationships and connect them to the related entities with lines.
- For cardinality, add symbols like crow’s feet or numbers on the relationship lines.
- Underline primary keys.
Example Representation:
Here’s how the components come together:
- Student (rectangle) connected to StudentID (oval) with a line.
- Student (rectangle) connected to the Enrolls In (diamond) relationship.
- The Enrolls In relationship connects to Course (rectangle), with crow’s feet near the Course entity to show a Many-to-Many relationship.
- CourseID (oval) inside the Course entity and underlined to show it’s a primary key.
Step 7. Review and Refine
Once you’ve drawn the diagram, it’s essential to review it for clarity and completeness.
- Check if all entities and relationships are correctly represented.
- Ensure that all primary keys are correctly underlined.
- Verify that cardinalities accurately represent the relationships.
- Simplify any overly complex parts of the diagram for better readability.
ER Diagram Templates to Get Started
If you want to save time or need a little inspiration, using an ER diagram template can be a great starting point. Templates provide a ready-made structure that you can customize to fit your specific needs. Here are some ER diagram templates you can use to get started quickly.
Simple ER Diagram Template


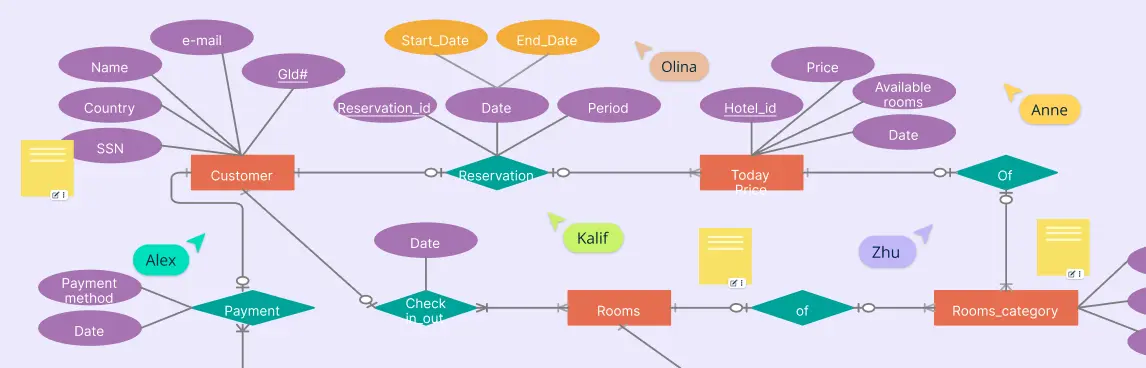
University Database ER Diagram

ER Diagram for Database

Student Management System ER Diagram

ER Diagram for Designing the Library Database

Best Practices for Drawing an ER Diagram
Let’s delve into the best practices for drawing an Entity-Relationship Diagram, focusing on clarity, consistency, and effective communication.
1. Define the Purpose and Scope
Before diving into the diagramming process, it’s crucial to understand the objective of your ER diagram. Are you designing a new database, documenting an existing system, or analyzing data relationships? Clearly defining the purpose ensures that your diagram serves its intended function and meets the needs of its audience.
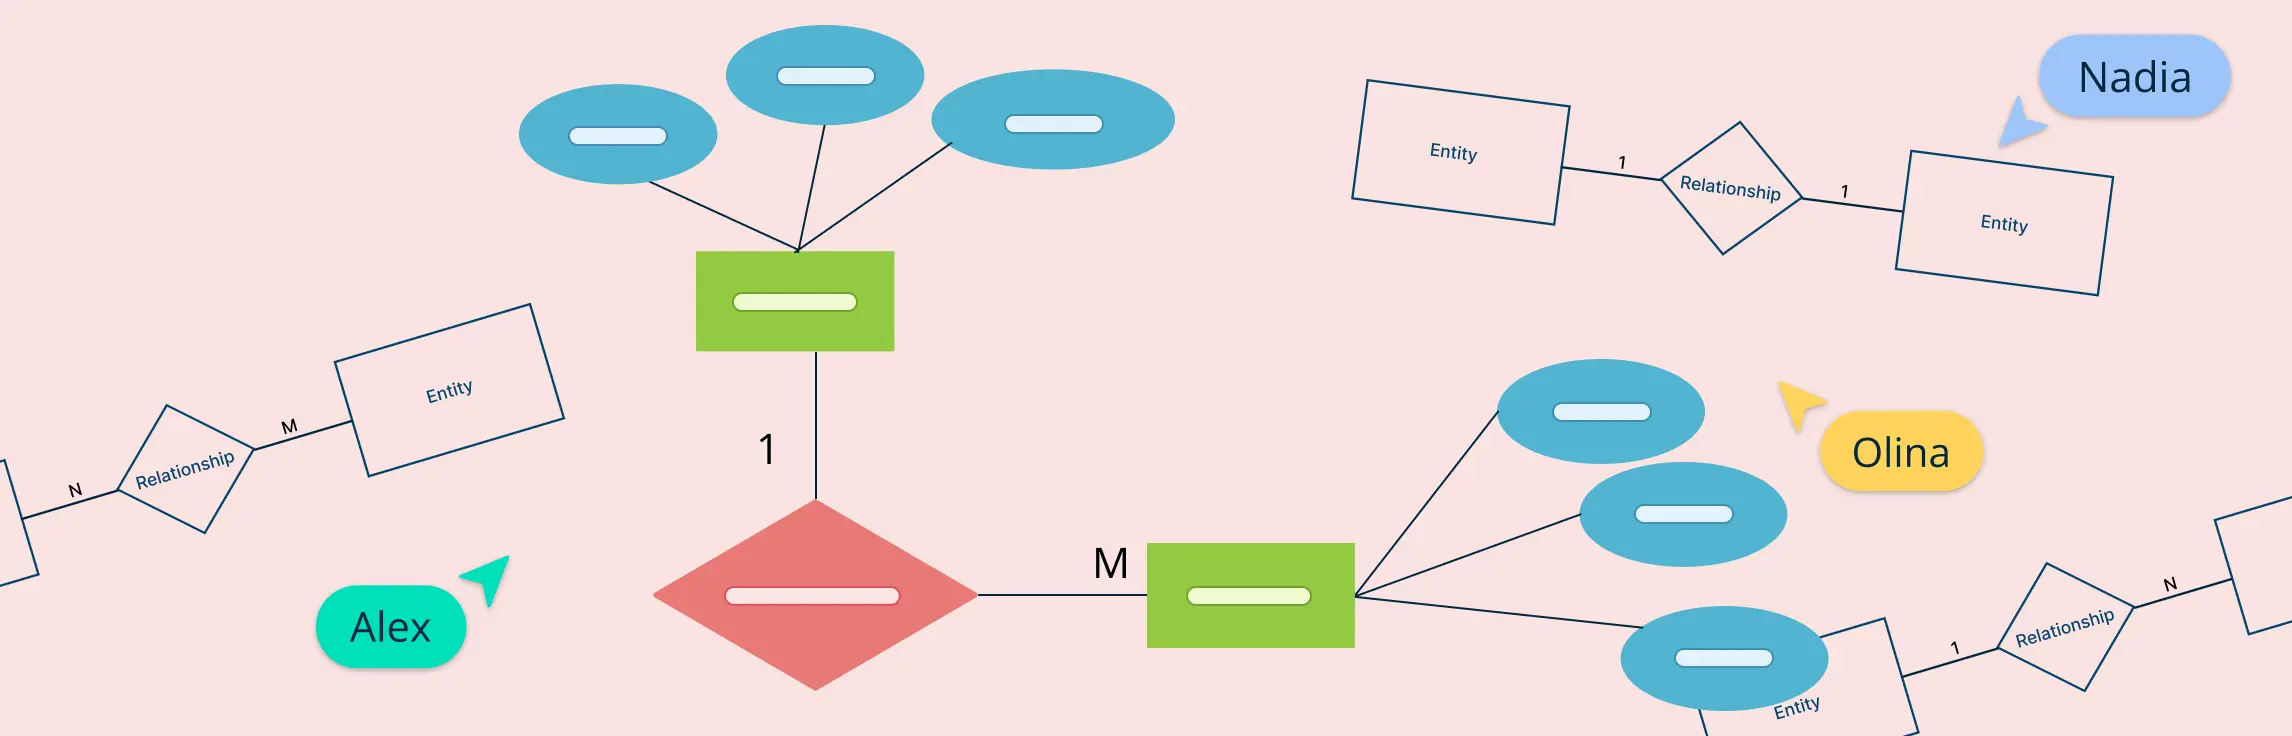
2. Use Standard Notations
Adhering to standard ER diagram symbols and conventions improves the readability and comprehension of your ER diagram:
- Entities: Rectangles
- Attributes: Ovals connected to entities
- Relationships: Diamonds connecting entities
- Cardinality: Crow’s feet, arrows, or lines to denote the nature of relationships
You can choose from several standard notation styles—such as Chen’s notation, crow’s foot (database notation), or UML-style notation. It’s important to pick one and use it consistently throughout your diagram. Mixing different notations can confuse viewers and make your diagram harder to understand.
3. Maintain Proper Alignment and Spacing
Ensure that entities, attributes, and relationships are well-aligned and spaced appropriately. This practice prevents overlapping lines and enhances the overall readability of the diagram.
4. Utilize Color Coding
Color coding can be an effective tool for distinguishing between different types of entities or relationships. For example, you might use:
- Blue for entities
- Green for relationships
- Yellow for attributes
This approach aids in visual differentiation and can make complex diagrams more navigable.
5. Normalize the Diagram
Avoid redundancy by ensuring that your ER diagram adheres to normalization principles. This involves organizing data to reduce duplication and improve data integrity, leading to a more efficient and maintainable database design.
6. Break Down Complex Diagrams
For large and intricate systems, consider dividing your ER diagram into smaller, manageable sections or modules. This modular approach makes the diagram easier to understand and maintain, especially when dealing with extensive databases.
7. Document Assumptions and Constraints
Clearly document any assumptions, constraints, or business rules associated with the entities and relationships. This transparency provides context and ensures that the diagram accurately reflects the system’s requirements.
Common Mistakes to Avoid When Creating ER Diagrams
When drawing an ER diagram, there are several common mistakes that can lead to confusion, errors in database design, or miscommunication. Here’s a list of mistakes to avoid, along with tips on how to avoid them:
1. Overcomplicating the Diagram
Mistake:
Including unnecessary details or trying to represent every possible entity and relationship at once can make the diagram cluttered and hard to read.
How to Avoid:
- Focus on the most essential entities and relationships first.
- Only add details that are necessary to communicate the database structure clearly.
- For complex systems, break the diagram into smaller, more manageable sections.
2. Overloading Relationships with Too Much Detail
Mistake:
Including too many relationships or adding unnecessary entities to your diagram can lead to complexity and confusion. This often occurs when trying to represent every detail of a system that isn’t essential for the database’s purpose.
How to Avoid:
- Focus on key relationships that are crucial to the database structure.
- Avoid excessive detail by breaking the diagram into smaller, modular sections if necessary.
3. Forgetting About Optional Relationships
Mistake:
Failing to represent optional relationships, where one entity may or may not be related to another. For instance, a Customer might not have a ShippingAddress (it can be NULL), which is an important distinction.
How to Avoid:
- Clearly represent optional relationships with a dashed line or other notation to indicate that the relationship is not mandatory.
4. Incorrect Use of Foreign Keys
Mistake:
Not clearly defining foreign keys or incorrectly using them to represent relationships can create confusion and result in broken relationships when the database is implemented.
How to Avoid:
- Foreign keys should be attributes in one entity that refer to the primary key of another entity.
- Clearly indicate foreign keys and ensure they are represented correctly.
5. Failing to Use Clear and Consistent Naming Conventions
Mistake:
Using ambiguous or inconsistent names for entities and attributes, such as vague names like Info, Data, or ID, can lead to confusion and make the diagram hard to interpret.
How to Avoid:
- Use clear, descriptive names for entities, relationships, and attributes.
- Stick to consistent naming conventions (e.g., use CustomerID instead of just ID).
How to Draw an ER Diagram with Creately
Creately’s free ER diagram maker makes it easier to design, collaborate, and refine ER diagrams, whether you’re working alone or as part of a team. Its intuitive tools and advanced capabilities ensure that you can create clear and accurate database designs with minimal effort.
1. Templates for Quick Start
Creately offers pre-built ER diagram templates, allowing users to quickly get started with their design. These templates cover various industries and use cases, so you don’t need to start from scratch. Simply select a template that matches your needs, and you can begin editing right away.
2. Drag-and-Drop Interface
The drag-and-drop functionality in Creately makes it easy to add and arrange entities, attributes, and relationships. You can quickly drag shapes from the shapes library and position them on your canvas, making the diagramming process intuitive and efficient.
3. Extensive ER Diagram Shape Libraries
Creately offers a comprehensive library of ER diagram shapes to match different notation styles. Whether you’re using Chen’s notation with rectangles for entities, ovals for attributes, and diamonds for relationships, or the crow’s foot notation with specialized symbols for cardinality, Creately has the shapes you need. These shapes are easily accessible and can be dragged onto your canvas, helping you build your diagram quickly and accurately using the notation style that best suits your project.
4. Smart Alignment and Spacing
Creately’s automatic alignment and spacing tools help ensure that your diagram is neat and organized. As you move shapes around, alignment guides and snapping features keep your diagram consistent, making it easy to maintain a clean layout.
5. Real-Time Collaboration
Creately’s real-time collaboration feature allows multiple team members to work on the same diagram simultaneously. This is perfect for teams who need to collaborate on database design, as everyone can contribute and make changes in real time.
6. Relationship Drawing Tools
Drawing relationships between entities is simple with Creately’s connector tools. You can easily link entities, and Creately will allow you to define the nature of the relationships (one-to-one, one-to-many, many-to-many) using appropriate visual notations easily with the contextual toolbar. The contextual toolbar lets you set cardinality visually using the correct notation style, such as crow’s feet, without manually adjusting lines or symbols. This simplifies the process and ensures your relationships are accurately and clearly represented.
7. Data Modeling Capabilities
Creately helps you represent complex data models, including entity relationships and constraints, accurately. You can map out intricate relationships and define foreign and primary keys to create a robust database design.
8. Customizable Styling Options
Creately allows you to customize the appearance of your ER diagram by adjusting the colors, fonts, and line styles. This helps differentiate between entities, attributes, and relationships, and you can apply color-coding to highlight specific elements in your diagram.
9. Export and Share Options
Once your ER diagram is complete, Creately makes it easy to export it in various formats, such as PDF, PNG, or SVG. You can also share your diagram directly with others via a link or email, which is useful for presenting or collaborating.
Conclusion: How to Create an ER Diagram
In conclusion, drawing an ER diagram is a crucial step in organizing and structuring your data. By following the right steps and best practices, you can ensure that your diagram accurately represents the relationships between entities and serves as a solid foundation for building your database. With a clear and well-thought-out ER diagram, you’ll set yourself up for a more efficient and organized database design process.
References
Sciencedirect.com. (2016). entity relationship diagram - an overview | ScienceDirect Topics. [online] Available at: https://www.sciencedirect.com/topics/computer-science/entity-relationship-diagram.
Li, Q. and Chen, Y.-L. (2009). Entity-Relationship Diagram. Modeling and Analysis of Enterprise and Information Systems, [online] pp.125-139. doi:https://doi.org/10.1007/978-3-540-89556-5_6.