A KWL graphic organizer is a powerful visual tool that supports active learning by helping students track what they Know, Want to know, and Learned about a topic. Whether you’re teaching science, history, or reading comprehension, KWL charts promote structured thinking, engagement, and better knowledge retention.
In this guide, we’ll explore what makes the KWL chart such an effective teaching strategy, how to use it in the classroom, and how to customize interactive templates to enhance learning across grade levels.
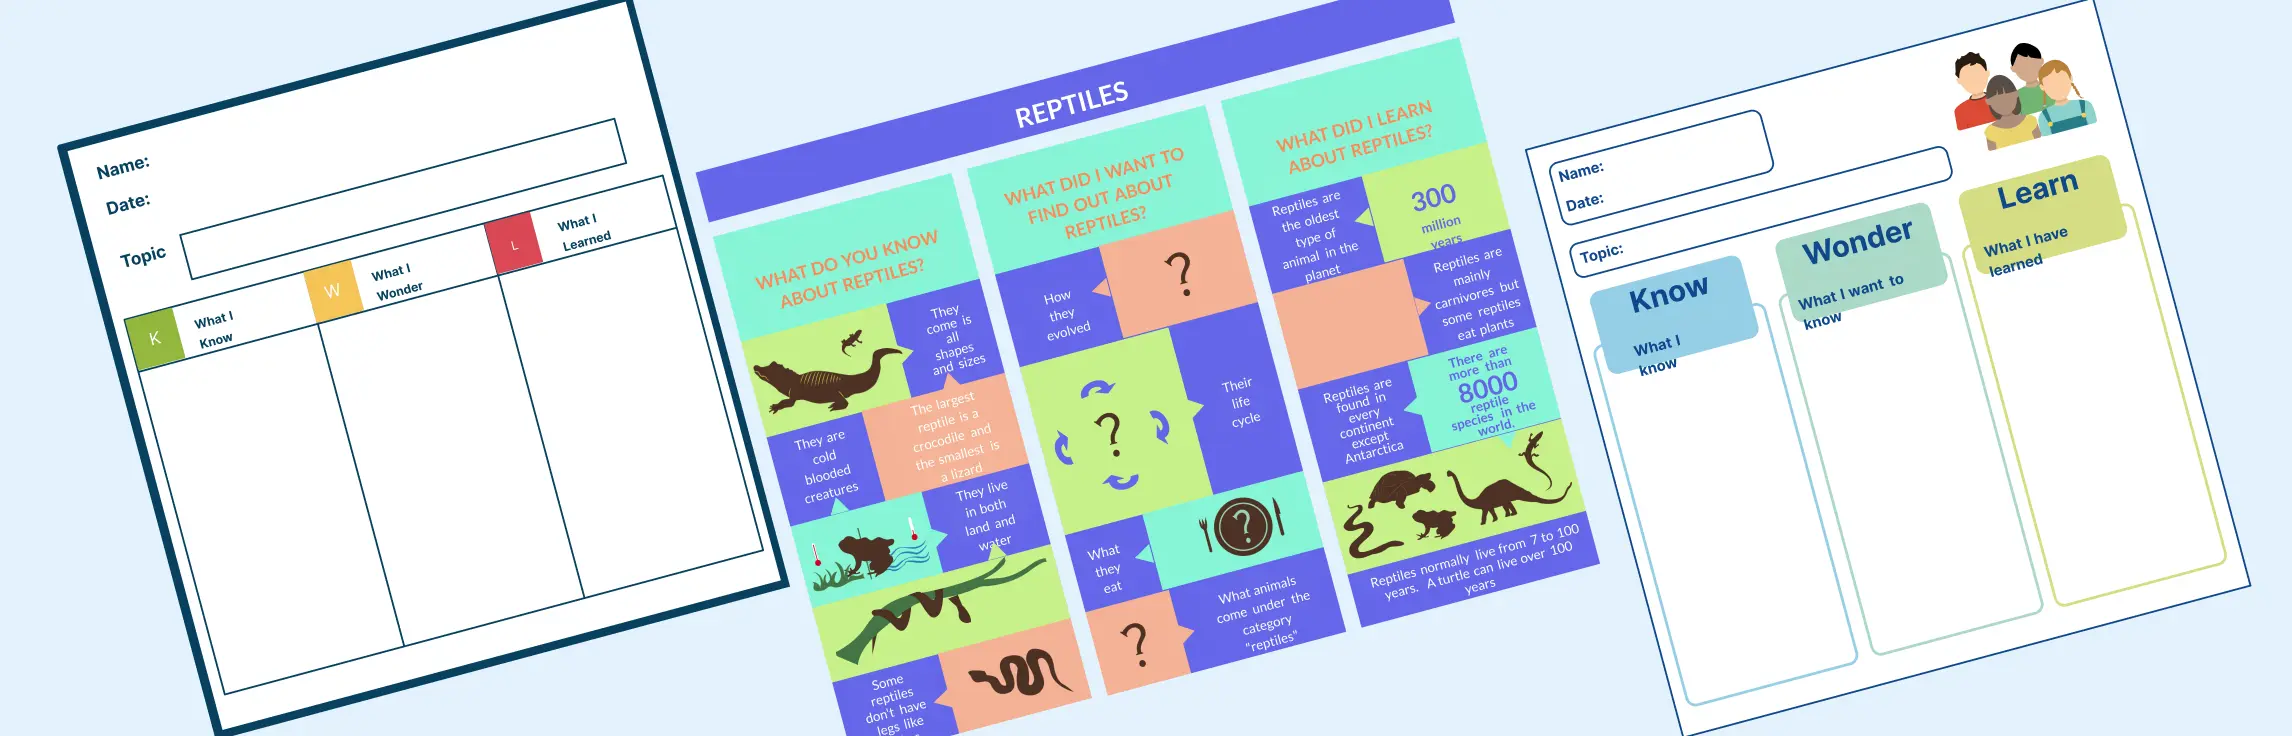
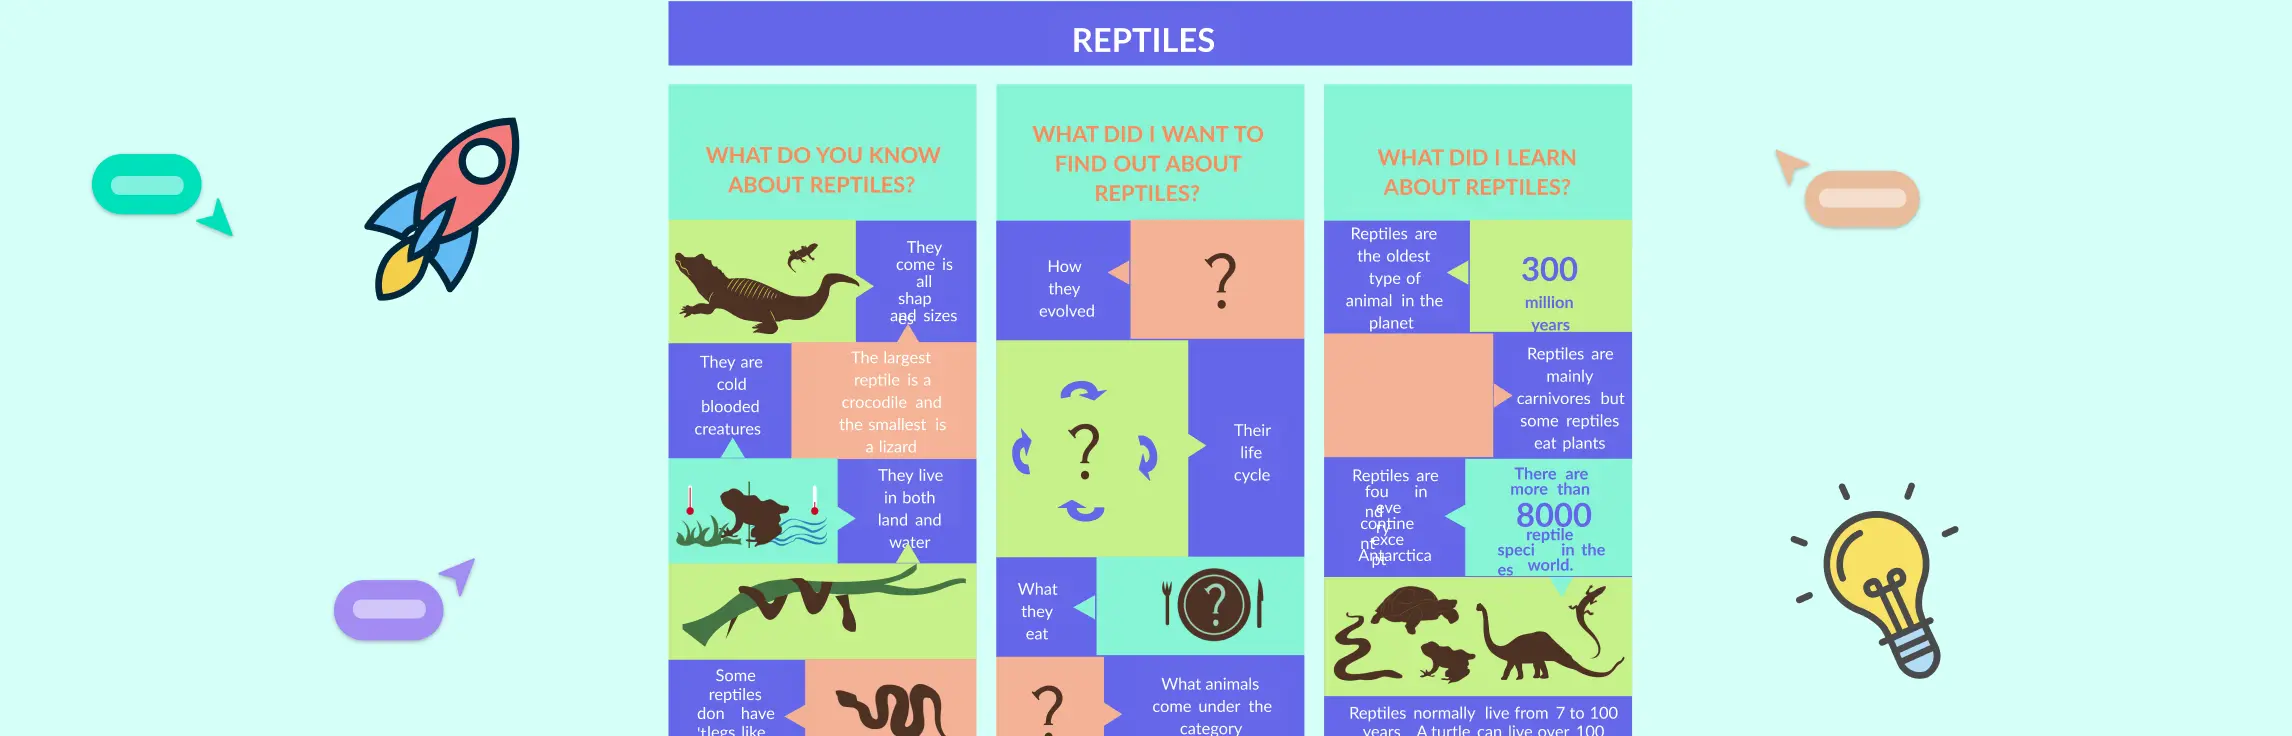
What Is a KWL Graphic Organizer?
A KWL chart graphic organizer divides learning into three phases:
| Column | Purpose |
| K – Know | Document prior knowledge about a topic |
| W – Want to know | List questions or goals for learning |
| L – Learned | Record new insights or facts after learning |
Developed by Donna Ogle in 1986, the KWL strategy builds metacognitive awareness and supports inquiry-based instruction. It’s used before, during, and after lessons to deepen comprehension and encourage student reflection.
Using KWL in Reading and Research
The KWL chart strategy is especially effective for reading comprehension and research projects. Here’s how:
- Reading Lessons: Start by previewing the text and filling in the K and W columns. As students read, they highlight answers and complete the L section post-reading.
- Research Projects: Use the W column to frame research questions and guide investigation. The L column captures discoveries and sources.
With Creately’s live collaboration features, students can:
- Annotate directly on a shared canvas
- Comment on each other’s entries
- Track progress across sessions
KWL Graphic Organizer Examples for the Classroom
Here are ready-to-use templates tailored to different subjects and grade levels:
KWL for Preschool: Farm Animals
Simple KWL chart with visual icons and minimal text for early learners.


KWL for Kindergarten: The Weather
Interactive chart for exploring daily weather with emojis and pictures.

KWL for Elementary: Solar System
Supports inquiry into planets, moons, and space concepts.

KWL for Middle School: Ancient Civilizations
Helps compare prior assumptions with research on historical events.

KWL for High School: Climate Change
A multi-session chart for complex topics and ongoing investigation.

Science KWL Chart: Chemical Reactions
Help students map prior knowledge of chemical changes, set experiment-based questions, and reflect on outcomes like reactants, products, and real-world applications.

Math KWL Chart
Support inquiry in math by exploring what students already understand, what concepts they struggle with, and what strategies they learn through problem-solving.

English KWL Chart: Novel Study
Guide literary analysis by tracking students’ assumptions, interpretive questions, and insights gained while reading novels or short stories.

Vocabulary KWL Chart: Academic Word List
Build academic language skills by identifying known vocabulary, setting goals for word mastery, and recording definitions and usage after learning.

Spanish Language KWL Chart: Conversational Phrases
Support language acquisition by mapping familiar phrases, forming real-life questions, and reflecting on progress in conversational Spanish.

Best Practices for KWL Graphic Organizers
- Color Code Entries: Use colors to categorize questions or themes.
- Assign Checkpoints: Schedule moments during a unit to update the L column.
- Model Entries: Show examples to guide learners on how to ask questions and reflect.
- Encourage Peer Input: Foster discussion around shared and unique W or L entries.
These approaches make the KWL chart method more interactive, reflective, and inclusive.
How to Use the “Learned” Column Effectively
Reflection Prompts for the L Column
After completing research, guide students to distill key takeaways in the Learned column. Ask prompts such as “What surprised you?” and “Which questions remain unanswered?” These reflections encourage deeper processing and metacognitive growth.
- Summarize three new facts or concepts discovered.
- Identify connections between new information and prior knowledge.
- Pose follow-up questions for ongoing exploration.
- Share one insight in a peer-teaching segment.
- Rate confidence in each L entry on a simple scale (1–5).
Export completed charts as PDF or PNG using Creately’s export tools to include in student portfolios. Regularly reviewing these charts reinforces learning retention and tracks progress over time. Integrating portfolio artifacts into lesson planning promotes data-driven instruction and highlights areas for review.
Helpful Resources
Explore the purpose, key benefits, and how to use KWL Charts effectively with ready-to-use templates. Boost learning through structured inquiry.
Discover how the KWL strategy boosts learning, reading, and test prep. Includes chart examples, visual templates, and tips for effective implementation.
Explore 15 KWL chart examples for preschool to high school, corporate training, and subject-specific learning.
Explore the top KWL benefits for learners. Learn how KWL charts promote reflection, engagement, and goal-setting. Includes templates for easy classroom use.
Incorporating KWL into Lesson Planning
Incorporate a graphic organizer KWL chart seamlessly into lesson outlines by following these guidelines:
- Embed KWL chart templates directly into digital lesson plans for consistency.
- Allocate specific timeframes for each column activity (e.g., 5 minutes for K, 10 minutes for W, 15 minutes for L).
- Align chart outcomes with learning objectives and curriculum standards to ensure relevance.
- Share templates with co-teachers or substitutes via Creately to maintain pedagogical continuity.
- Collect feedback and continuously refine templates based on student performance and input.
The KWL graphic organizer is more than a classroom tool—it’s a learning strategy that fosters curiosity, reflection, and ownership. Whether you’re teaching young students or supporting adult learners, this simple structure helps make thinking visible and research purposeful.
By leveraging digital templates and visual collaboration tools like Creately, you can enhance your lesson delivery, track learning in real time, and promote deeper understanding in any subject area.
Resources:
Husnaini, H. (2018). THE EFFECTIVENESS OF KNOW –WANT-LEARN (KWL) STRATEGY IN TEACHING READING COMPREHENSION. IDEAS: Journal on English Language Teaching and Learning, Linguistics and Literature, 6(2). doi:https://doi.org/10.24256/ideas.v6i2.512.
Jstor.org. (2024). K-W-L Plus: A Strategy for Comprehension and Summarization on JSTOR. [online] Available at: http://www.jstor.org/stable/40031872.
Usman, B., Fata, I.A. and Pratiwi, R. (2019). TEACHING READING THROUGH KNOW-WANT-LEARNED (KWL) STRATEGY: The effects and benefits. Englisia Journal, 6(1), p.35. doi:https://doi.org/10.22373/ej.v6i1.3607.
FAQs About KWL Graphic Organizers
Can KWL graphic organizers be used for subjects beyond reading and science?
How do digital KWL graphic organizers improve student engagement?
What age groups benefit most from using KWL charts?
How can teachers assess student understanding using KWL charts?
Is it necessary to complete all three columns in every lesson?
Not always. Depending on the lesson goals, educators may focus on just one or two columns (e.g., K and W before a unit), and revisit others later to suit pacing and learning objectives.
this one slight change in a direction. We’ll have to do this template listicle style or add more templates to this one.