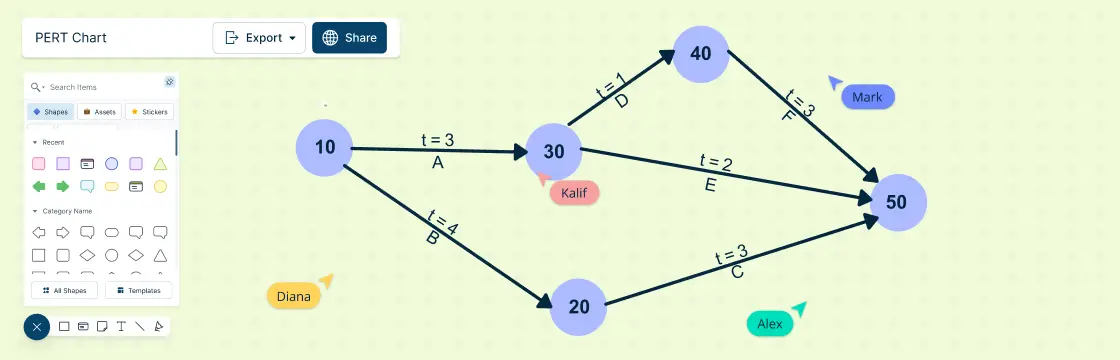
A PERT chart is a graphical tool that helps you visualize the tasks, dependencies, and milestones of your project. In this blog post, we’ll explain what a PERT chart is, how it originated, what it can be used for.
A PERT chart is a graphical tool that helps you visualize the tasks, dependencies, and milestones of your project. In this blog post, we’ll explain what a PERT chart is, how it originated, what it can be used for.
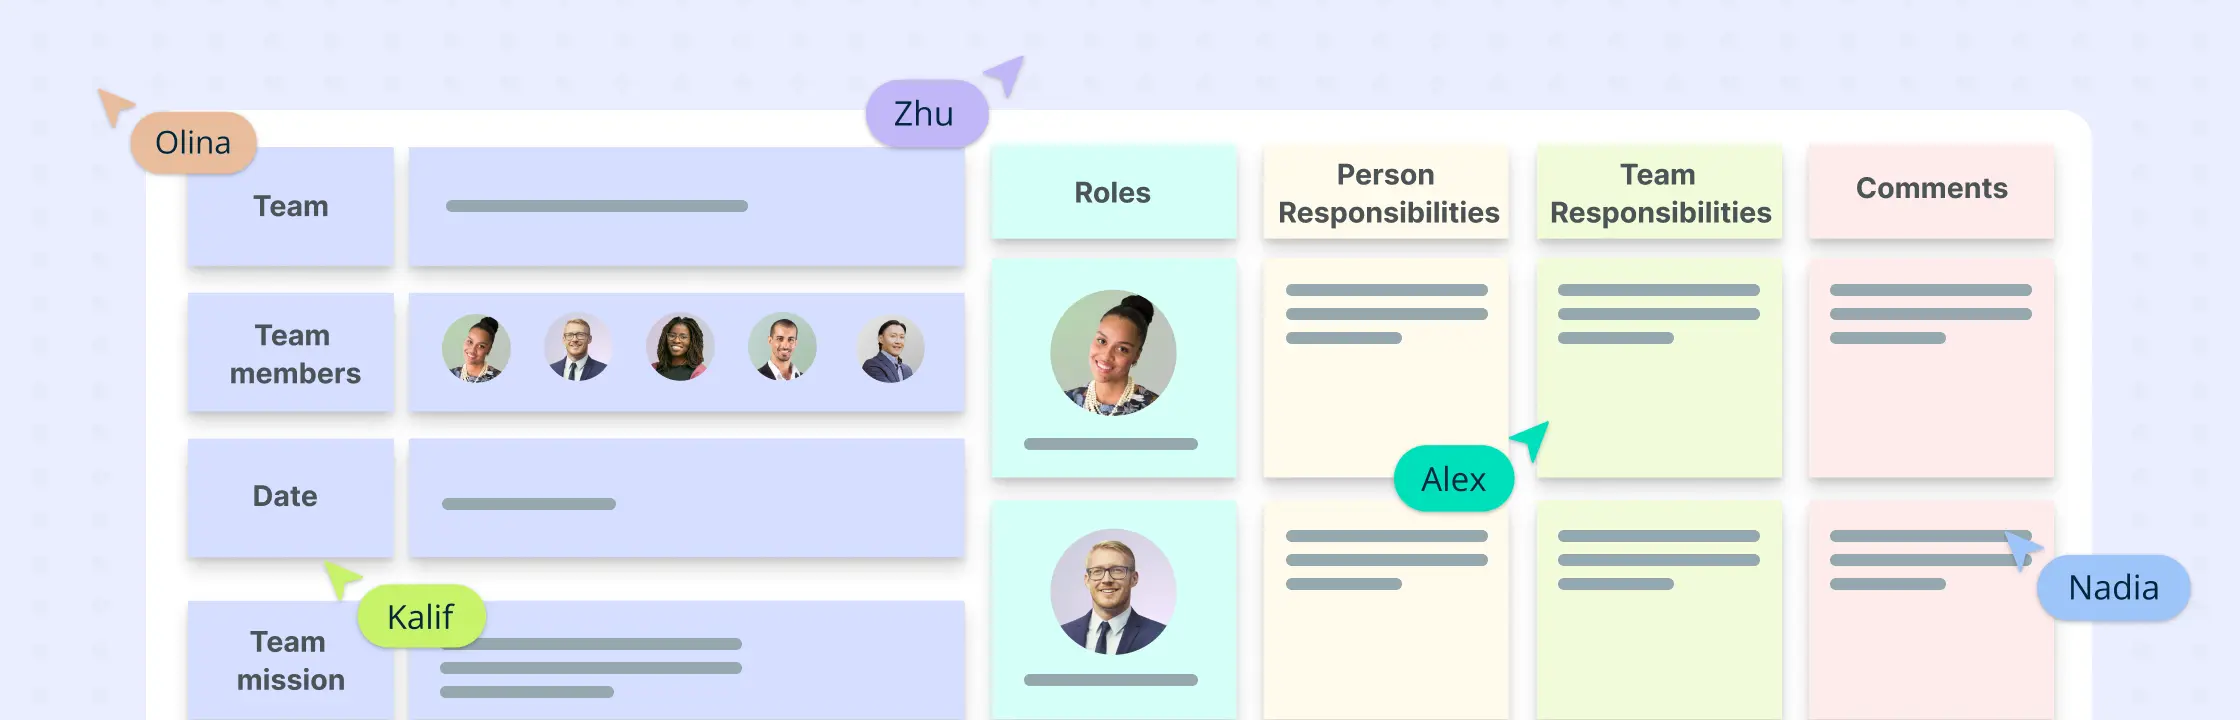
Trying to accomplish a collective goal without clearly defined roles and responsibilities is like sailing a ship with a captain or crew. Everyone is pulling in different directions, the sails are tangled, and the compass is missing. Similarly, when you try to get something done without clear roles and responsibilities, chaos ensues, just like how the ship drifts aimlessly, unable to reach its destination.
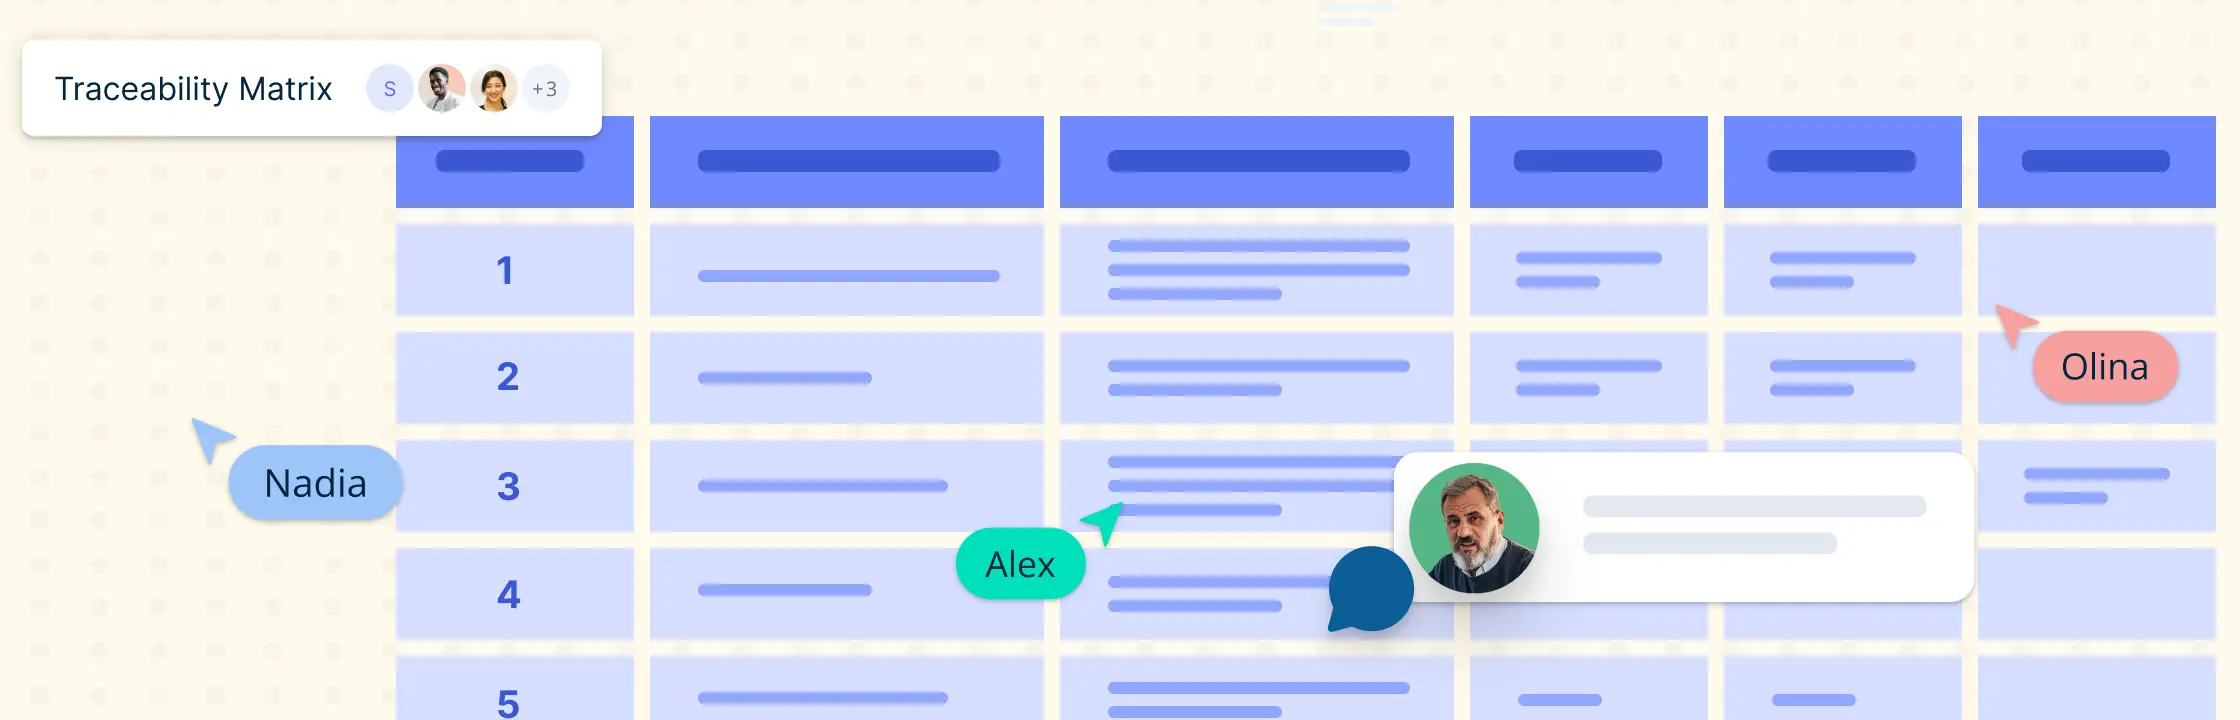
In this blog post, we delve into what an RTM is, how to create one and how it helps run projects successfully.