A timeline is a visual way to display events or tasks in the order they occur, helping you quickly understand how things progress over time. Whether you’re mapping historical events, planning a project, or organizing ideas, knowing the different types of timelines can make your work clearer and more effective. In this guide, we’ll explore the main types of timelines, their uses, and how you can easily create them using a visual tool like Creately.
What Is a Timeline
A timeline is a visual representation of events arranged in chronological order. It helps you see how things unfold over time, making it easier to understand sequences, relationships, and progress. Timelines are used in many contexts—from illustrating historical events to tracking project milestones or personal goals.
Key Criteria for Differentiating Timeline Types
Layout and orientation: Timelines can be horizontal, vertical, circular, or branching, depending on how you want to display information.
Purpose or use case: The design varies based on what it’s for — historical timelines, project plans, personal milestones, or process visualizations.
Static vs interactive: Some timelines are simple and static, while others are dynamic and allow users to explore more details.
Duration and granularity: Short timelines with a few key events differ from long ones covering extended periods or dense data.
Visual style or structure: Types of timeline graphs can take the form of bar charts, roadmaps, or creative non-linear designs.
Choosing the right type: The best timeline depends on your goal — whether you want to track progress, explain a sequence, or visualize complex information.
Different Types of Timelines
Based on layout and structure
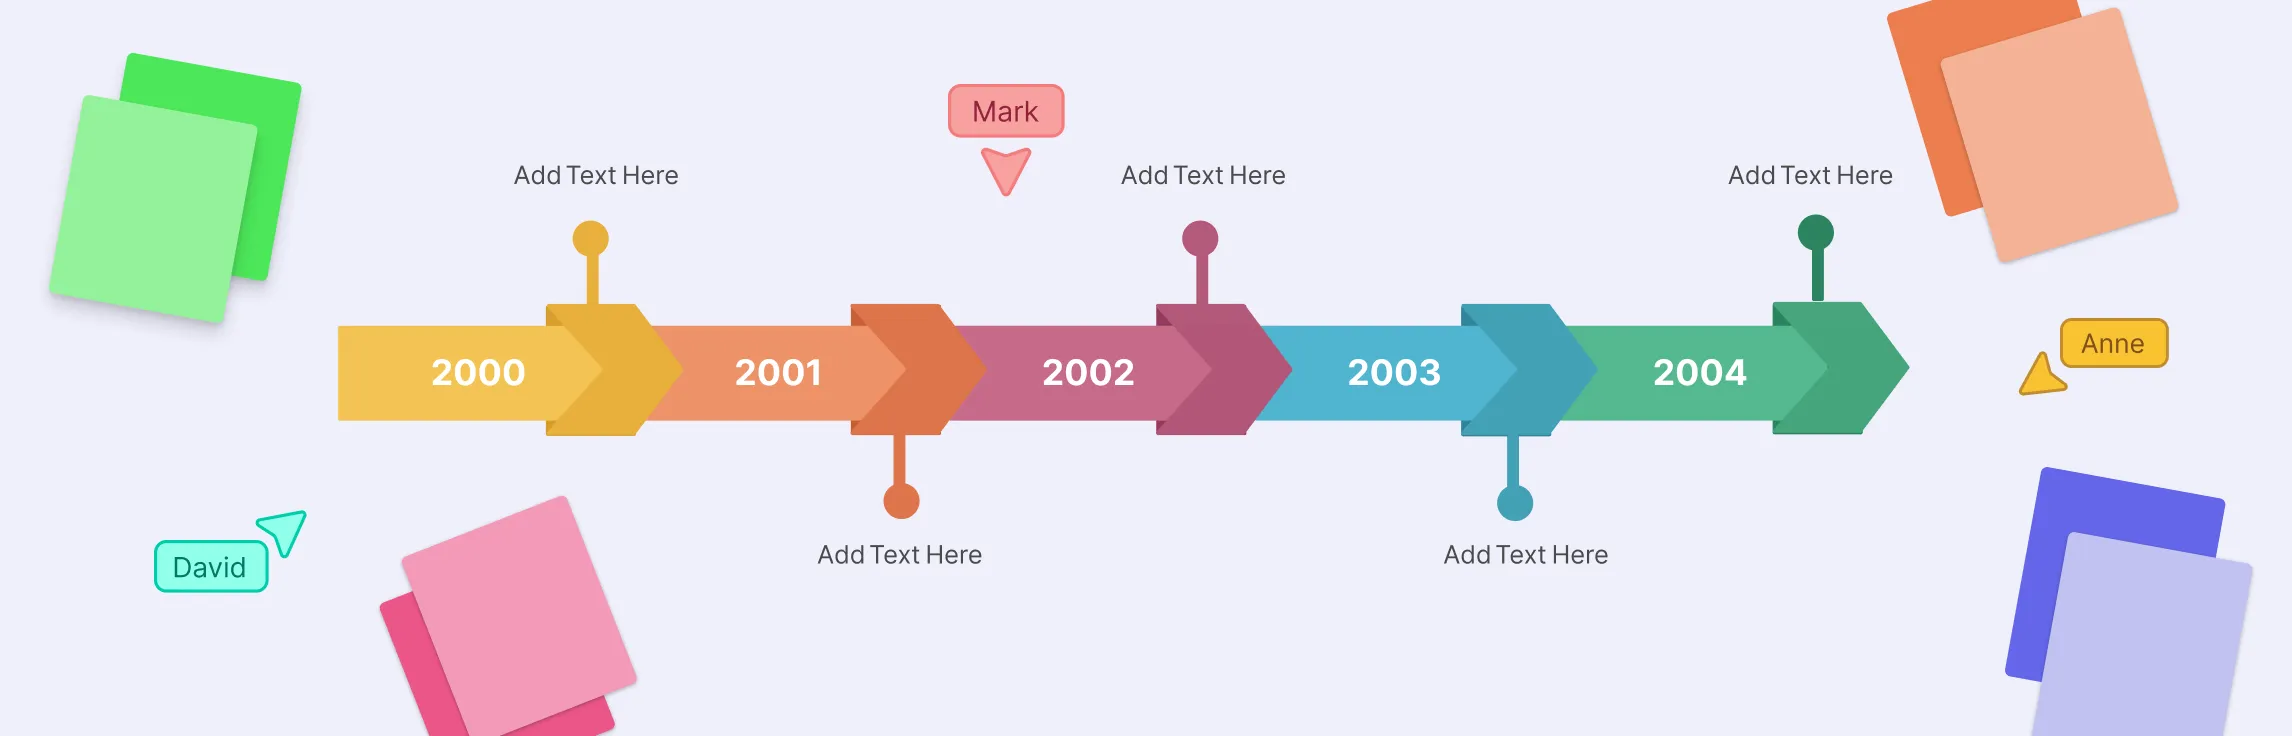
1. Horizontal timeline
A horizontal timeline displays events in a straight line from left to right, representing the passage of time visually and sequentially. This format works best when there’s a clear start and end point and you want to highlight the progression of milestones or key moments over a defined period.
Use cases: Historical timelines, process steps, project phases, or storytelling sequences.
Pros: Easy to read and understand; ideal for presentations and digital viewing; visually simple and linear.
Cons: Space limitations can make it difficult to include detailed descriptions or many events.


2. Vertical timeline
A vertical timeline arranges events from top to bottom, offering a compact way to display information when horizontal space is limited. It’s often used for scrolling web layouts or print designs, making it a popular format for resumes and infographics.
Use cases: Career timelines, company histories, academic milestones, or chronological blog posts.
Pros: Fits narrow or mobile layouts; visually modern and engaging; allows flexible spacing between items.
Cons: Can make it harder to compare events side by side or track long time spans.

3. S-shaped timeline
The S-shaped or snake timeline bends the flow of time in a curving pattern, often used to fit more information into one visual space while maintaining chronological order. It’s eye-catching and ideal for creative or educational content where visual interest matters as much as clarity.
- Use cases: Infographics, product journeys, creative presentations, or visual storytelling.
- Pros: Unique and visually appealing; uses space efficiently; draws attention to key milestones.
- Cons: Chronological order can be harder to follow; not suitable for dense or data-heavy information.

4. Circular timeline
A circular timeline arranges events around a circle or spiral, visually representing cycles or repeating patterns. It’s often used when the timeline depicts ongoing processes or themes that loop back to the beginning, such as life cycles or annual events.
- Use cases: Product life cycles, academic years, business planning cycles, or scientific processes.
- Pros: Excellent for showing repetition or cyclical processes; visually distinctive and engaging.
- Cons: Reading order can be confusing; not ideal for long, detailed timelines.

Based on purpose and use case
5. Roadmap timeline
A roadmap timeline presents long-term goals, milestones, and strategies in a forward-looking layout. It’s widely used in business and product management to outline how objectives will be achieved over time. Typically divided into phases or quarters, it helps align teams and stakeholders on shared priorities.
Use cases: Product roadmaps, business strategy plans, marketing campaigns, or feature rollout schedules.
Pros: Clarifies direction and timelines for strategic initiatives; great for aligning teams.
Cons: Requires frequent updates to stay relevant; less effective for documenting past progress.

6. Gantt chart timeline
A Gantt chart timeline combines a time axis with horizontal bars representing tasks, their duration, and dependencies. Gantt charts are one of the most widely used formats in project management, offering a detailed view of how work is scheduled and progressing.
Use cases: Construction, software development, research projects, or event planning.
Pros: Displays timelines, dependencies, and workloads clearly; great for managing complex projects.
Cons: Can get complicated as projects grow; may require specialized software to create and maintain.

7. Project timeline
A project timeline highlights key milestones, deliverables, and deadlines across the lifecycle of a project. Unlike a full Gantt chart, it focuses more on the sequence and timing of high-level events rather than detailed task breakdowns.
Use cases: Internal project tracking, client updates, or project status presentations.
Pros: Simple and clear; gives quick insight into project progress and upcoming goals.
Cons: Lacks detail on individual tasks or dependencies; limited for complex projects.

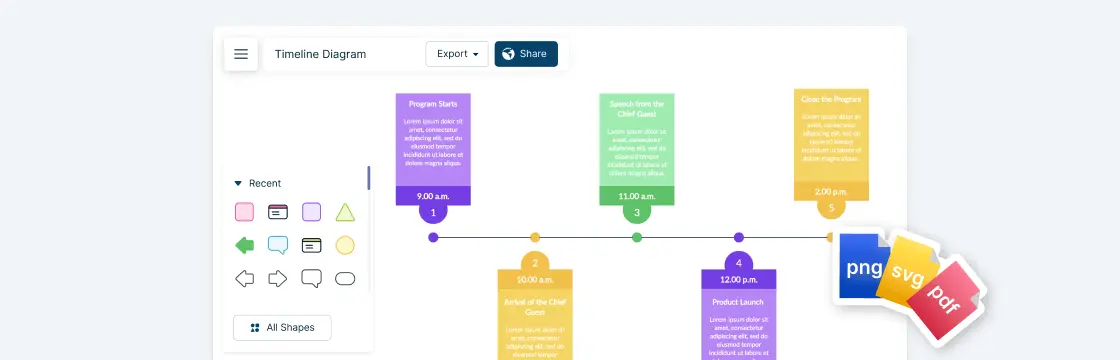
8. Event timeline
An event timeline visually maps out the sequence of activities before, during, and after a specific event. It’s useful for organizers who need to manage logistics, coordinate teams, and communicate timing with participants.
Use cases: Conferences, launches, ceremonies, marketing events, or festivals.
Pros: Provides a clear visual of key deadlines and coordination points; helps ensure smooth execution.
Cons: Not suitable for long-term planning; requires frequent updates as event details change.

Based on context or audience
9. Chronological or historical timeline
This timeline type depicts events in the order they occurred, often over years, decades, or centuries. It’s a staple in education, research, and museums, helping people visualize how historical developments unfolded and relate to each other.
Use cases: History lessons, research projects, documentaries, or educational posters.
Pros: Helps illustrate cause-and-effect relationships; ideal for teaching or storytelling.
Cons: Can become lengthy or detailed, requiring simplification to remain readable.

10. Personal or biographical timeline
A personal or biographical timeline highlights key life events, achievements, and transitions in a person’s journey. It can cover both professional and personal aspects, showing how experiences build upon one another over time.
Use cases: Resumes, portfolios, biographies, or therapy sessions for self-reflection.
Pros: Personalizes storytelling; easy to connect emotionally with viewers.
Cons: Limited to individual data; may feel subjective without context.

11. Company background timeline
A company timeline visualizes an organization’s growth, milestones, and achievements. It’s commonly used in branding materials or investor presentations to demonstrate credibility and track record.
Use cases: About pages, annual reports, pitch decks, or anniversary campaigns.
Pros: Builds trust and showcases growth; effective for marketing and storytelling.
Cons: Needs regular updating; can appear self-promotional if not balanced.

Specialized or data-based timelines
12. Biological timeline
A biological timeline illustrates natural or biological processes, such as evolution, human development, or medical progress. It often combines visuals with scientific data to help explain complex biological sequences clearly.
Use cases: Life cycles, genetics research, medical case studies, or biology education.
Pros: Makes scientific data accessible; great for educational visuals.
Cons: Usually static; limited to biology and related sciences.

13 Calendar timeline
A calendar timeline organizes events by days, weeks, or months, closely resembling a traditional calendar layout. It’s ideal for planning short-term schedules, campaigns, or routines where timing precision matters.
Use cases: Marketing schedules, academic calendars, editorial plans, or fitness programs.
Pros: Familiar and intuitive; easy to coordinate around specific dates.
Cons: Works best for limited time spans; can get cluttered with too many entries.

14. Comparative timeline
A comparative timeline displays multiple sequences side by side, allowing viewers to see how separate timelines align or differ. It’s useful for analyzing parallel developments or comparing progress across teams or topics.
Use cases: Comparing historical events, business competitors, or project timelines.
Pros: Encourages analytical insights; reveals relationships between different timelines.
Cons: Can look busy or confusing without clear labels and color coding.

Interactive and modern formats
15. Interactive timeline
An interactive timeline lets users click, scroll, or zoom to explore details, making it ideal for digital experiences. This format (infographic timeline) supports multimedia elements like images, videos, and links, offering a dynamic way to engage viewers with large datasets or stories.
Use cases: Educational websites, data journalism, corporate reports, or museum exhibits.
Pros: Highly engaging and user-friendly; handles large amounts of information effectively.
Cons: Requires technical tools to build; not suitable for print or offline use.
Why Use Creately for Creating Timelines
Creating timelines in Creately is simple, flexible, and fast with its timeline maker. The platform offers ready-made timeline templates and powerful visualization tools that adapt to any type—whether you’re building a historical timeline, project roadmap, or personal milestone tracker.
Here’s how Creately makes the process easier:
Start with templates: Choose from pre-designed timeline templates for horizontal, vertical, roadmap, or Gantt-style timelines. You can quickly modify layouts, colors, and date ranges to fit your content.
Drag-and-drop simplicity: Add, move, or resize timeline elements effortlessly with intuitive drag-and-drop controls.
Smart shapes and connectors: Automatically align and connect events or milestones with Creately’s intelligent snapping and dynamic connectors, keeping your timeline clean and structured.
AI-powered assistance: Use Creately AI to instantly generate timeline structures from text prompts, summarize project details, or format your visual automatically.
Collaborate in real time: Invite teammates to edit, comment, or brainstorm directly on the canvas. Changes sync instantly across all users.
Attach data and context: Add notes, documents, links, or images to timeline events for richer storytelling or project tracking.
Flexible views: Switch between timeline, Kanban, or table views to manage tasks, track progress, or analyze data connected to your timeline.
Presentation and sharing options: Use presentation mode to walk through your timeline visually or export it as an image, PDF, or link to share online.
FAQs About Types of Timeline Charts
How to choose the right type of timeline for your purpose?
What is the most commonly used type of timeline?
Which timeline is best for project management?
Can timelines be used for personal purposes?
Which timeline format is best for education or research?