An ecomap is a visual way to understand how a person or family connects to the people, services, and systems around them. It helps you quickly see where support is strong, where stress shows up, and which relationships or resources may need more attention.
In this guide, you will learn what an ecomap is, what it typically includes, how individual and family ecomaps differ, what common ecomap symbols mean, and how to create one. You will also see where ecomaps are used in practice and how they compare with genograms.
What Is an Ecomap?
An ecomap is a visual diagram that shows the personal and social relationships between a person or a family and their surroundings. It maps the systems an individual interacts with and shows the nature of those interactions. Ecomaps are commonly used by social workers, therapists, healthcare teams, and educators to identify areas where additional support may be needed.
Dr Ann Hartmann developed ecomaps in the 1970s as a way to show the interactions between a client and their environment. Ecomaps can help you identify sources of support and stress, as well as gaps and opportunities for intervention.
What an Ecomap Usually Includes
Most ecomaps include the same core elements, even when the format or symbols vary slightly between teams or organizations.
- The person or family at the center of the diagram
- People, groups, services, and institutions around them
- Lines or symbols that show the quality of each relationship
- Arrows that show the direction of support, energy, or influence
- A small key or legend so the symbols are easy to interpret
What’s Included in an Individual Ecomap
Typically, an ecomap for an individual shows the following information.
The client (represented by a circle in the center of the diagram).
The significant people, groups, organizations, or institutions in the client’s life (represented by circles or squares around the client). These could include family, friends, employers, religious groups, sports teams, social clubs, hobbies, and medical or mental health care providers.
The nature and quality of the relationships between the client and these entities (represented by different types of lines and symbols).
The energy flow between the client and these entities (represented by arrows).
What’s Included in a Family Ecomap
A family ecomap illustrates the relationships between a family and the various systems in their environment.
- Family Unit (The central circle represents the family members living together. This could also be a set of circles grouped together in the center of the family ecomap).
- External Systems (Connections to extended family, friends, schools, workplaces, healthcare providers, religious groups, and community resources).
- Nature of Relationships (Lines and symbols indicate whether relationships are strong, supportive, stressful, or distant).
The external environment factors may connect to more than one family member because multiple members could be attending the same school, workplace, church, or support service.
Benefits of Using an Ecomap
Ecomaps help professionals and clients understand relationships, support systems, and stress points more clearly. Instead of keeping this information scattered across notes or conversations, an ecomap turns it into a visual structure that can be reviewed, discussed, and updated over time.
Personalized Insights
Each ecomap reflects the specific context of the person or family being assessed. It can show who provides support, which systems create stress, and where important relationships or services are missing.
Better Intervention Planning
Ecomaps help professionals identify where support is strongest and where intervention may be needed. This makes it easier to plan next steps, coordinate referrals, or adjust care based on the person’s real environment.
Clearer Client Conversations
Because ecomaps are visual, they can help clients better understand their own support network and challenges. They also create a shared reference point for discussing sensitive or complex relationships.
Improved Collaboration Across Teams
Social workers, counselors, healthcare providers, educators, and support teams can use ecomaps to align around the same client context. This helps reduce miscommunication and makes it easier to coordinate services.
Progress Tracking Over Time
Updating an ecomap over time can show whether relationships, support systems, or stressors have changed. This is useful for reviewing progress, identifying new risks, and adjusting support plans.
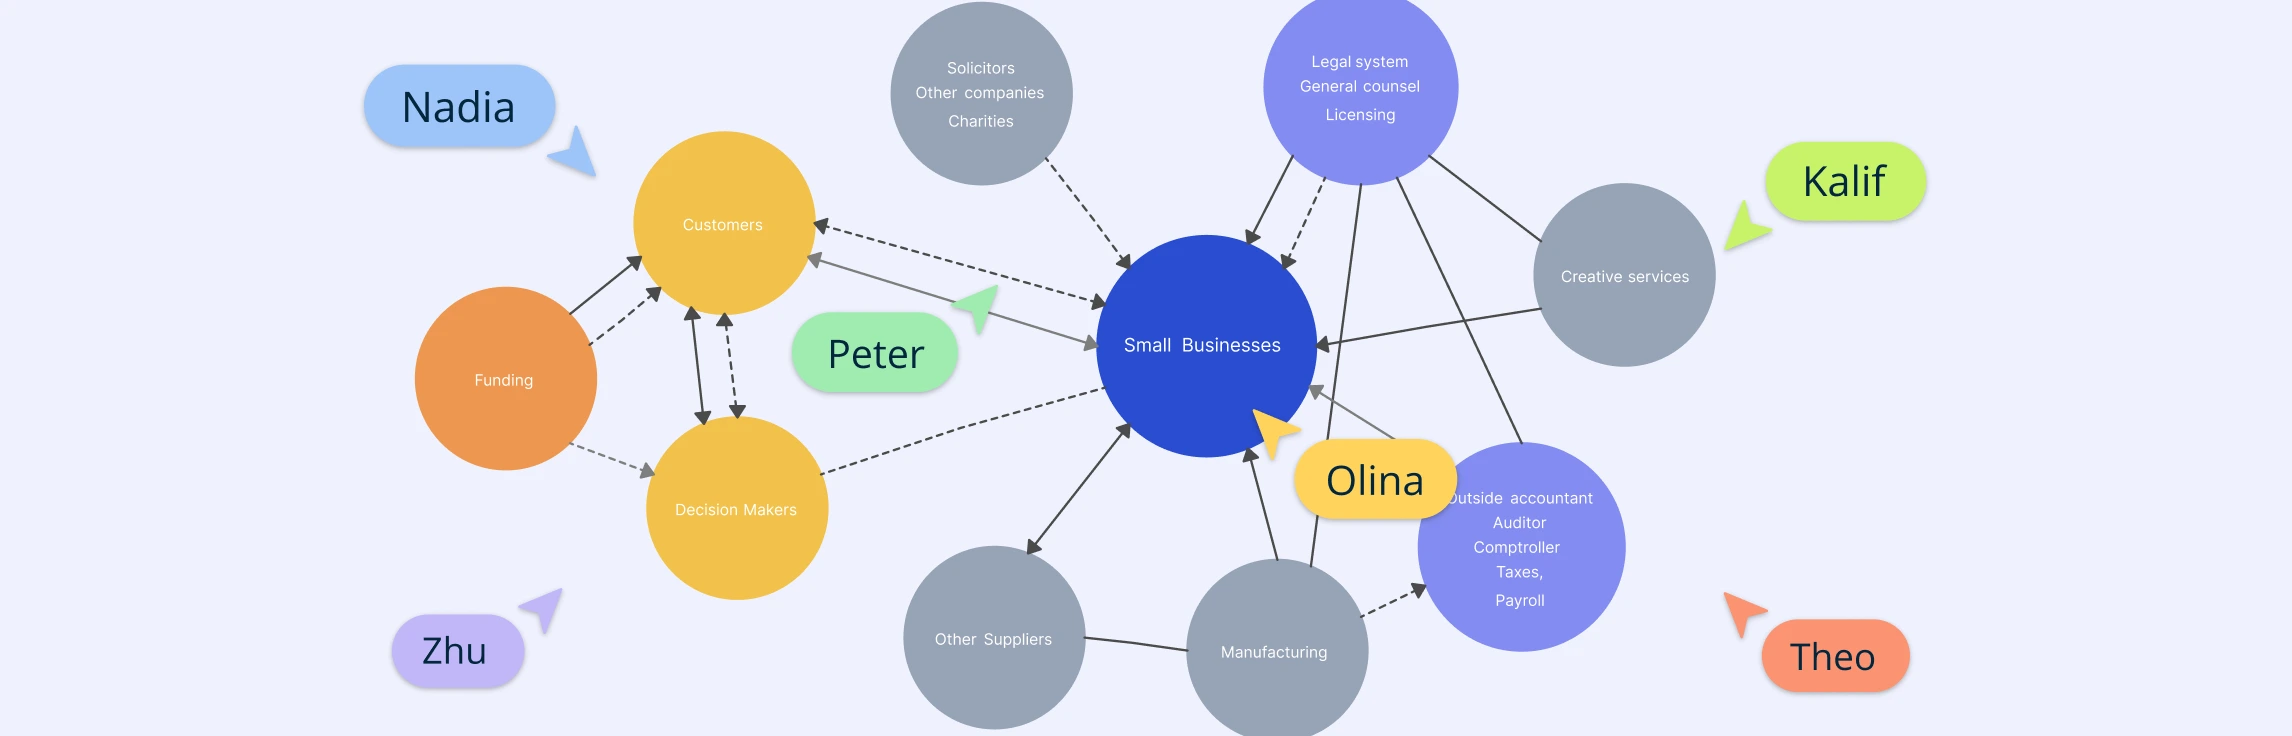
Common Ecomap Use Cases and Examples
Ecomaps can be used by various professionals who work with individuals, families, groups, or communities. Here are some ecomap examples which show how they can be applied in different fields:
Social Work
Ecomaps help social workers assess a client’s social environment, identify available support, spot stressors, and plan interventions. They can also support coordination with schools, healthcare providers, community services, and other agencies.


Counseling
Counselors can use ecomaps to explore how a client’s relationships, support systems, and external pressures affect their emotional wellbeing. This can help guide therapeutic conversations and identify areas where additional support may be needed.

Education
Educators can use ecomaps to better understand a student’s background, support network, and possible stressors. This can help teachers, counselors, and support staff respond more effectively to learning, behavioral, or social challenges.

If you want to explore more types of ecomaps for different use cases, read ecomap examples to see how these diagrams adapt to various professional and personal contexts.
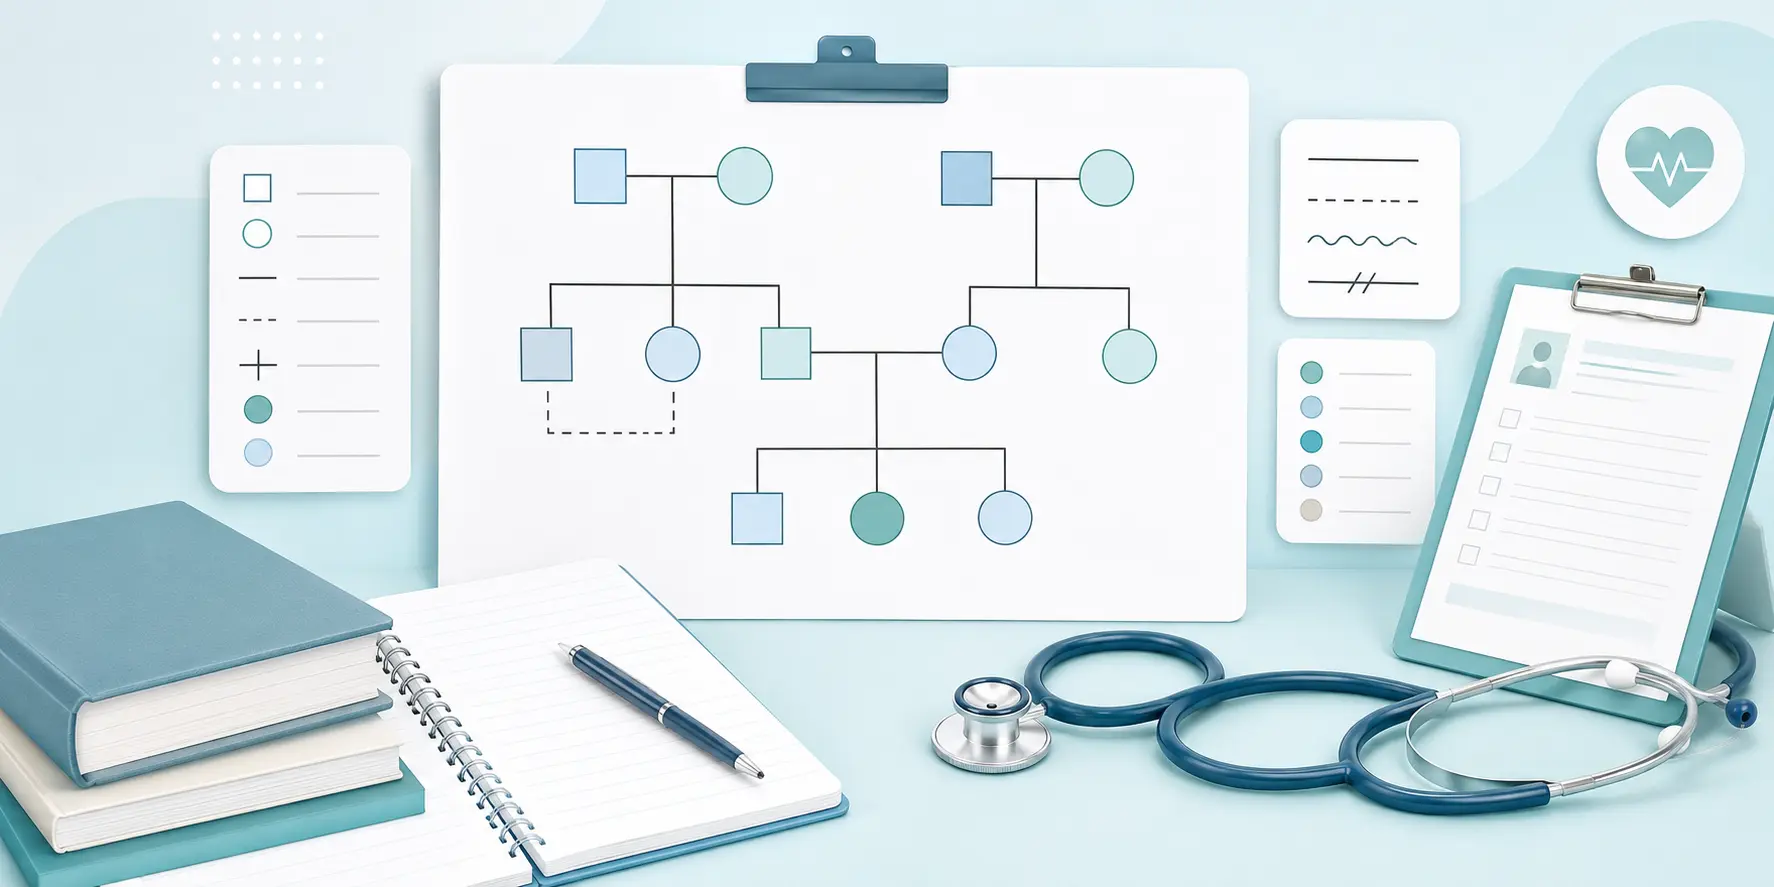
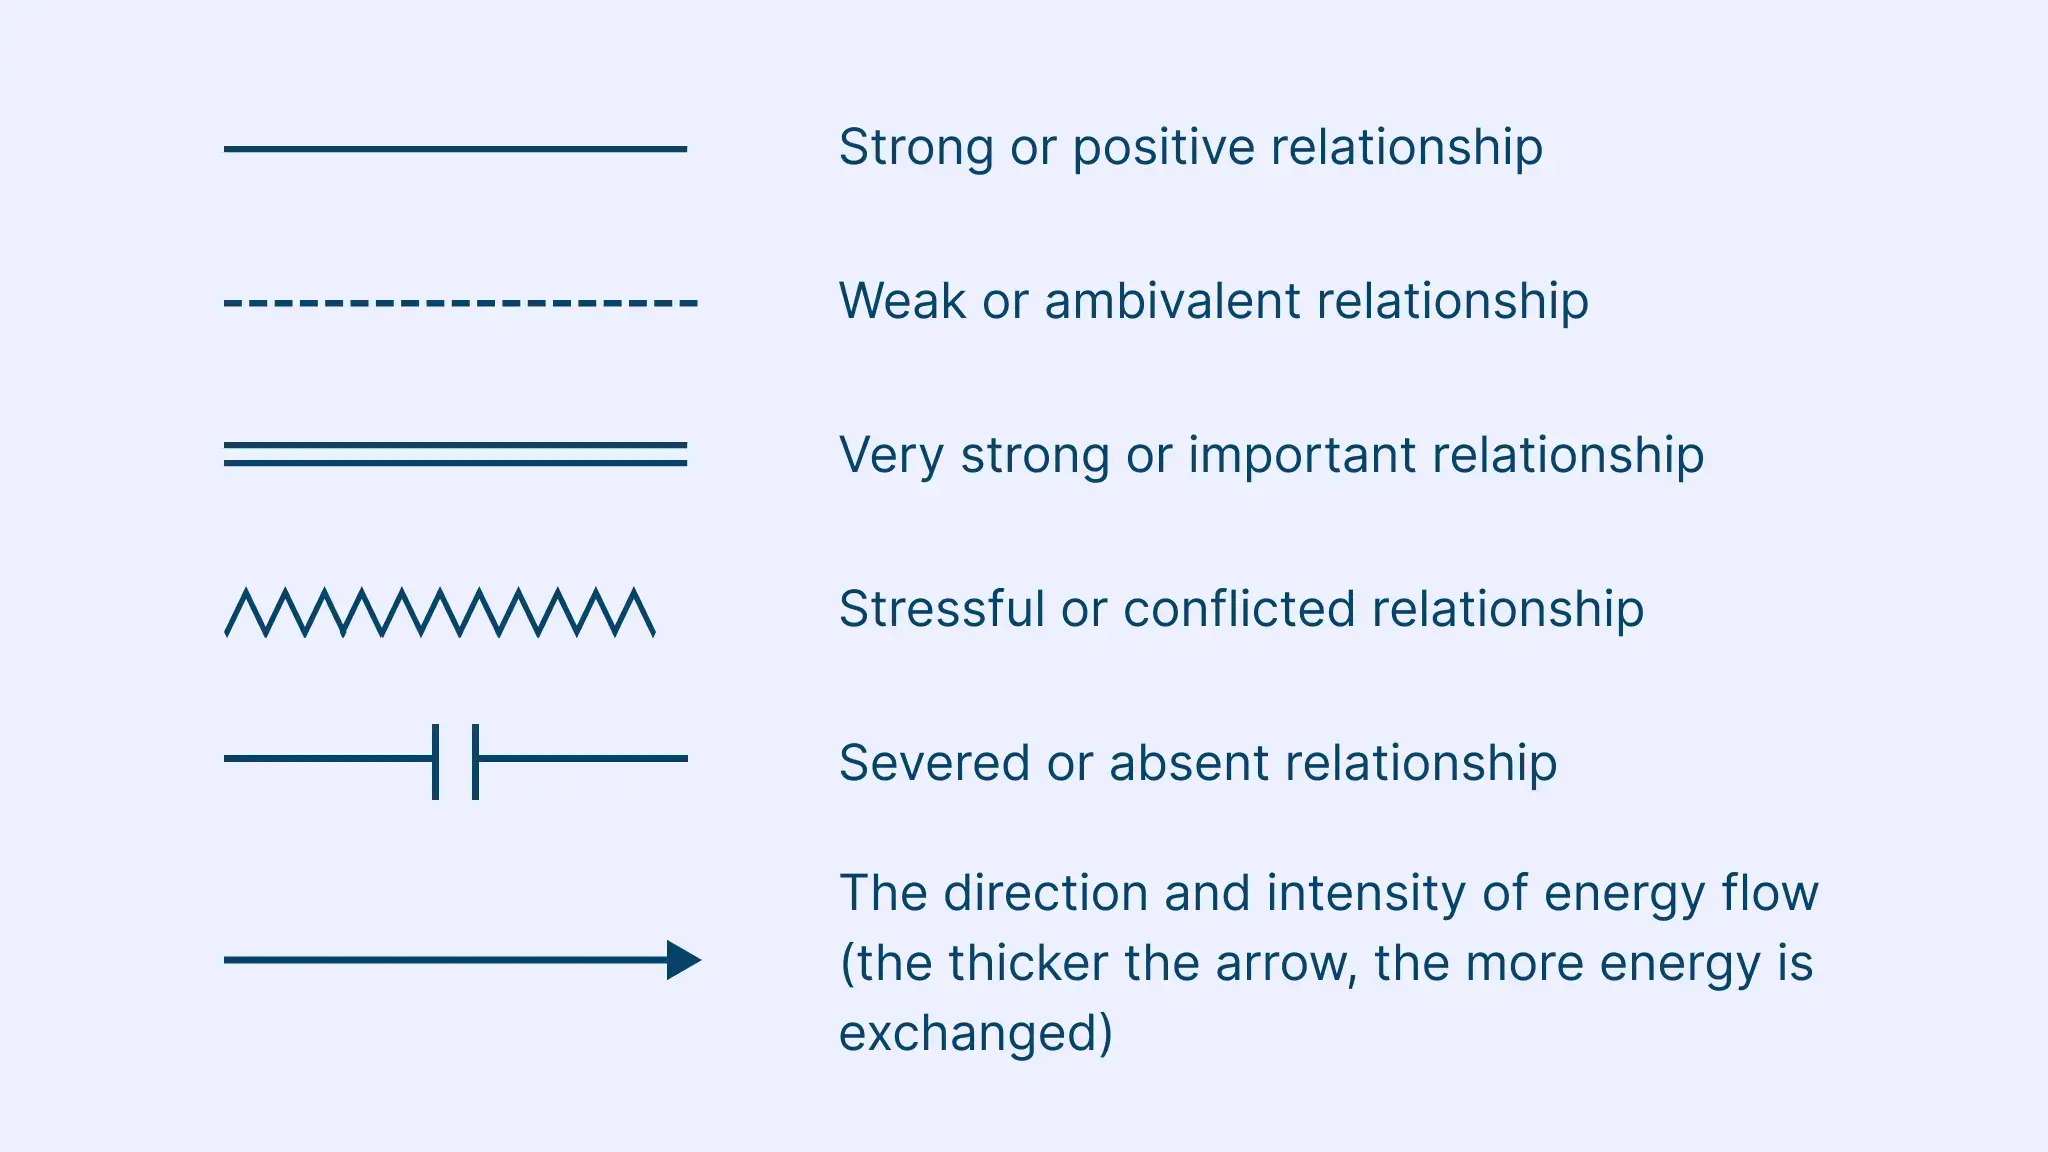
Ecomap Symbols
To read an ecomap correctly, it helps to understand the meaning behind the most common symbols and lines.
- A central circle usually represents the individual, while a grouped set of circles can represent a family.
- Outer circles or squares represent people, groups, services, or institutions connected to that individual or family.
- A solid line often shows a strong or supportive relationship.
- A dotted line can show a weaker, distant, or less consistent connection.
- A jagged line is commonly used for stressful, tense, or conflict-heavy relationships.
- Arrows show the direction of support, energy, or influence between the center and the outside system.
- A legend or key helps readers interpret the symbols consistently.
How to Create an Ecomap with Creately
Creately gives you a visual workspace to create, edit, and share ecomaps for social work, counseling, healthcare, education, and family support workflows.
Step 1: Start With a Template or Blank Canvas
Choose an ecomap template from Creately’s template library, or start from scratch using relevant shapes and connectors. Templates are useful when you want a quick structure for family, counseling, social work, or healthcare ecomaps.
Step 2: Add the Individual or Family at the Center
Place the person or family unit in the center of the canvas. Then add the external people, services, groups, and institutions that influence them, such as family members, schools, workplaces, healthcare providers, community groups, or support services.
Step 3: Show Relationship Types With Lines and Arrows
Use different line styles to show strong, weak, stressful, or distant relationships. Add arrows to show the direction of support, influence, or energy flow between the person or family and each external system.
Step 4: Add Notes, Context, and Supporting Details
Use notes, links, documents, and attachments to add extra context without overcrowding the diagram. This is useful for keeping case notes, observations, or supporting information connected to the ecomap.
Step 5: Collaborate, Review, and Share
Invite team members to review or edit the ecomap in real time. Once finalized, export it as a PNG, JPEG, PDF, or SVG, or embed it in another workspace or website.
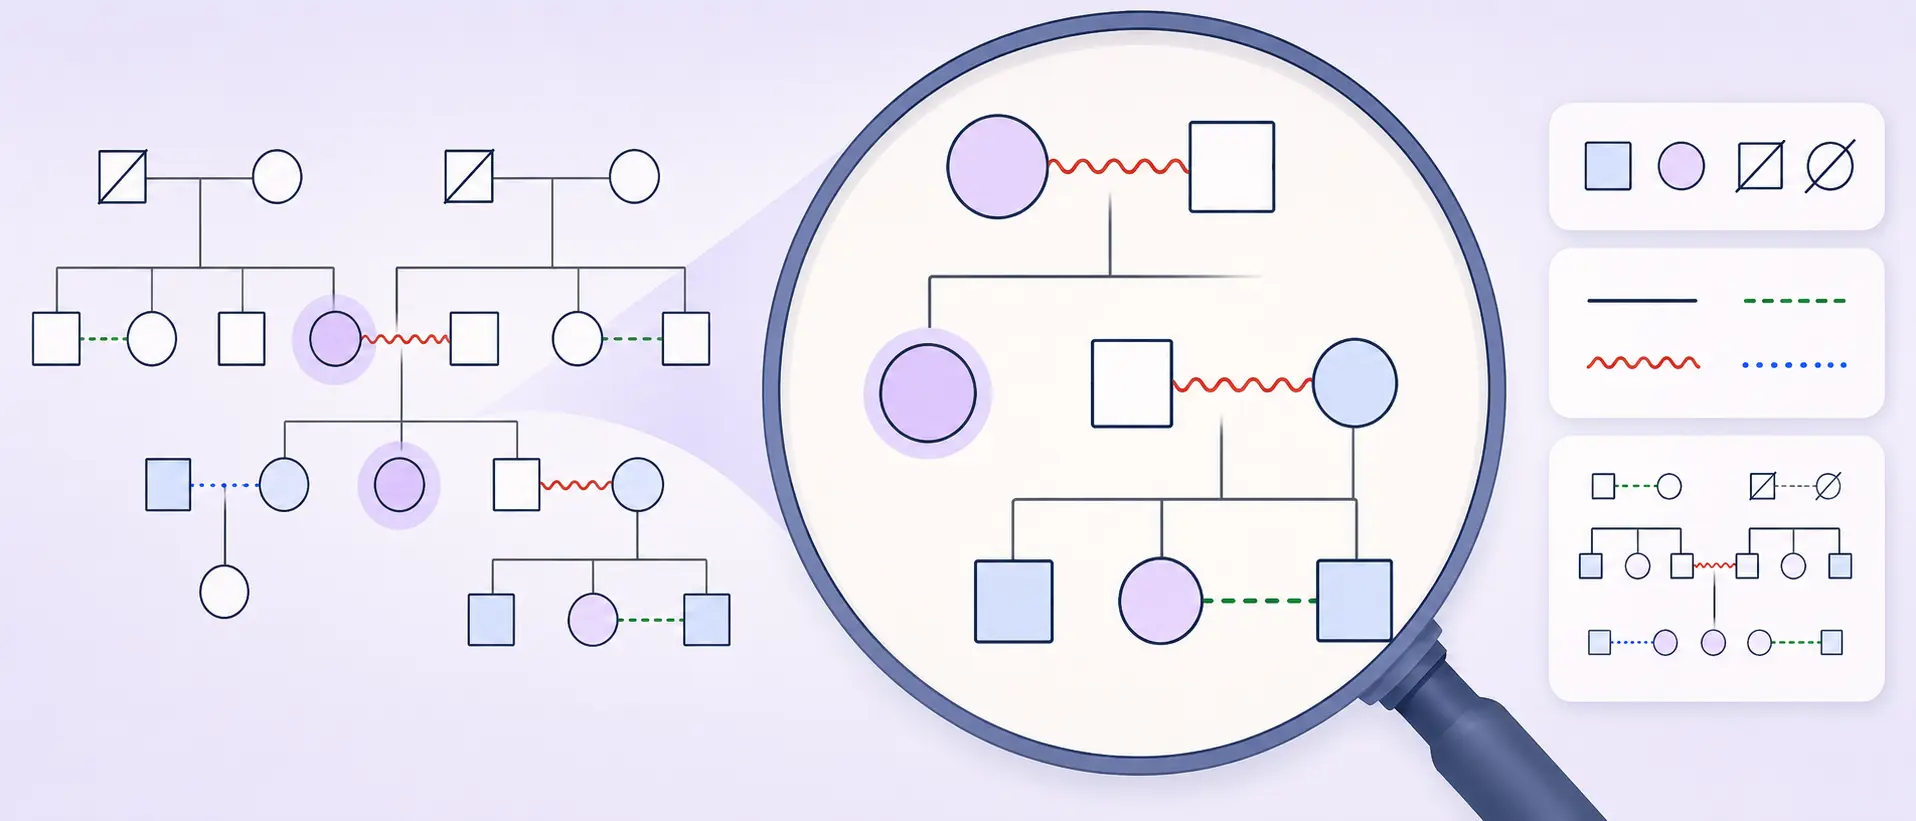
Differences Between an Ecomap and a Genogram
When comparing visual tools for understanding relationships, the ecomap vs genogram distinction is important. While both map connections, they differ in focus, structure, and the types of insights they reveal.
| Aspect | Ecomap | Genogram |
|---|---|---|
| Focus | Includes both internal and external factors around a person or family. | Primarily focuses on internal family dynamics and family history. |
| Content | Shows family structure, relationships, and outside factors such as friends, schools, workplaces, and community groups. | Shows family structure, relationships, roles, patterns, and conflicts across generations. |
| Representation of relationships | Uses arrows and line styles to show support, stress, and energy flow between the person and their environment. | Uses symbols, lines, and sometimes colors or shading to show family relationships and emotional tone. |
| Dynamic nature | More dynamic and flexible because the surrounding systems may change as the situation changes. | More static because it usually captures family history and enduring relationship patterns. |
| Purpose | Highlights the broader context and influences affecting the person or family. | Emphasizes internal family dynamics, patterns, and relationships. |
| Visual elements | Includes the center person or family, outside systems, arrows, and relationship lines. | Mainly consists of family symbols and connecting lines that represent family structure and dynamics. |
Free Ecomap Templates


Helpful Resources for Ecomapping
Learn what a family ecomap is, including its components, symbols, and how to create one.
Explore how ecomaps are used in social work practice to assess relationships and support systems.
Discover 10 ecomap examples across social work, healthcare, education, and counseling.
Conclusion
Ecomaps help turn a complex network of relationships into something people can understand and act on. Whether you work in social work, counseling, education, or healthcare, an ecomap can help you identify support systems, uncover stress points, and make better decisions about next steps. If you want to build one yourself, continue with our guide on how to create an ecomap or browse more ecomap examples.
FAQs About Ecomaps
What is an Ecomap used for?
Who uses ecomaps?
What should be included in an Ecomap?
What is an Ecomap Key?
Resources
Bennett, J. and Grant, N.S. (2016). Using an Ecomap as a Tool for Qualitative Data Collection in Organizations. New Horizons in Adult Education and Human Resource Development, 28(2), pp.1–13. doi:https://doi.org/10.1002/nha3.20134.
McCormick, K.M., Stricklin, S., Nowak, T.M. and Rous, B. (2008). Using Eco-Mapping to Understand Family Strengths and Resources. Young Exceptional Children, [online] 11(2), pp.17–28. doi:https://doi.org/10.1177/1096250607311932.
Rempel, G.R., Neufeld, A. and Kushner, K.E. (2007). Interactive Use of Genograms and Ecomaps in Family Caregiving Research. Journal of Family Nursing, 13(4), pp.403–419. doi:https://doi.org/10.1177/1074840707307917.