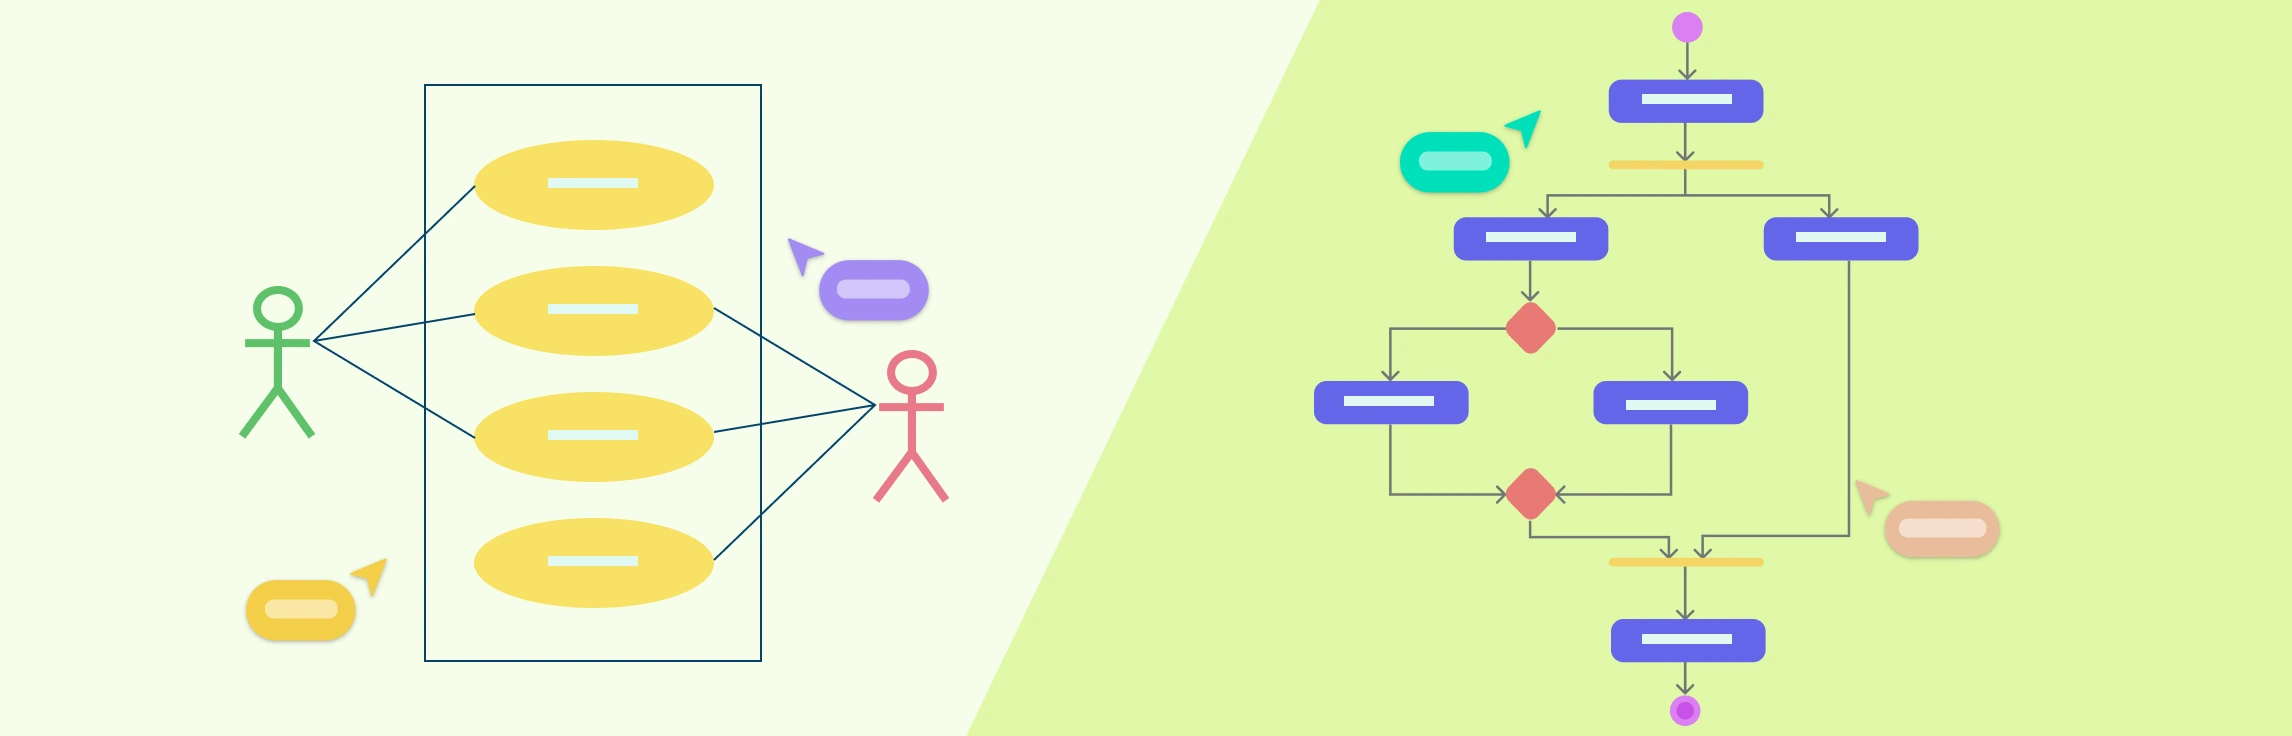
Understanding the difference between use case diagram and activity diagram is essential for anyone involved in system analysis, software design, or process modeling. While both are part of the Unified Modeling Language (UML) suite, they serve distinct purposes and visualize different aspects of a system. This guide breaks down their purposes, notations, and practical applications, helping you understand when to use each diagram, and how they complement one another.
What is a Use Case Diagram
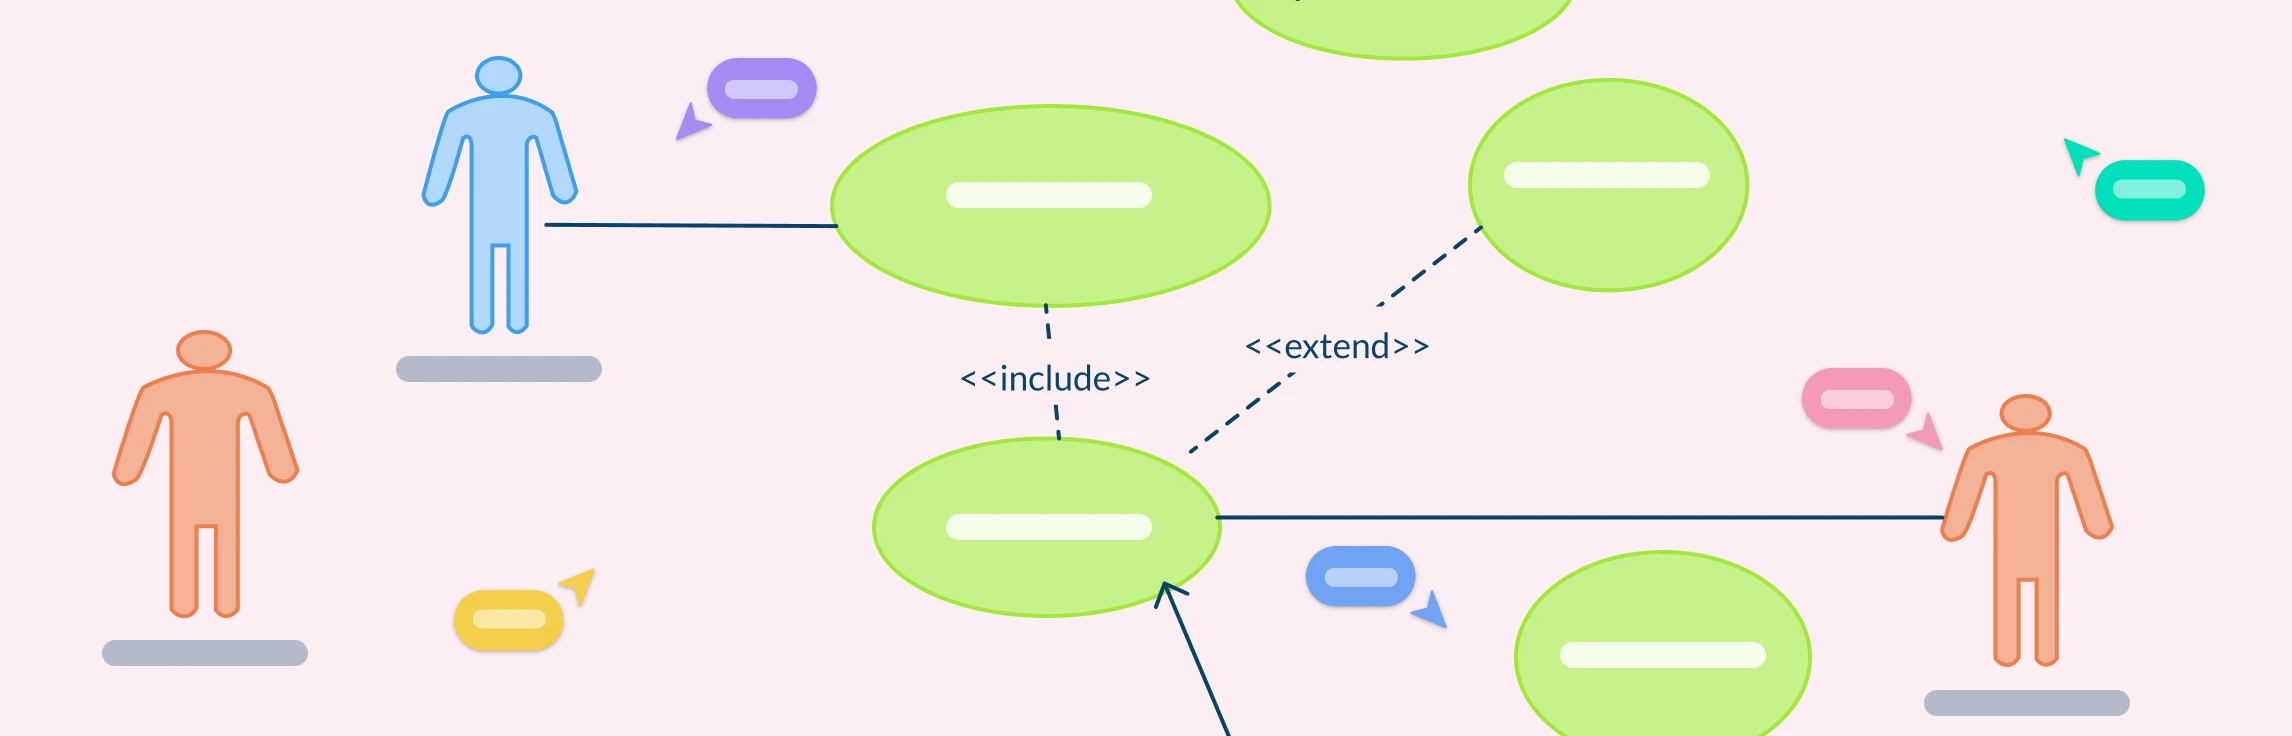
A Use Case Diagram is a behavioral UML diagram that visually represents the interactions between users (actors) and a system to achieve specific goals. It focuses on the functional requirements of a system and describes what the system should do, not how it does it.


What is an Activity Diagram
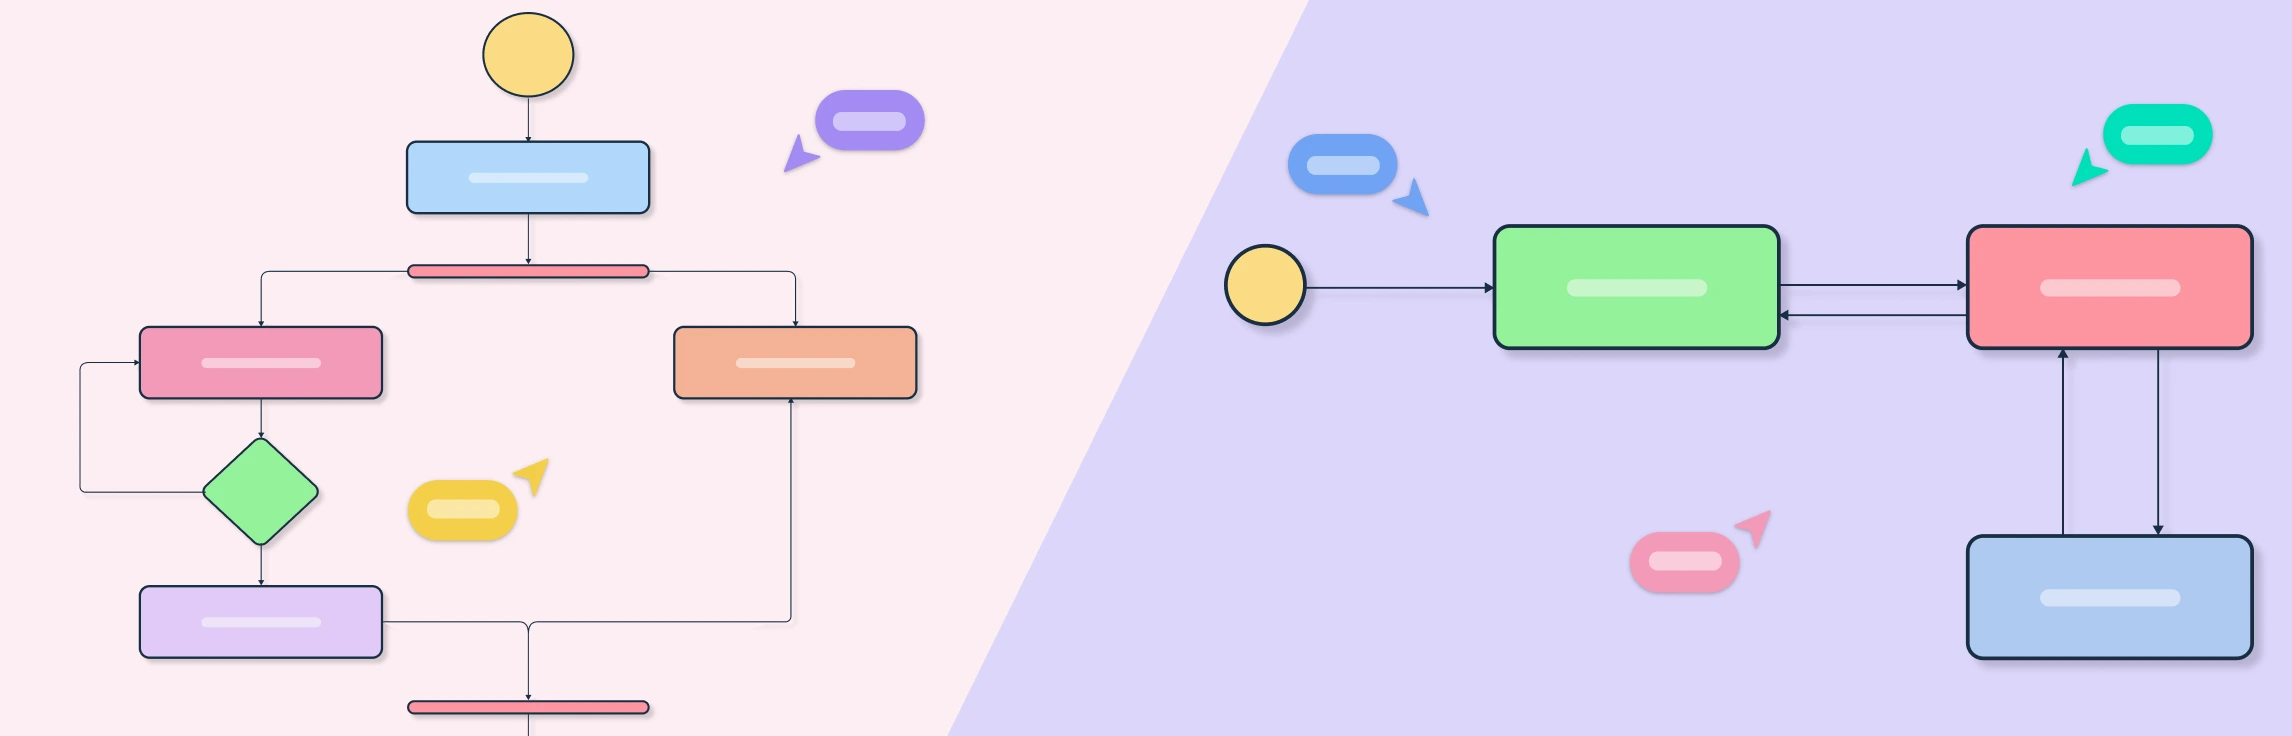
An Activity Diagram is a behavioral UML diagram that models the workflow or sequence of actions within a process or system. It visually represents how different activities, decisions, and parallel actions are carried out, showing how a process flows from start to finish.

Key Differences Between Use Case Diagrams and Activity Diagrams
The difference between use case diagram and activity diagram lies in what aspect of the system they describe. Together, they provide complementary views of system behavior: one from the user’s perspective and the other from the process execution standpoint. The key differences between the two are summarized in the table below.
Aspect | Use Case Diagram | Activity Diagram |
Purpose | Illustrates what the system does by showing interactions between users (actors) and the system. | Describes how the system or process works internally, focusing on workflows and control flows. |
Focus | User goals and system functionality. | Step-by-step flow of activities and decisions. |
Primary Elements | Actors, use cases, system boundary, relationships (include, extend, generalization). | Actions, decisions, flows, swimlanes, start/end nodes, forks, and joins. |
Viewpoint | External view from the user’s or stakeholder’s perspective. | Internal view from the system’s or process’s perspective. |
Level of Detail | High-level, conceptual overview. | Detailed, procedural representation of logic and flow. |
Representation Type | Static. Shows functional requirements and user interactions. | Dynamic. Shows movement, conditions, and transitions between actions. |
Use Case | Used during requirement gathering and system scope definition. | Used during process modeling, workflow analysis, and system design. |
Output | Defines the what — the use cases to be developed. | Defines the how — the logic or workflow behind those use cases. |
Common Notations | Stick figures (actors), ovals (use cases), rectangles (system boundary). | Rounded rectangles (activities), diamonds (decisions), arrows (control flows). |
From Use Case to Activity Flow Explained
UML in both use case diagram and activity diagram helps visualize how a system functions, showing user interactions through use cases and the internal flow of activities within processes. Let’s look at a simple real-world example like User Registration to understand how a Use Case Diagram and an Activity Diagram describe the same process from different perspectives.
Use Case Diagram – What Happens
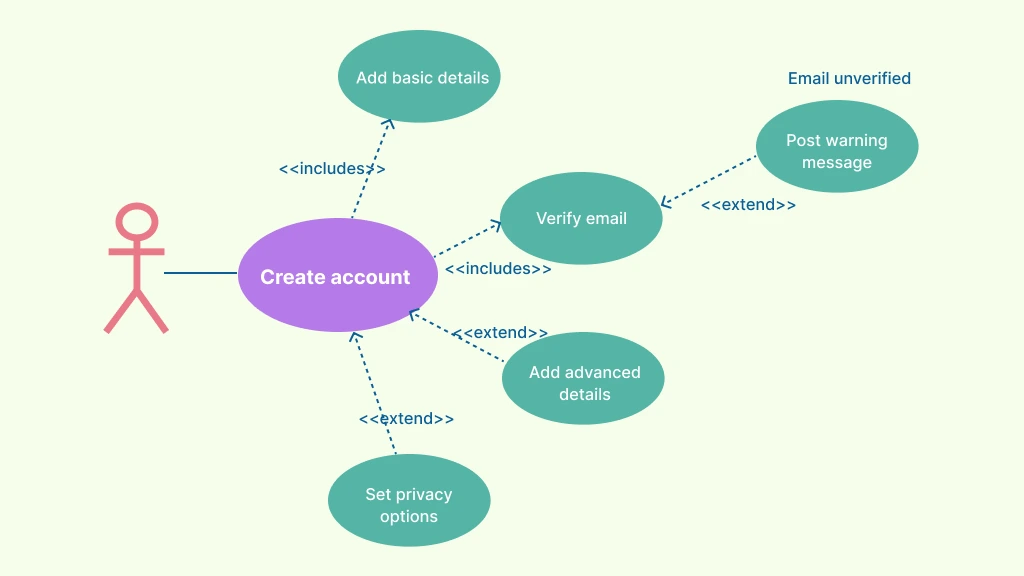
The Use Case Diagram focuses on the interaction between the user and the system. It answers the question: What does the user do, and what does the system provide in response? With Creately’s Use Case Diagram Tool, you can easily create, customize, and connect use case symbols to visualize system interactions and user roles.
Actors:
- User – interacts with the system to create an account.
- System – validates and stores user information.
Use Cases:
- Add Basic Details
- Upload Avatar
- Verify Email
- Add Advanced Details
- Set Privacy Options
How it works:
- The User initiates the “Create Account” process.
- The System guides the user through entering personal details, verifying their email, uploading a profile picture, adding advanced information, and setting privacy preferences.
- The diagram shows a simple interaction where one actor (User) performs multiple actions supported by the system.
Browse our collection of use case diagram templates to instantly start designing, customizing, and sharing system interactions that align with your project requirements.
Activity Diagram – How It Happens
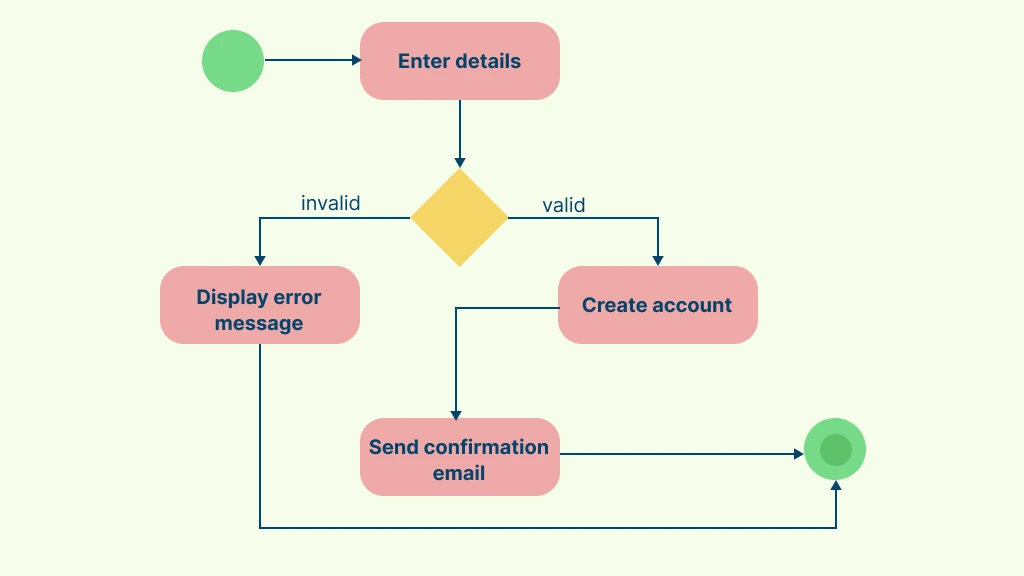
The Activity Diagram visualizes the workflow of the registration process, showing how each step unfolds internally. With Creately’s Activity Diagram Tool, you can easily create, customize, and connect activity symbols to visualize workflows, actions, and decision points within your system.
Flow Example:
Start → User opens the registration page.
Enter Details → User inputs name, email, and password.
Validate Input → System checks for missing or invalid data.
If invalid → Display error message and return to input.
If valid → Continue.
Create Account Record → System saves user data in the database.
Send Confirmation Email → System triggers an email notification.
End → Registration process completes successfully.
Browse our collection of activity diagram templates to instantly start designing, customizing, and sharing process flows that align with your project requirements.
Best Practices for Using Both Use Case and Activity Diagrams
Start with the Use Case Diagram: Identify actors and their interactions first to define what the system should do before modeling how it works.
Create Activity Diagrams for Key Use Cases: For each major use case, design an Activity Diagram to illustrate the detailed process flow behind it.
Keep Diagrams Simple and Focused: Avoid overloading your diagrams. Focus each Use Case Diagram on key interactions and each Activity Diagram on a single workflow.
Use Consistent Naming: Apply the same names for actions and entities across both diagrams (e.g., “Verify Email” in both).
Ensure Logical Alignment: Make sure every Activity Diagram directly supports a corresponding Use Case, maintaining a one-to-one relationship between what happens and how it happens.
Stick to Standard UML Notation: Use proper UML symbols such as stick figures and ovals for Use Cases; rounded rectangles, diamonds, and arrows for Activity Diagrams.
Highlight Decision Points Clearly: In Activity Diagrams, show decision nodes and alternate flows to make logic easier to follow.
Collaborate Across Teams: Use Case Diagrams are great for stakeholder discussions; Activity Diagrams help developers and analysts refine workflows.
Keep Diagrams Updated: Revise diagrams whenever new features or logic changes occur to ensure accuracy and consistency.
Free Activity Diagram and Use Case Diagram Templates to Get Started


FAQs about Use Case Diagrams Vs. Activity Diagrams
Can I use both use case diagrams and activity diagrams together?
Can an Activity Diagram replace a Use Case Diagram?
How many Activity Diagrams should I create for my Use Case Diagrams?
Can I create an Activity Diagram without a Use Case Diagram?
Resources
Bolloju, Narasimha, and Sherry X.Y. Sun. “Benefits of Supplementing Use Case Narratives with Activity Diagrams—an Exploratory Study.” Journal of Systems and Software, vol. 85, no. 9, Sept. 2012, pp. 2182–2191, https://doi.org/10.1016/j.jss.2012.04.076.
Ibrahim, Noraini, et al. “Definition of Consistency Rules between UML Use Case and Activity Diagram.” Communications in Computer and Information Science, 2011, pp. 498–508, https://doi.org/10.1007/978-3-642-20998-7_58.