The definition of the graphic organizer is: visual representation of information that helps organize and structure ideas, data, or concepts for easier understanding, analysis, and communication. It uses diagrams, charts, maps, or other visual layouts to break down complex topics, highlight relationships, and simplify learning or problem-solving.
Purpose of a Graphic Organizer
- Visual clarity: Graphic organizers simplify complex ideas by turning them into clean visuals. This makes it easier to quickly understand and remember key information.
- Flexibility: They work across any subject, grade level, or task—whether you’re writing an essay, solving a problem, or planning a project.
- Focus on connections: Instead of listing facts, graphic organizers show how ideas are related, helping users make sense of patterns and relationships.
- User engagement: Interacting with visuals keeps users more involved, encouraging deeper thinking and better learning.
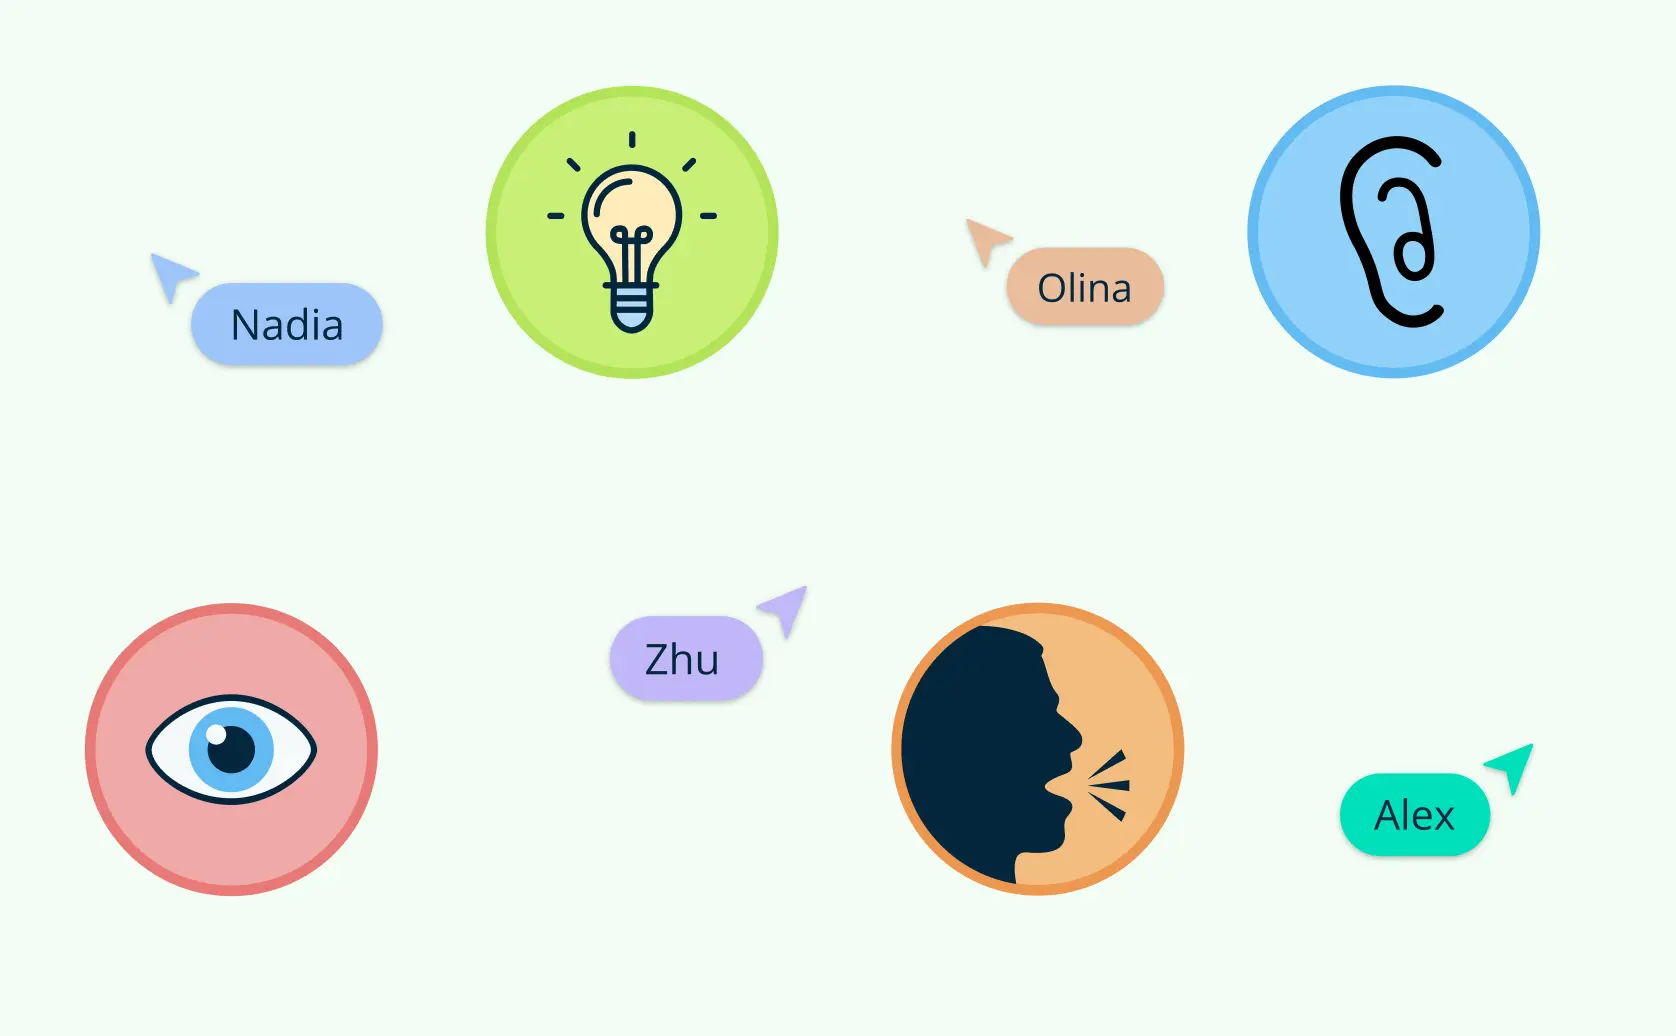
- Accessibility: They support diverse learners, including those with learning challenges or language barriers, by presenting information in a clear, visual format.
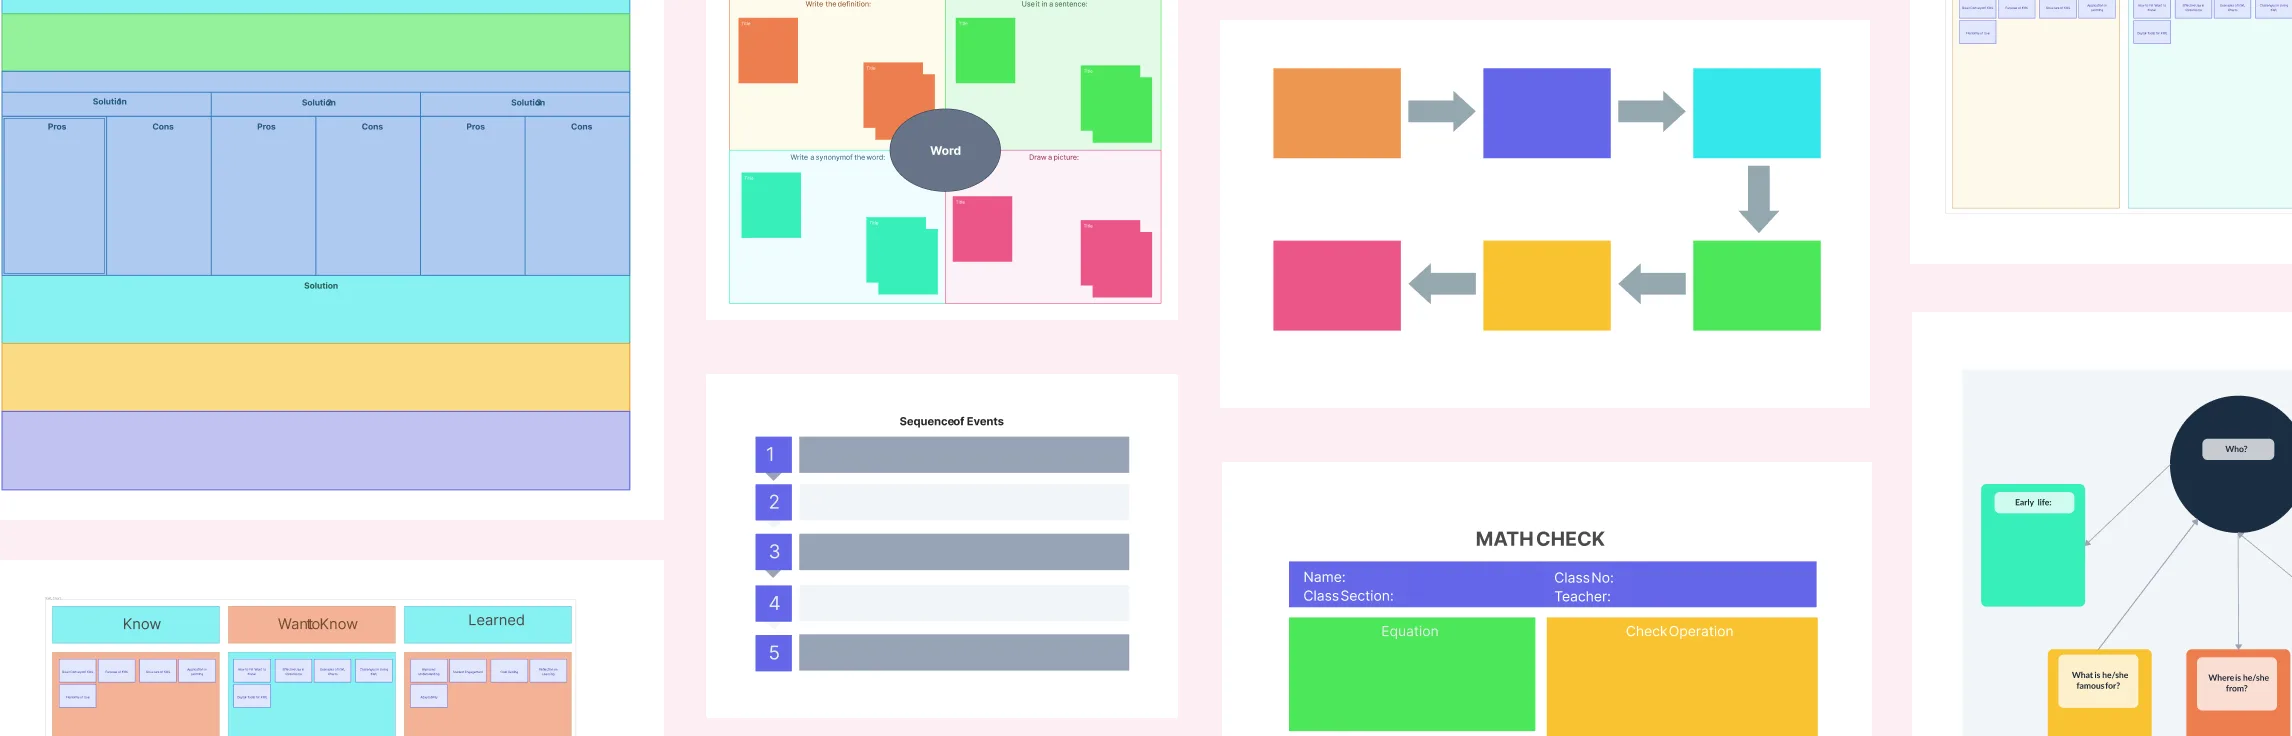
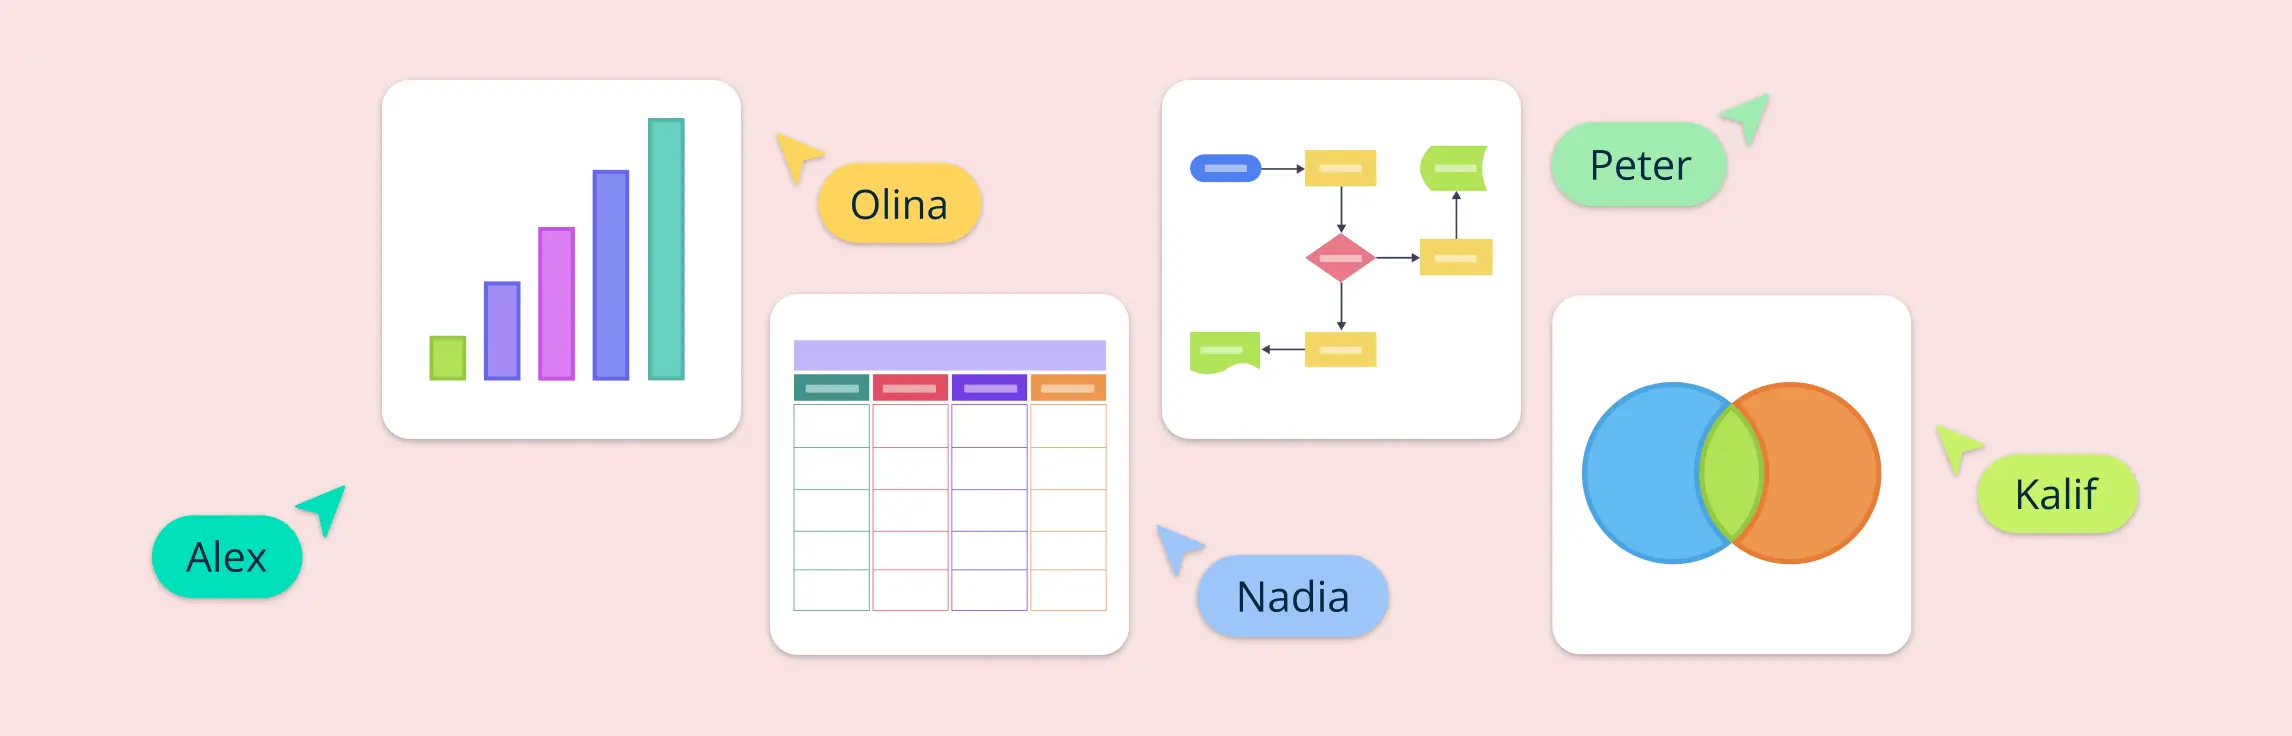
Different Types of Graphic Organizers
- Mind Maps: Great for brainstorming and showing how ideas branch out from a central theme.
- Venn Diagrams: Use to compare and contrast two or more things, showing what they have in common and what’s different.
- Flowcharts: Help visualize processes or step-by-step workflows clearly.
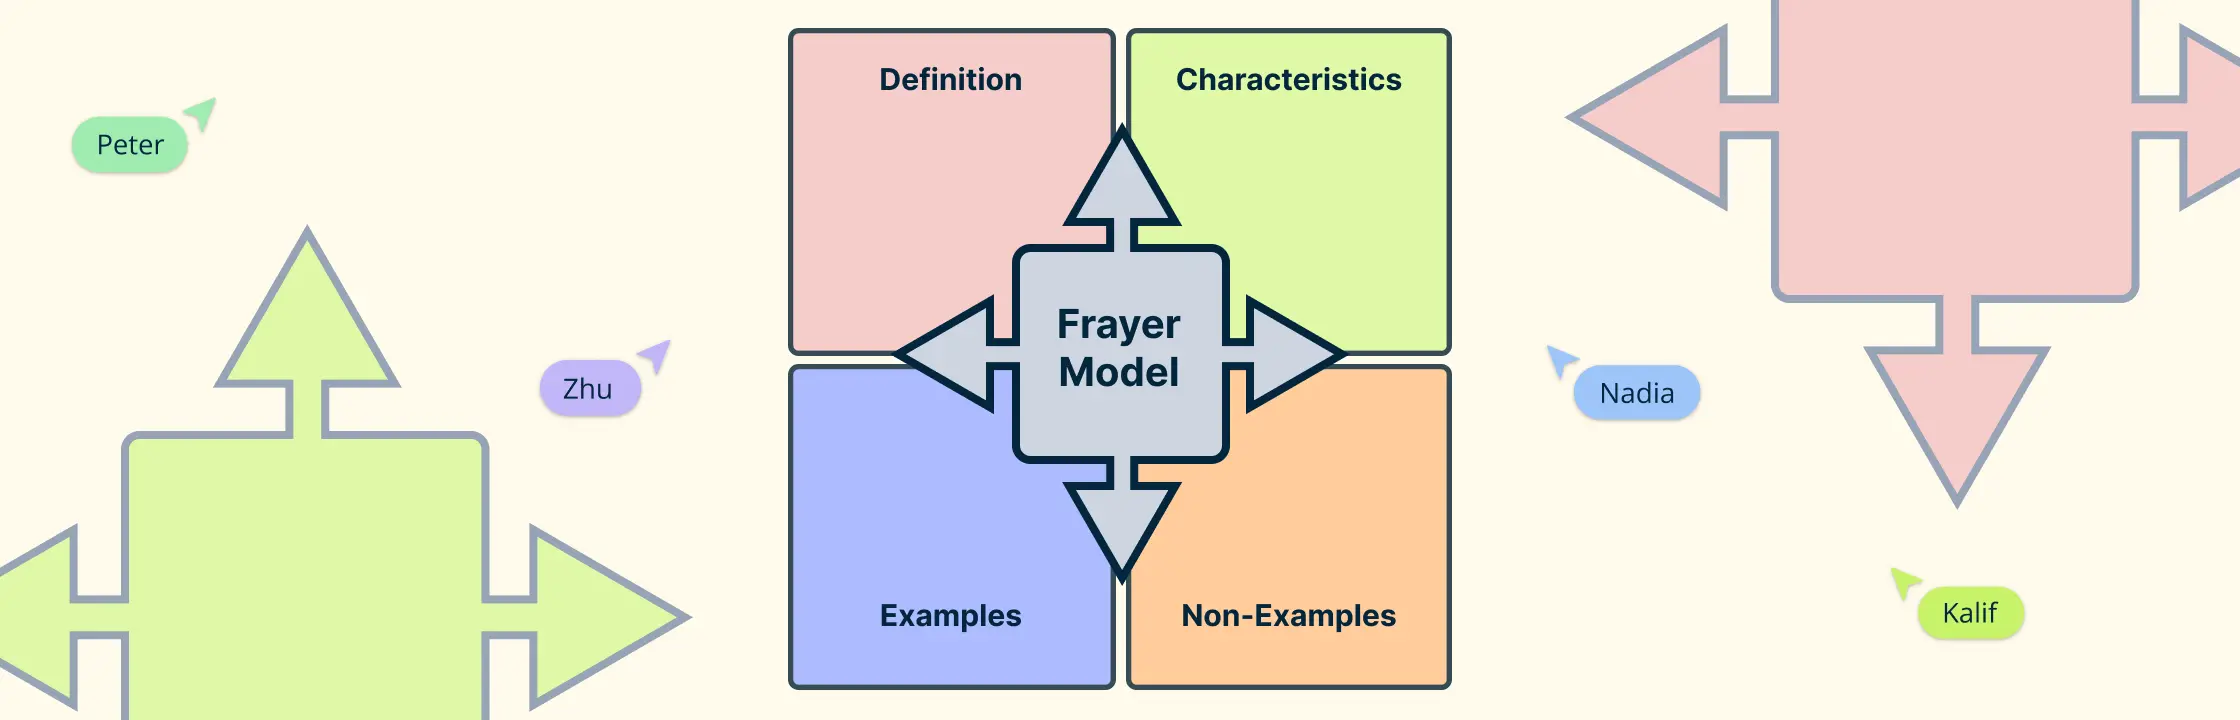
- Concept Maps: Show relationships between ideas, often used in learning and research.
- Cause-and-Effect Charts: Help identify reasons something happened and the results that followed.
- Timelines: Useful for organizing events in chronological order, such as history or project planning.
- T-Charts: Ideal for listing pros and cons, facts vs. opinions, or comparing two sides of an argument.
Learn more about types of graphic organizers.
Benefits of Graphic Organizers
- Break down complex ideas: Graphic organizers simplify big or confusing topics by showing how different parts connect. This makes learning less overwhelming.
- Improve understanding: By organizing information visually, it’s easier to see patterns, relationships, and main points—especially when you’re comparing or analyzing.
- Boost memory: When you see information laid out clearly, you’re more likely to remember it. This is especially helpful for studying or explaining things later.
- Encourage clear thinking: Whether you’re planning a story, solving a problem, or preparing a presentation, graphic organizers help you think through your ideas step by step.
- Support all types of learners: They’re especially useful for visual learners, students with learning challenges, or anyone who needs a different way to process information.
- Save time and effort: With a graphic organizer, you can organize your thoughts quickly—making it easier to start writing, studying, or presenting.
- Make learning more engaging: Using visuals keeps things interesting and helps break up boring or dense content, especially for younger learners or visual thinkers.
- Encourage active participation: Whether in a classroom or a team meeting, graphic organizers invite people to add ideas, connect thoughts, and be part of the process.
Real-World Examples of Graphic Organizers
For Education
What is a graphic organizer in education? Graphic organizers are a go-to resource for teachers, students, and parents because they simplify learning and make it more interactive.
- Lesson planning: Teachers can outline lessons visually, breaking them into easy-to-follow parts for students.


- Studying: Students can summarize chapters, map out key ideas, or prepare for exams using tools like concept maps or timelines.

- Brainstorming: Whether working on essays, science projects, or group assignments, graphic organizers help students think creatively and organize their ideas.

For Businesses
In the workplace, graphic organizers can improve productivity and teamwork by making complex tasks easier to manage.
- Project planning: Create flowcharts or Gantt charts to outline tasks, set deadlines, and track progress.

- Process mapping: Businesses can create process maps to streamline workflows and identify inefficiencies.

- Team collaboration: Mind maps and diagrams can help teams brainstorm ideas, prioritize tasks, or visualize strategies together.

For Personal Use
Even outside of school and work, graphic organizers can make everyday life more organized and stress-free.
- Goal setting: Use a chart to break your goals into actionable steps and track your progress over time.

- Decision-making: Tools like pros-and-cons lists or decision trees help you weigh options and make thoughtful choices.

- Planning events: Whether you’re hosting a party or organizing a trip, a graphic organizer can help you map out details like timelines, budgets, and to-do lists.

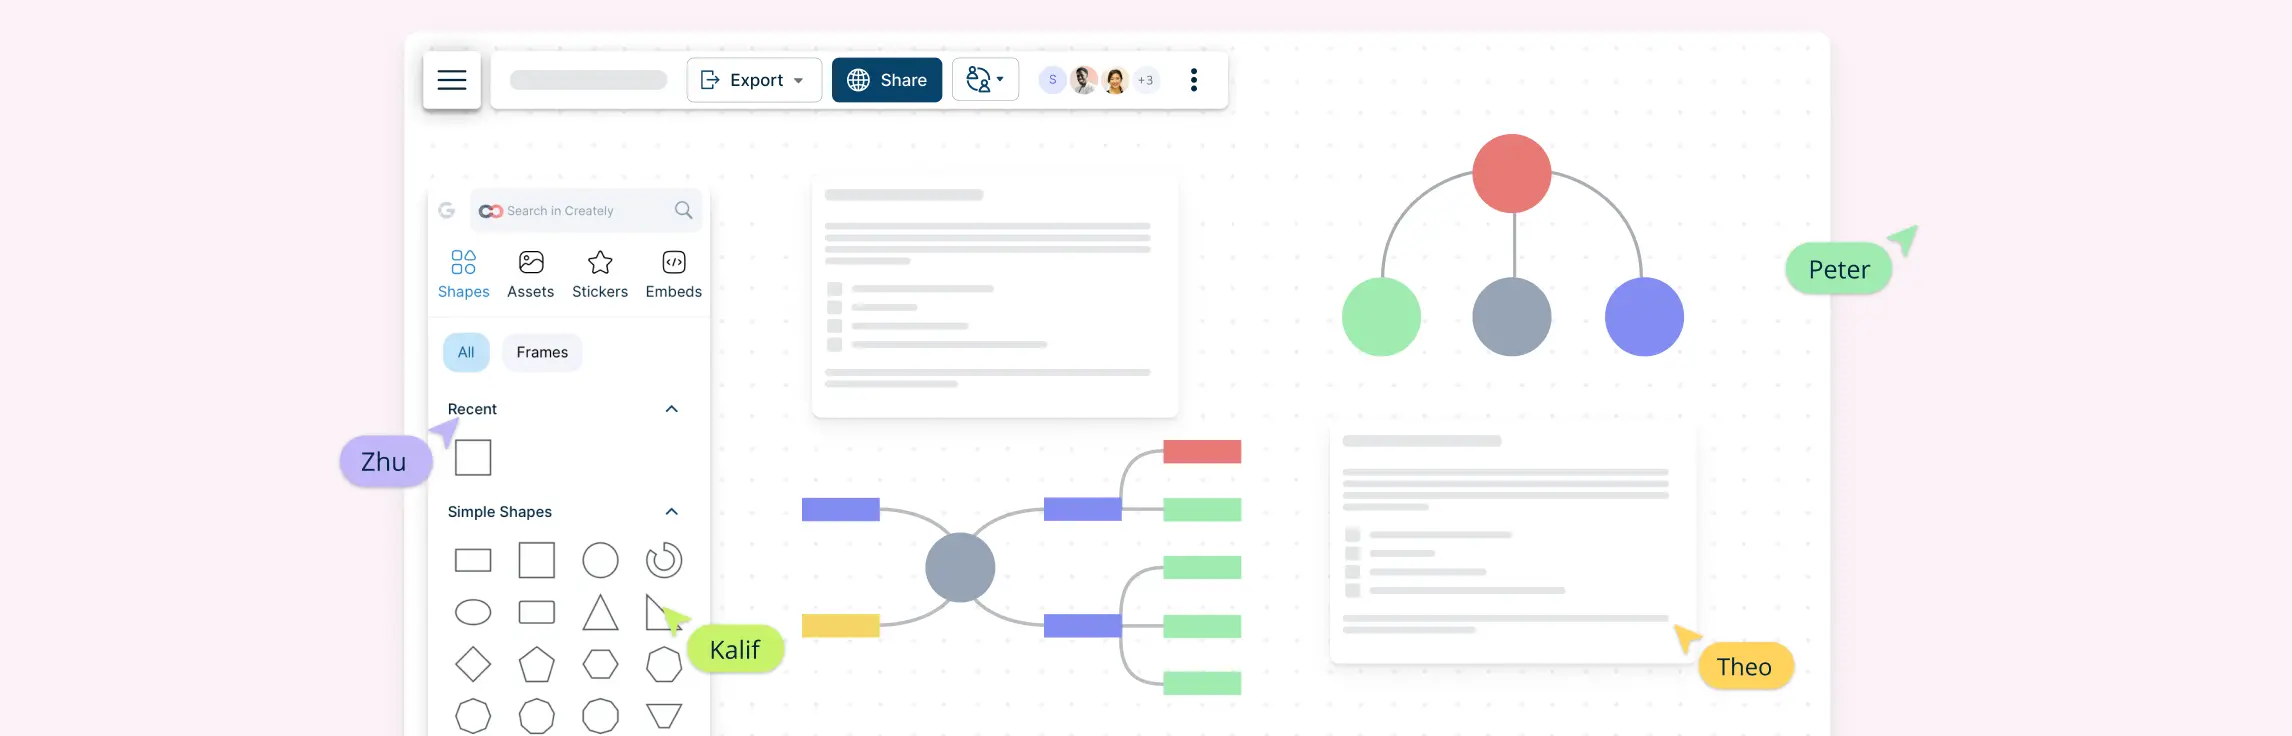
Create Your Graphic Organizer with Creately
1. Open the Creately App: Launch the Creately app and sign in to your account and create your workspace.
2. Choose or customize a template: Select a ready-made template like a Venn diagram or mind map, and easily adjust it to fit your topic—no design skills needed.
3. Add and organize content: Drag and drop shapes, text, and lines. Add notes, links, or images to keep all your information in one place.
4. Collaborate in real time: Work with others on the same canvas—perfect for group tasks or class activities.
5. Present or share your work: Use Creately’s presentation mode or export your organizer as a PDF or image for easy sharing and display.
FAQs on What Is a Graphic Organizer
How do graphic organizers support critical thinking?
Are there digital tools available for creating graphic organizers?
How do graphic organizers enhance reading comprehension?
Can graphic organizers be used for both fiction and nonfiction texts?
How do graphic organizers assist in the writing process?
How do graphic organizers support students with learning disabilities?
How do graphic organizers facilitate collaborative learning?