A timeline diagram is a simple but powerful way to show how events unfold over time. Whether it’s used to track project milestones, visualize historical events, or map a product’s journey, timelines make it easy to see progress and relationships at a glance. In this guide, we’ll explain the timeline meaning, its key elements, and why it’s such a useful tool for organizing information clearly.
Definition of a Timeline
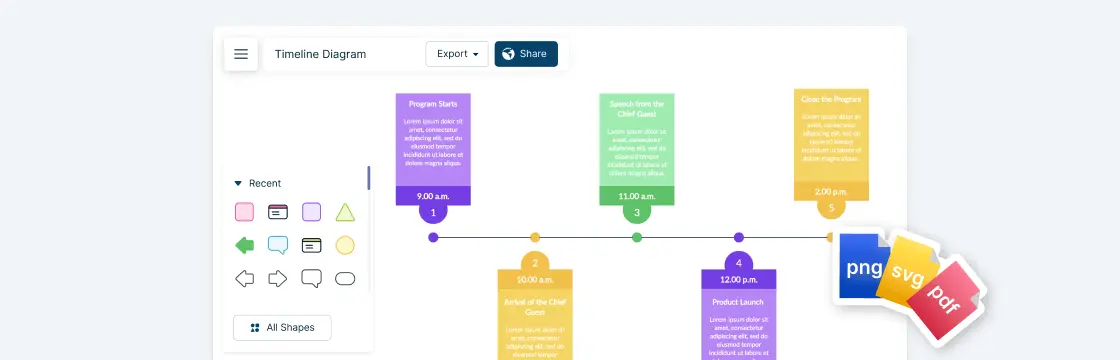
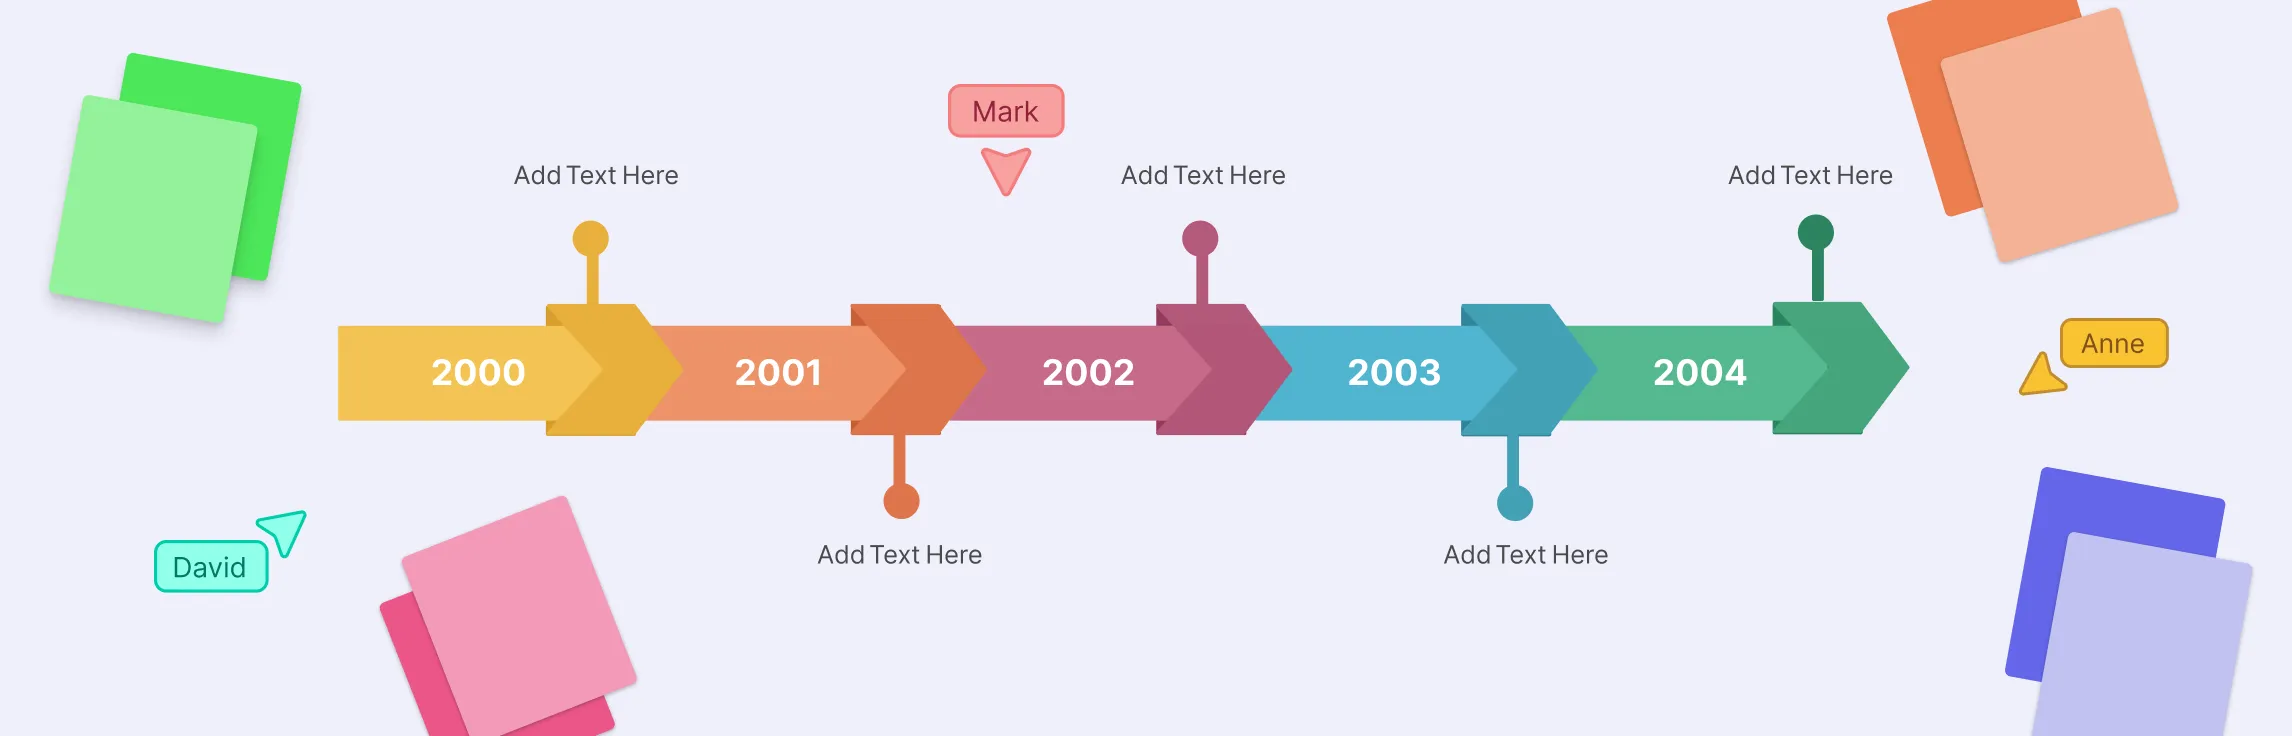
What is a timeline? A timeline diagram is a visual way to show events, milestones, or tasks in the order they happen over a period of time. It’s built around a single line that represents time — this line can run horizontally, vertically, or even in creative shapes like spirals or circles. Along this line, you place key moments or activities, helping viewers easily understand the sequence and timing of events at a glance.


What a timeline is not
A timeline isn’t meant to show detailed task dependencies, durations, or workflows. That’s what tools like Gantt charts or flowcharts are for. Unlike those, a timeline focuses on giving a clear, big-picture view — it highlights when things happen, not how they’re done or how they connect step by step. It’s a simple visual story of time, not a project management plan or process map.
What is the purpose of a timeline
Now that we have the timeline explained, let’s look at its purpose. The main purpose of a timeline is to visually represent the sequence of events over a period of time. Timelines help organize information clearly, making it easy to understand when events happened, how they relate to each other, and what comes next. They are used to track progress, communicate plans, tell stories, and provide a high-level overview of historical, personal, or project-related events.
Components of a Timeline
Every timeline diagram is made up of a few simple but important parts that work together to tell a clear story. Let’s look at the common parts of a timeline,
Time span or intervals: This shows the period your timeline covers — it could be days, months, years, or even centuries. It usually includes a clear start and end point to help viewers understand the overall duration.
Events or milestones: These are the key moments or tasks placed along the line. Each one represents something important that happened or will happen, often with a short description or label.
Chronological order: Everything on a timeline follows the order in which events occur. This sequence helps you easily trace how one event leads to another.
Visual markers and labels: Icons, colors, or images can make your timeline more engaging and easier to read, helping important points stand out.
Multiple timelines or tracks (optional): For more complex projects or topics, you can show parallel timelines to compare different activities or storylines happening at the same time.
Types of Timeline Diagrams
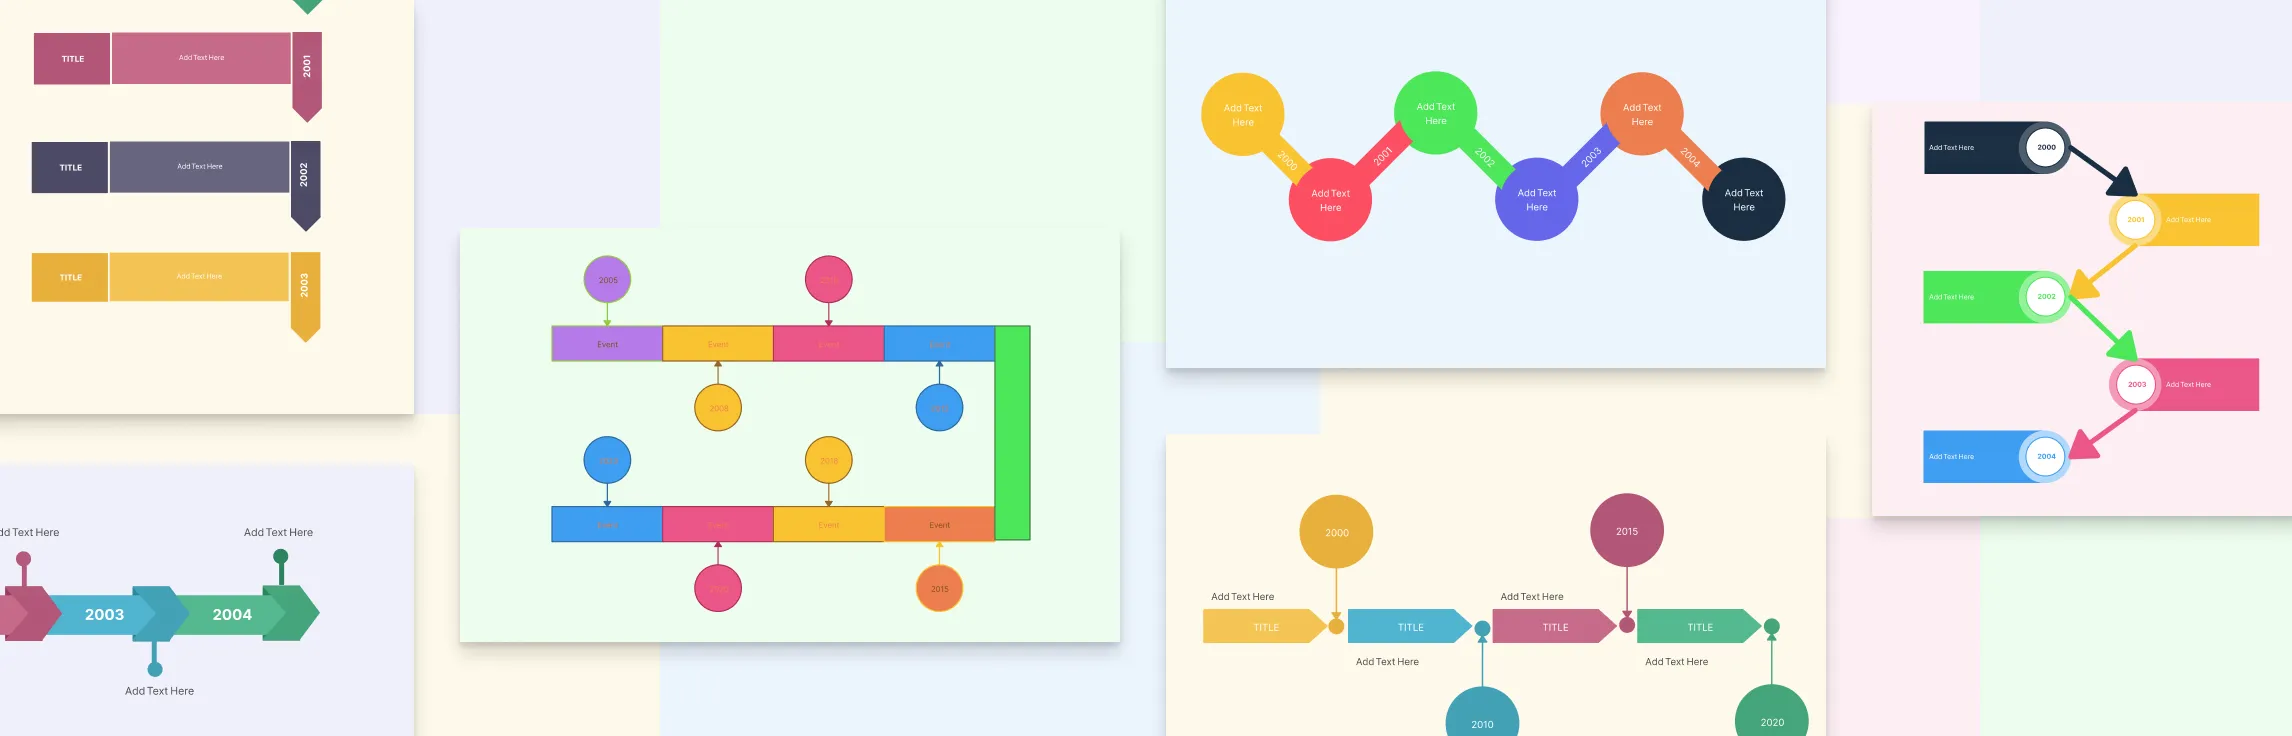
Now that you have an idea about the timeline symbols, let’s look at different types of timeline graphs. Timeline diagrams come in different formats to suit various needs. The most common types of timelines include;
- Horizontal timeline: The most common type, where events are placed along a left-to-right line. It’s ideal for showing a straightforward sequence over days, months, or years.

- Vertical timeline: Events are arranged top to bottom, making it useful for space-limited layouts or when displaying long sequences in a narrow format.

- Circular timeline: Events follow a circular path, which works well for cycles, recurring events, or creative visual presentations.

- S-shaped timeline: Events follow a winding, S-shaped path, combining horizontal and vertical movement to show a longer sequence in a compact and visually engaging way.

- Roadmap timeline: Focuses on key milestones and goals over time, often used in business or project planning to show progress toward a target.

Purpose and Uses of a Timeline Diagram
Timeline diagrams are versatile tools that help organize and communicate information clearly:
1. Historical narratives
Timelines are perfect for showing events in order, making it easier to understand the flow of history or the development of a story. For educators or writers, they provide a visual way to highlight key moments and how one event leads to another.
2. Project planning and progress tracking
In projects, timelines help teams track milestones, deadlines, and important tasks. Project timelines give a clear overview of what needs to happen when, making it easier to monitor progress and identify potential delays.
3. Communication tool
Timelines serve as an effective visual communication tool, helping teams, clients, or stakeholders quickly grasp the sequence of events, priorities, or project phases. They make discussions more focused and decisions faster.
4. Other uses
Beyond projects and history, timelines are useful for mapping personal goals, career milestones, product roadmaps, or any scenario where understanding the order and timing of events matters. They provide clarity and context in a simple, easy-to-read format.
Advantages and Disadvantages of Timelines
Timeline diagrams offer many benefits but also come with some limitations. Here’s a quick look at what makes them useful and where they might fall short:
| Advantages | Disadvantages |
| Provides visual clarity, making it easy to understand the sequence of events | Can become cluttered if too many events are added |
| Helps identify relationships, dependencies, and gaps in timing | Limited in showing detailed task information or complex workflows |
| Facilitates communication and alignment among teams and stakeholders | Not ideal for managing project execution or step-by-step processes |
| Offers a high-level overview, giving a quick understanding of overall progress or history | May oversimplify information, leaving out important context |
| Can be adapted to different formats (horizontal, vertical, circular) | Requires careful design to maintain readability and accuracy |
Comparing Timeline vs Gantt Chart vs Flowchart
Timeline diagrams are often confused with other visual tools, but each serves a different purpose. Understanding these differences helps you choose the right tool for your needs.
| Comparison | Timeline diagram | Gantt chart | Flowchart |
| Purpose | Shows sequence of events over time, high-level overview | Manages tasks, durations, and dependencies | Shows process steps, decisions, and flow |
| Focus | When events happen | How tasks are executed and their timelines | How processes or decisions flow |
| Detail level | High-level, big picture | Detailed, task-oriented | Process-oriented |
| Best use | Storytelling, summarizing events, historical or project overviews | Project management and task tracking | Process documentation and decision mapping |
| Limitations | Doesn’t show task dependencies or process flow | Can be complex and harder to read at a glance | Doesn’t show event timing or chronological order |
Free Timeline Templates
Now that you know what is a timeline, here are some free templates to help you get started.
Gradient Timeline

Monthly Timeline

Wedding Timeline Template

PowerPoint Timeline Template

Personal Timeline Template

FAQs About Timelines
Why are timelines important in project management?
What tools can I use to create a timeline?
How far back or forward should a timeline go?
When to use a timeline?
What is the difference between a timeline and a roadmap?