Interaction Diagram Definition
A UML Interaction Diagram is a type of behavioral diagram used to visualize how objects in a system interact through the exchange of messages. It focuses on the dynamic behavior of a system by showing what happens, when it happens, and which components communicate during a specific process or use case. Interaction diagrams capture the “conversation” between objects, helping designers and developers understand how parts of a system collaborate to achieve a goal.
Purpose of an Interaction Diagram
Visualize object collaboration: Shows how different objects or system components communicate to perform a specific task.
Model dynamic behavior: Represents the sequence and timing of messages exchanged between objects during system execution.
Clarify system logic: Helps teams understand how a particular use case or process flows from start to finish.
Validate design decisions: Allows designers to verify that interactions between objects align with intended functionality.
Identify inefficiencies or missing links: Highlights potential design gaps, redundant communication, or logic errors in workflows.
Facilitate team communication: Acts as a visual aid for developers, analysts, and stakeholders to discuss system behavior clearly.
Support debugging and maintenance: Provides a reference for tracing message flow when troubleshooting system issues.
Complement other UML diagrams: Works alongside structural diagrams (like Class or Component diagrams) to give a complete picture of how a system operates.
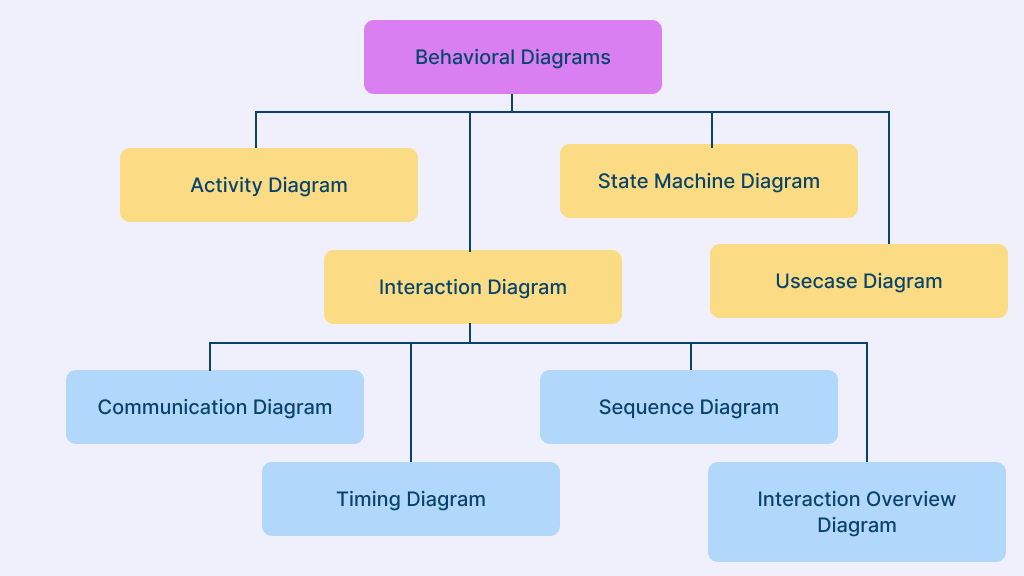
Types of UML Interaction Diagrams
UML defines four main types of Interaction Diagrams, each highlighting a different aspect of how system elements communicate and behave over time.
1. Communication Diagram
A Communication Diagram depicts the relationships and interactions among software objects in a system. It focuses on the structural connections between objects rather than the timing or sequence of messages. This makes it ideal for understanding how system components are linked and how they collaborate to complete a task.
Advantages:
- Highlights how lifelines (objects) are connected and related.
- Focuses on system organization rather than message flow.
- Useful for visualizing object networks and component interactions.
Limitations:
- Can become complex in large systems.
- Makes it harder to analyze the behavior of specific objects.
- Often time-consuming to create and maintain for detailed processes.


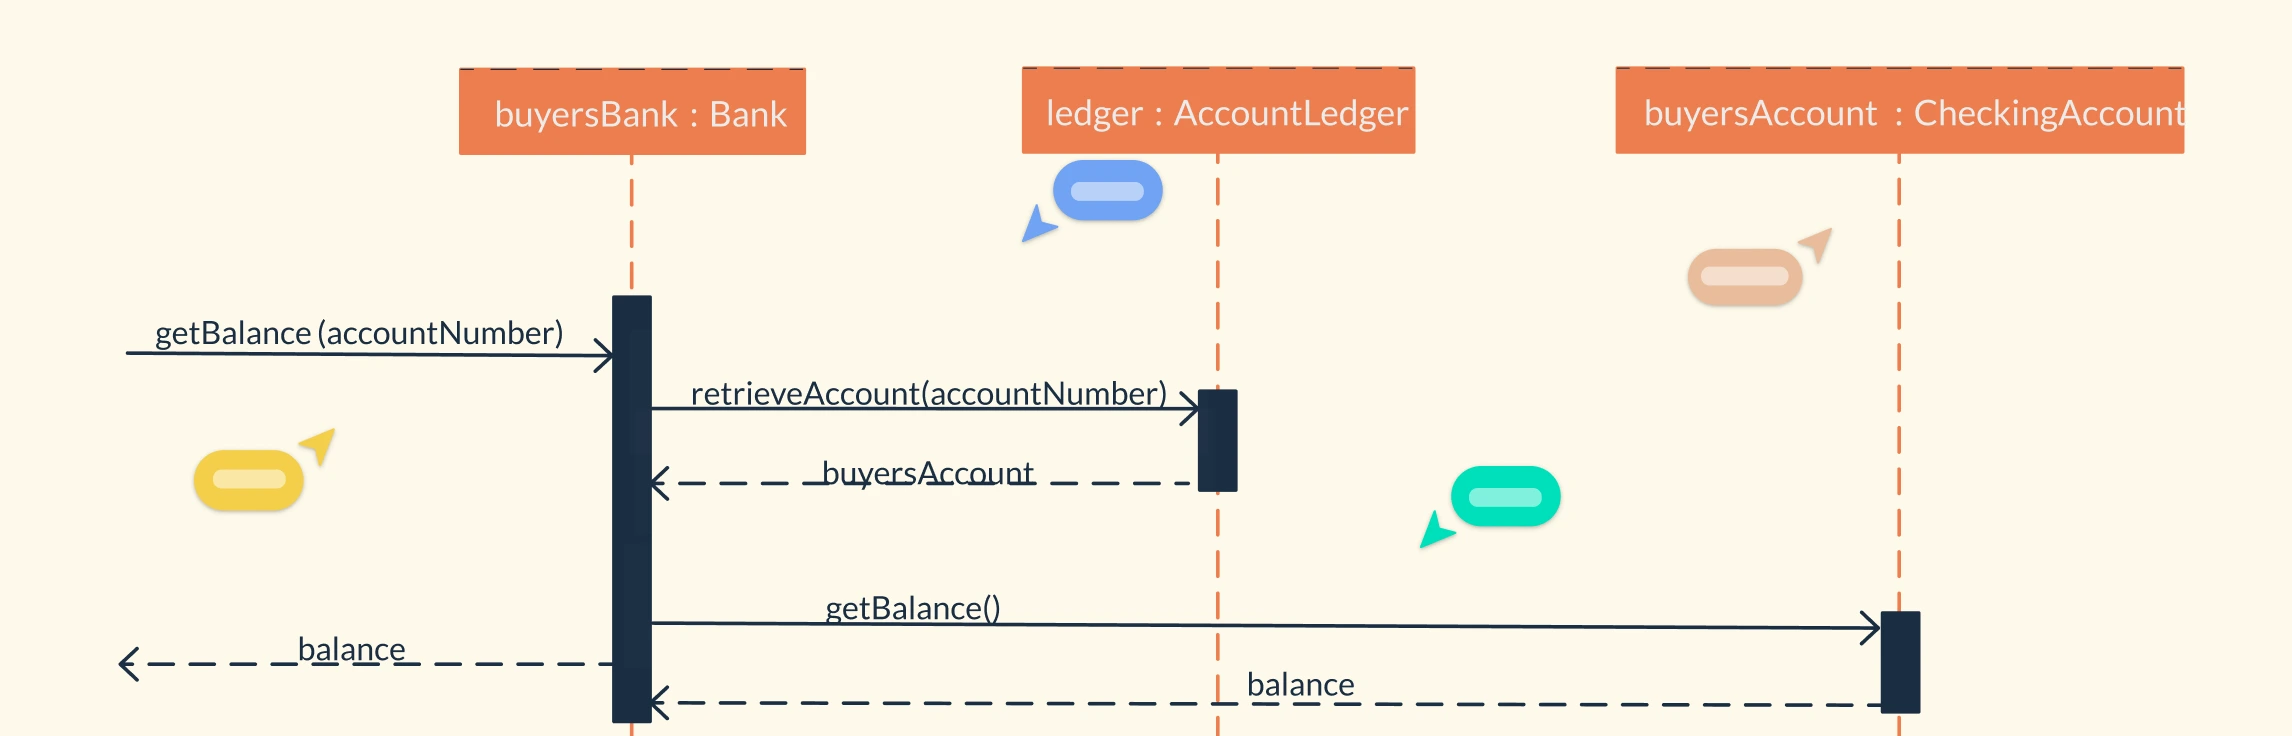
2. Sequence Diagram
A Sequence Diagram illustrates how messages are exchanged between objects over time. It provides a clear, chronological view of how operations occur within a specific process or use case. Each object involved has a lifeline, and messages are arranged vertically in order of occurrence. Sequence diagrams are especially useful for system modeling, debugging, and documentation of workflows.
Advantages:
- Easy to generate, update, and maintain.
- Supports forward and reverse engineering of system logic.
- Clearly shows message order and object dependencies.
Limitations:
- Can become cluttered when too many lifelines or branches are added.
- Accuracy depends on the correct sequencing of interactions.
- Harder to interpret in highly complex scenarios.
With Creately’s Sequence Diagram Tool, you can quickly visualize interactions, define message flows, and refine system logic.

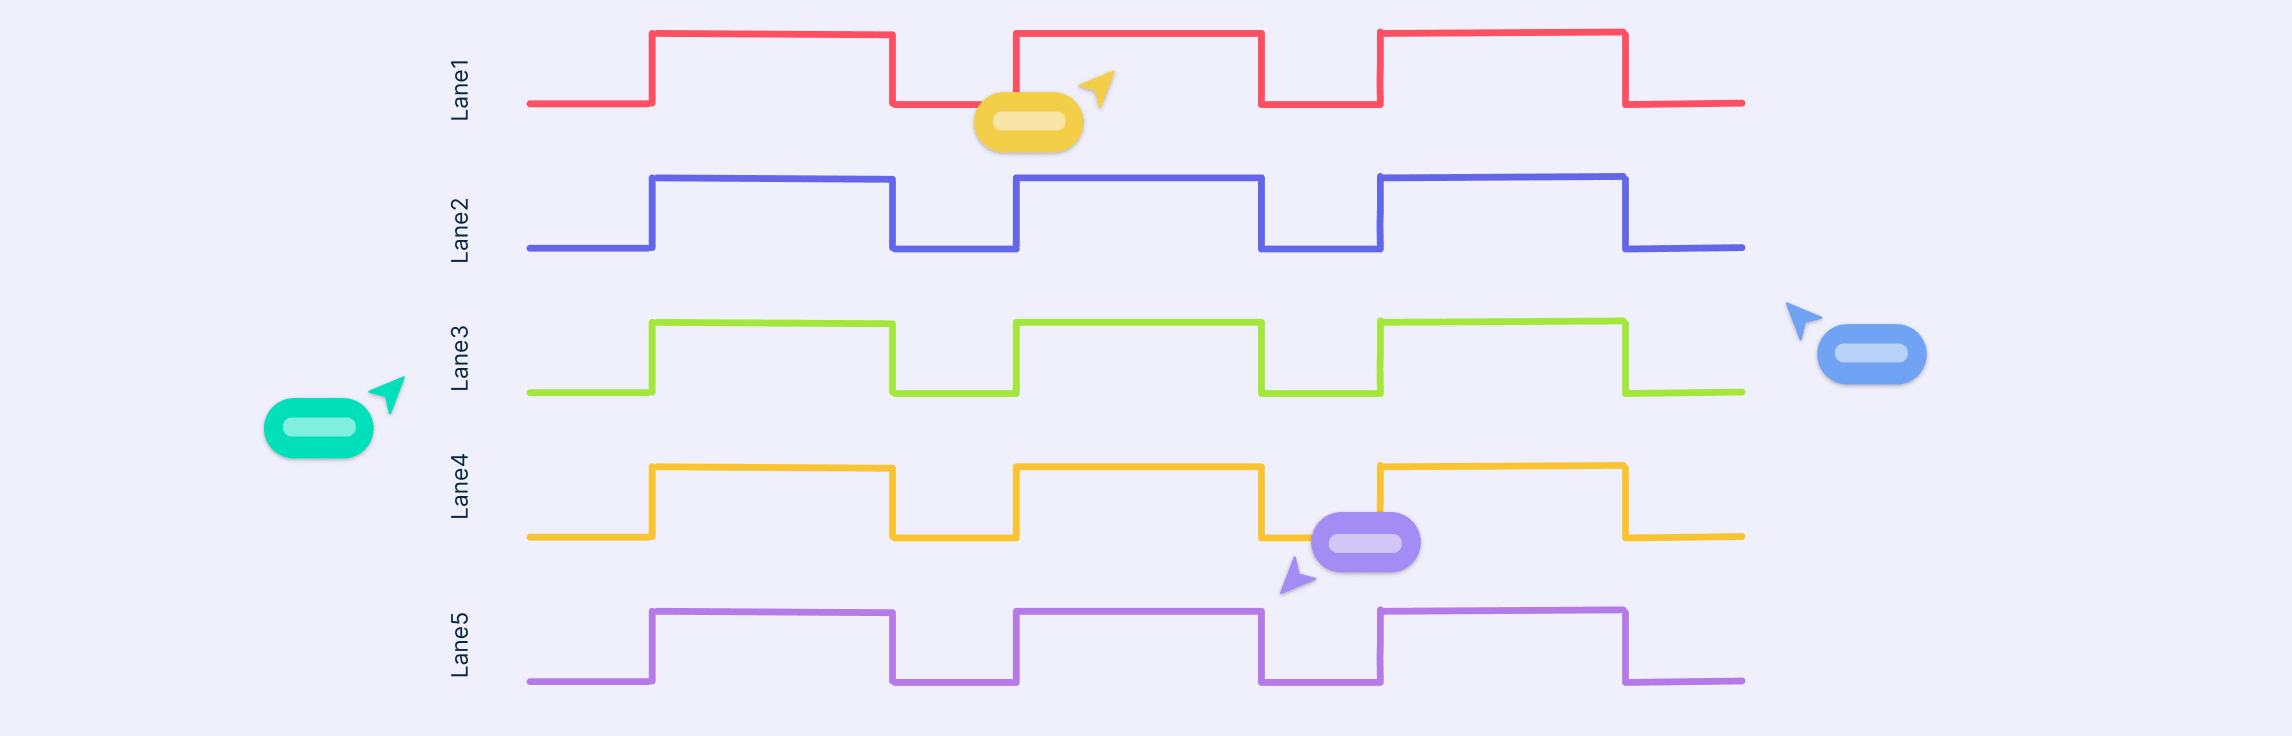
3. Timing Diagram
A Timing Diagram focuses on changes in object states over time, often represented using waveforms. It helps model time-sensitive behavior, showing how an object transitions between states at specific moments. This type of diagram is crucial for analyzing real-time systems, embedded processes, or any situation where timing and synchronization are critical.
Advantages:
- Represents object state at exact points in time.
- Supports forward and reverse engineering for precise modeling.
- Helps track state changes and response delays accurately.
Limitations:
- Can be difficult for beginners to understand or interpret.
- Requires careful maintenance as systems evolve.
- Not ideal for processes with many asynchronous interactions.
With Creately’s Timing Diagram Maker, you can effortlessly visualize state changes, signal transitions, and object lifecycles over time..

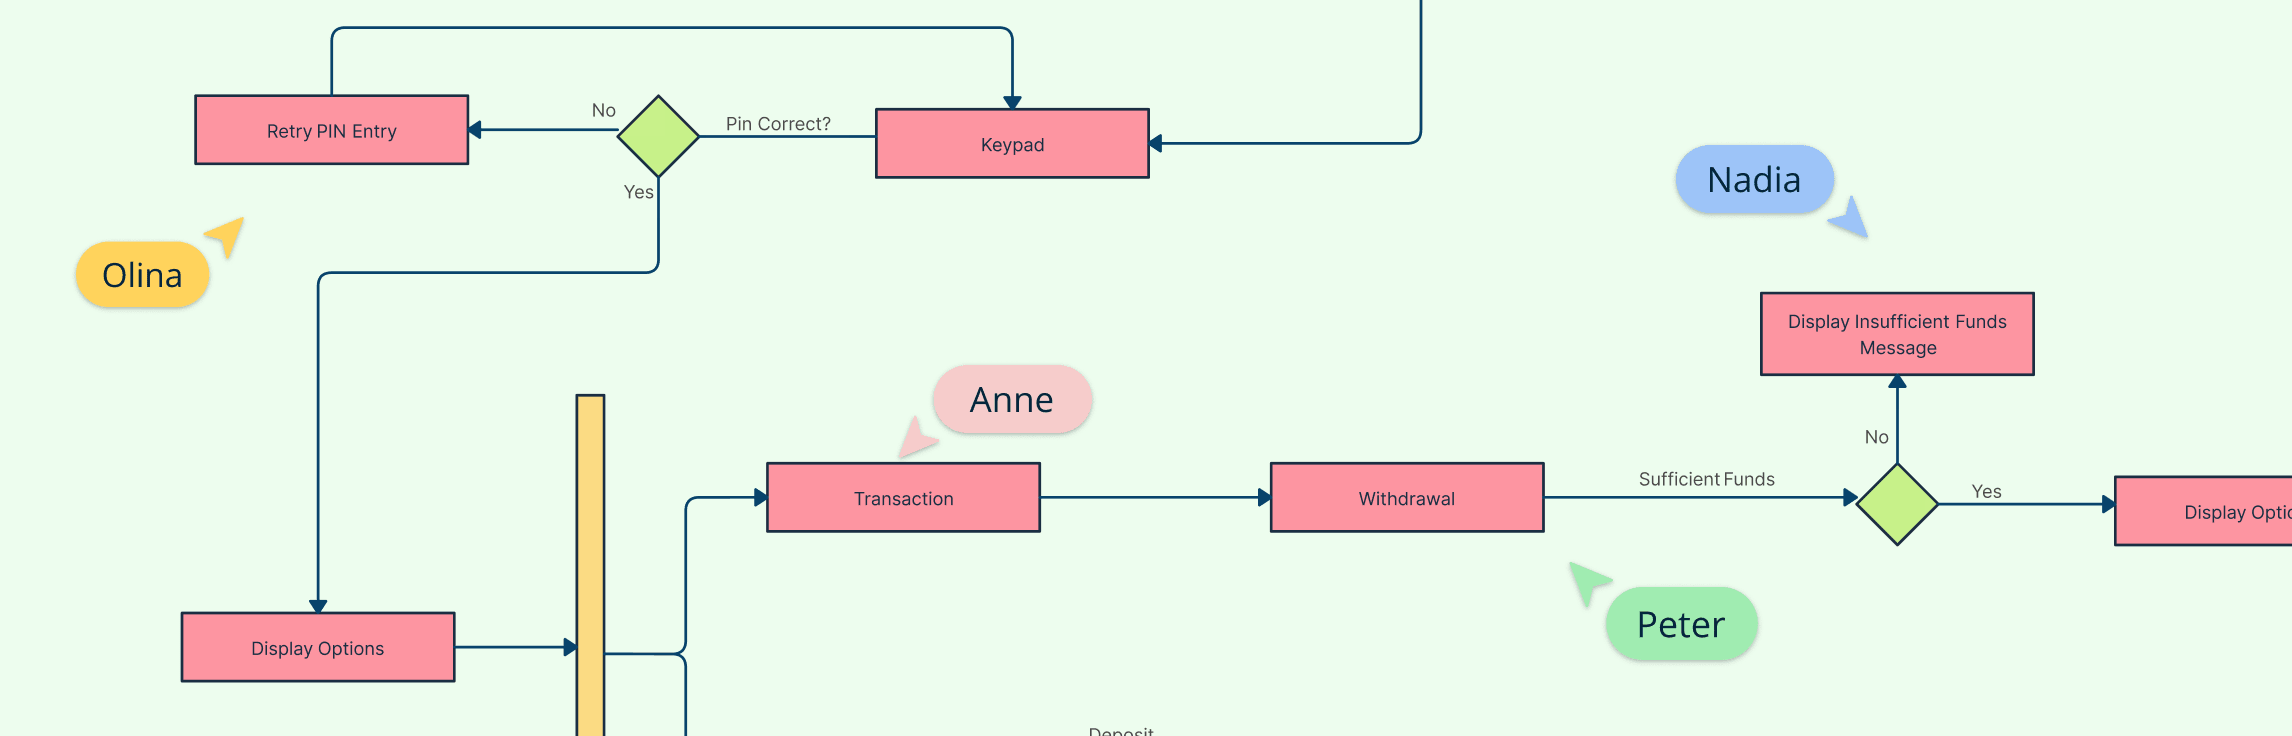
4. Interaction Overview Diagram
An Interaction Overview Diagram provides a high-level summary of interactions within a system. It acts as a control flow map connecting multiple interaction or activity diagrams. This makes it ideal for understanding complex workflows that include branching, decisions, or parallel interactions.
Advantages:
- Offers a clear, top-level view of activities across diagrams.
- Allows navigation between multiple interaction diagrams easily.
- Combines activity diagram features with added interaction elements for clarity.
Limitations:
- Requires consistent branching and behavioral structure.
- May oversimplify detailed interactions if not supported with sub-diagrams.

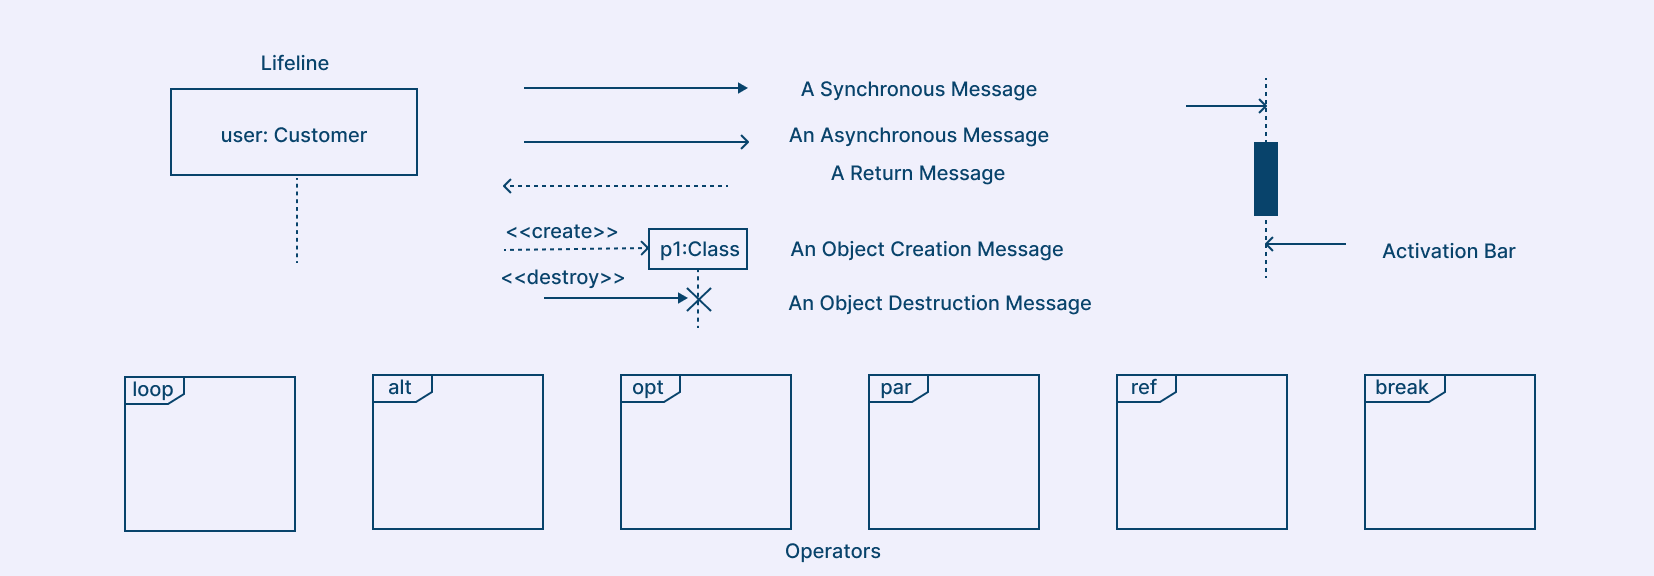
Interaction Diagram Symbols and Terminology
Lifeline
A lifeline represents a single participant such as an object, actor, or class instance in an interaction. It shows the existence and activity period of that participant throughout the scenario, indicating who is communicating and when they are active. It is drawn as a rectangle at the top (e.g., user:Customer) with a vertical dashed line extending downward to represent the object’s life over time.
Message Arrows
A message indicates communication between lifelines, showing how data or control flows within the system. It captures function calls, signals, or interactions that define the process order. Common message types include:
Solid arrow with filled head → synchronous message
Solid arrow with open head → asynchronous message
Dashed arrow → return message
Arrow pointing to a new object → object creation message
X at the end of a lifeline → object destruction message
Activation Bars
An activation bar represents when an object is active or performing a process. It visually shows the duration of an object’s execution and helps readers understand which component is controlling the flow at any given time. Depicted as a thin vertical rectangle placed on a lifeline, aligned with messages entering and leaving it.
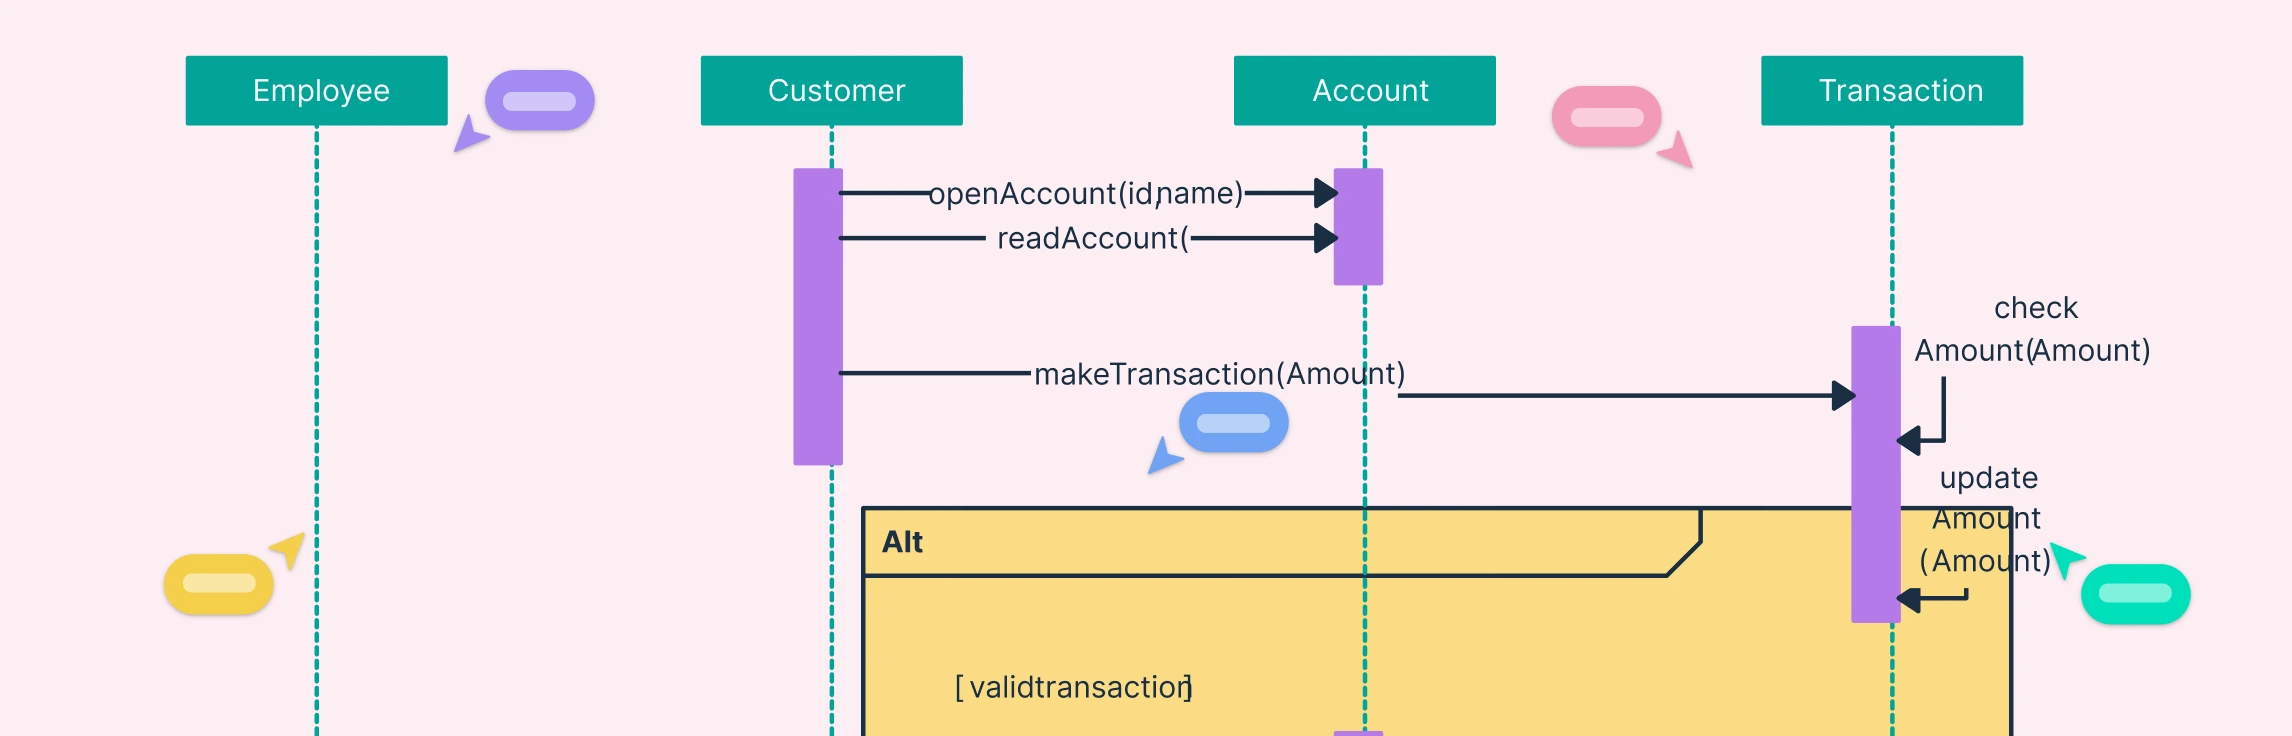
Operators
Operators define the logic that governs how interactions occur, such as branching, looping, or parallel actions. They make it possible to model conditional and repetitive flows clearly within a single diagram. Displayed as a rectangular frame labeled in the top-left corner with keywords such as:
alt – alternative paths
opt – optional flow
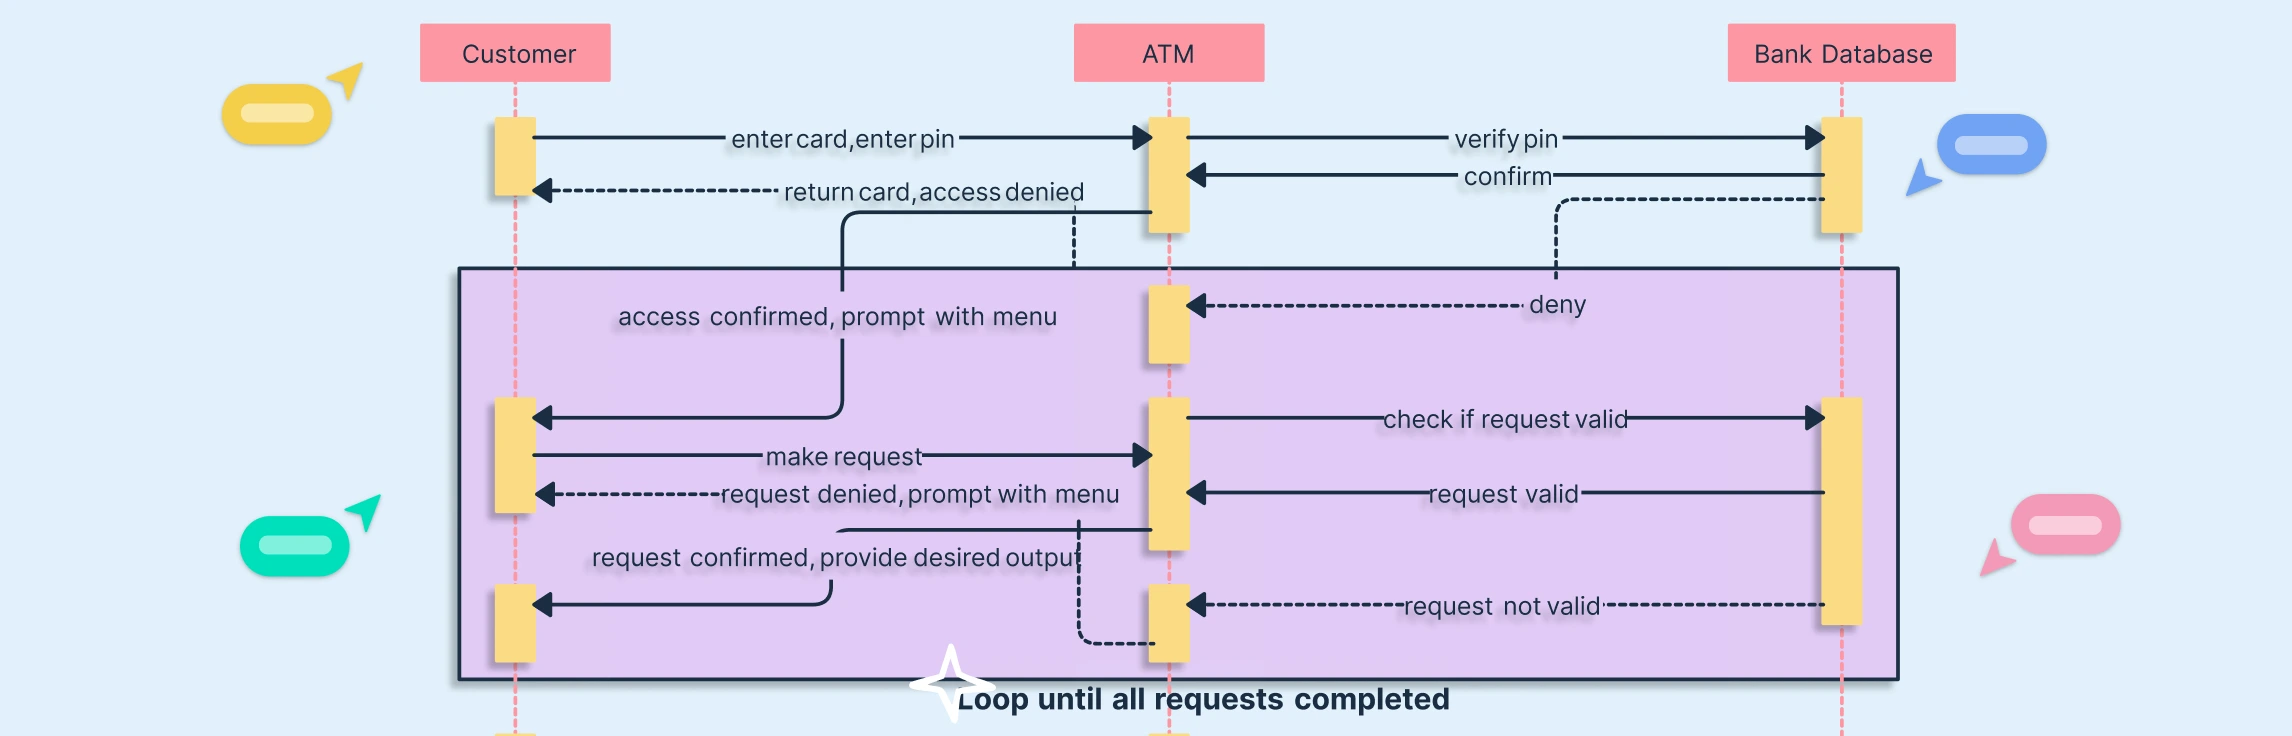
loop – repeated actions
par – parallel execution
ref – reference to another interaction
break – interruption of flow
Guard Conditions
Guard conditions are logical expressions that determine whether a message or action should occur. They ensure that only valid branches of an interaction are executed, functioning like conditional statements in programming. Written in square brackets next to a message or fragment, for example [paymentSuccessful].
State Invariants
A state invariant specifies the condition or state that a lifeline must maintain at a certain point in the interaction. It defines constraints to ensure system behavior remains consistent as interactions progress. Shown as text enclosed in curly braces {} placed beside a lifeline, such as {state = active}.
How to Draw an Interaction Diagram
Step 1: Choose the Right Interaction Diagram Template
Start by selecting a suitable diagram template for your purpose. In Creately, you’ll find pre-built templates for all four interaction diagram types which can be customized immediately.
- Sequence Diagram – visualize object interactions chronologically.
- Communication Diagram – emphasize object relationships and messages.
- Interaction Overview Diagram – show multiple interactions and their sequence.
- Timing Diagram – illustrate state or value changes over time.
Step 2: Define the Scenario
Identify the system use case you want to visualize. Example: User logs into an application. Use a sticky note on the infinite canvas to capture the use case objective before diagramming. It helps keep context visible while you design.
Step 3: Identify Objects and Actors
List all participants and their roles in the scenario, then represent them visually in your diagram. Once you’ve defined these participants, drag and drop UML actor and object shapes from the shape library to represent each one.
- User – Initiates login.
- LoginPage – Accepts credentials.
- AuthService – Validates input.
- Database – Verifies stored user data.
Step 4: Add Lifelines or Nodes
Depending on the diagram type:
- Sequence Diagram: Add vertical lifelines for each participant.
- Communication Diagram: Represent each object as a node connected by lines.
- Interaction Overview Diagram: Use frames or references representing sub-interactions.
- Timing Diagram: Show lifelines with horizontal timelines indicating state changes.
Step 5: Draw Message Flow
Define how objects interact during the scenario. Example sequence:
- User → LoginPage: enterCredentials()
- LoginPage → AuthService: verifyUser()
- AuthService → Database: queryUser()
- Database → AuthService: returnResult()
- AuthService → LoginPage: showSuccess()
Once you’ve mapped the logical flow, start linking the participants visually with message lines. You can add message names next to the connectors for clarity and even enable automatic numbering to show sequence order in communication diagrams.
Step 6: Add Return Messages, Conditions, or States
After defining the main message flow, show how the system responds or changes state during each interaction. For example:
- [Invalid password] showErrorMessage()
- [ Timeout ] retryConnection()
- State transitions in a Timing Diagram: Idle → Processing → Verified
Once your conditions and alternate paths are clear, use UML Fragments such as alt, opt, or loop to group related interactions visually. You can also apply colors or frame labels to highlight decision points and loops for better comprehension.
Step 7: Add Notes and Annotations
After completing your message flow and conditions, include contextual notes that explain assumptions, edge cases, or asynchronous message types. This helps make the diagram self-explanatory for reviewers and developers.
Step 8: Review, Collaborate, and Refine
Once your diagram is complete, review it for logical accuracy and consistency. Verify that all messages have valid senders and receivers, and that alternate paths, return messages, and conditions align with your scenario. Invite collaborators to edit the interaction diagram live, add comments directly on shapes, and tag teammates for feedback.
Benefits of Using Interaction Diagrams
Encourage early problem detection: Helps identify logic errors, timing issues, or inconsistent dependencies before implementation, reducing costly fixes later.
Enhance documentation and traceability: Serves as clear visual documentation that captures system interactions, making it easier to track design changes and maintain alignment with requirements.
Simplify system reviews and audits: Provides an easy-to-read visual reference for technical audits, code reviews, or compliance checks, ensuring the system behaves as intended.
Improve collaboration across disciplines: Bridges communication between developers, testers, analysts, and non-technical stakeholders by offering a shared visual understanding of workflows.
Support training and onboarding: Acts as an educational tool for new team members to quickly grasp system logic and interaction flow without diving into code.
Promote reusable design patterns: Encourages the reuse of proven interaction sequences and message flows across similar modules or projects.
Assist in performance optimization: Helps visualize message bottlenecks or redundant communication paths that could affect efficiency, leading to better system performance.
Increase design consistency: Ensures that all interactions follow consistent modeling standards, improving overall clarity and maintainability.
Facilitate system evolution: Makes it easier to modify or extend system behavior in the future since dependencies and interactions are already visually mapped.
Strengthen verification and testing: Provides a reference for creating test cases that reflect real interaction scenarios, improving coverage and test accuracy.
Free Interaction Diagram Templates to Get Started


FAQs about Interaction Diagrams
Can interaction diagrams be used for real-time systems?
Who uses interaction diagrams?
How do interaction diagrams differ from activity diagrams?
Can interaction diagrams represent conditional behavior?
Resources
Evans, Andy, et al. UML 2000 - the Unified Modeling Language: Advancing the Standard. Springer, 29 June 2003.
Vidgen, R. “Requirements Analysis and UML - Interaction Diagrams and State Transition Diagrams.” Computing and Control Engineering, vol. 14, no. 3, 1 June 2003, pp. 7–11, https://digital-library.theiet.org/doi/abs/10.1049/cce%3A20030301 .