Organizational charts are powerful tools that help us understand how a company is set up and how people work together. In this guide, we’ll explore what an org chart is, its key parts, a bit of history, how it’s used, different types, the pros and cons, and real examples. Whether you’re creating one or just curious, this guide has you covered!
Organizational Chart Definition
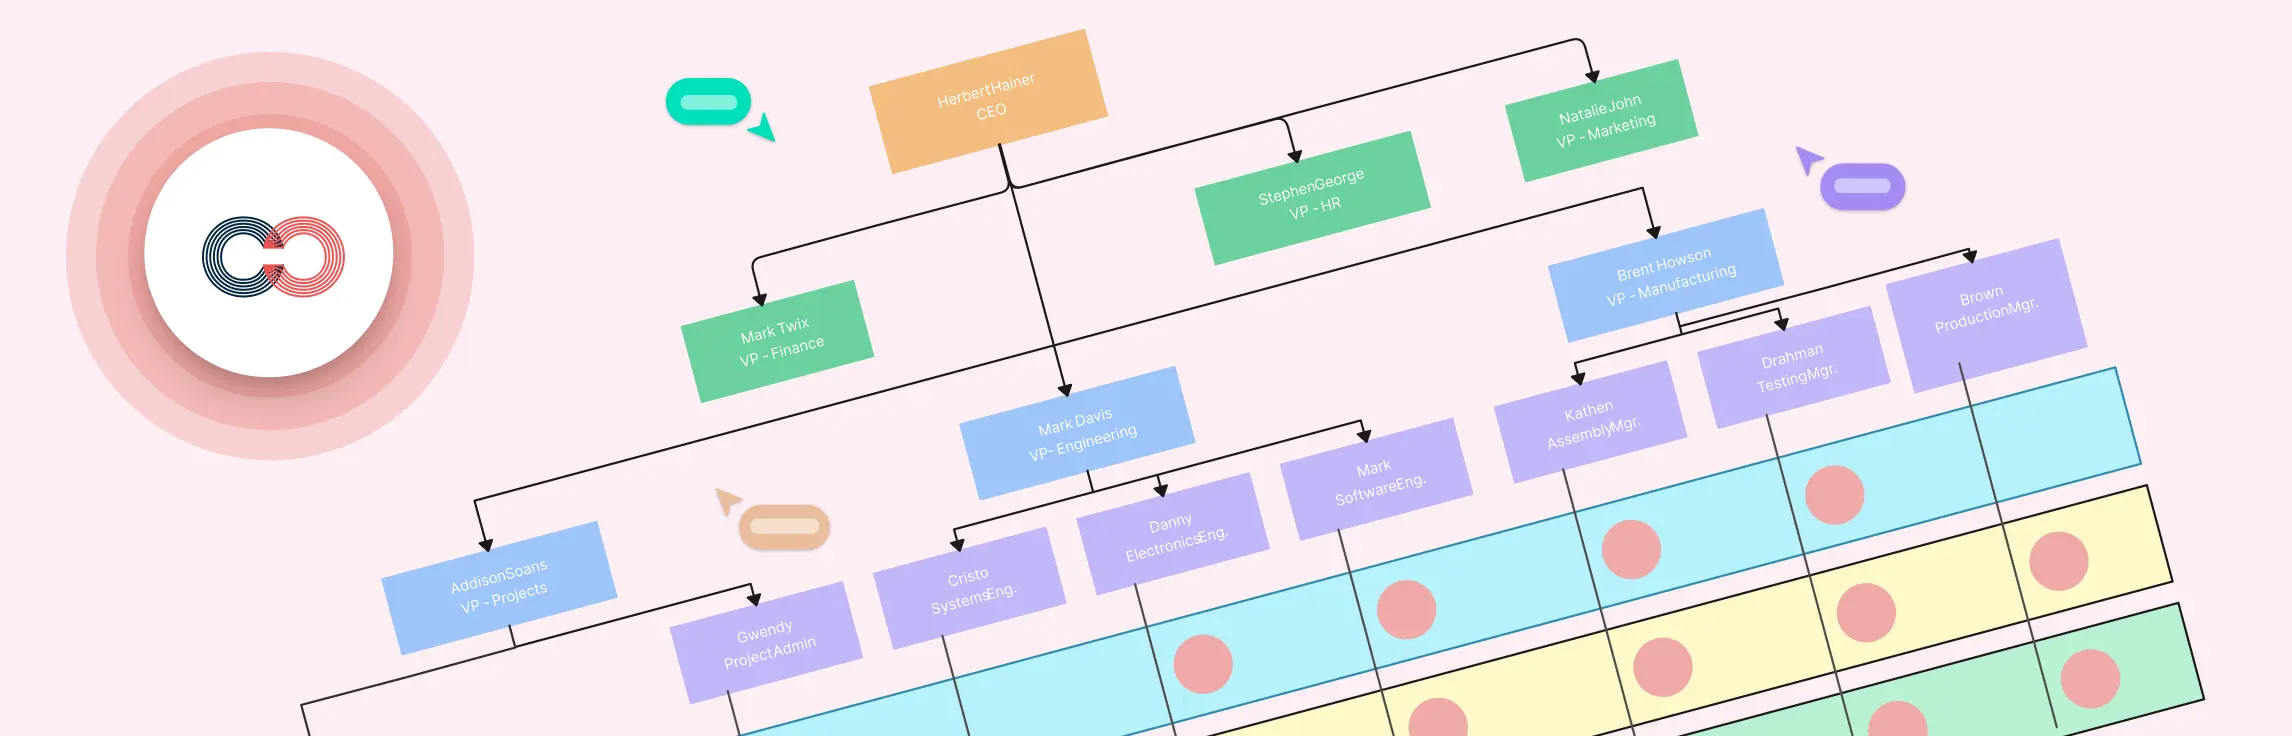
An organizational chart, often referred to as an org chart, is a visual representation that outlines the structure of an organization. It illustrates the hierarchy of roles, departments, and reporting relationships within the company.
Typically, these charts depict individuals or positions as boxes or circles, connected by lines that indicate reporting lines and relationships. This diagrammatic approach helps clarify the chain of command and the flow of authority from top management down to individual contributors. Org charts can be broad, covering the entire organization, or focused on specific departments or teams.
History of Org Charts
Organizational charts date back to the mid-1800s during the rapid growth of the U.S. railroad industry. In 1855, Daniel McCallum, superintendent of the New York and Erie Railroad, created one of the first modern org charts to manage a rapidly expanding rail system with nearly 500 miles of track (Mankins and Garton, 2017). Working with engineer George Holt Henshaw, he designed a tree-like diagram showing administrative duties and relationships, improving clarity and efficiency.
Unlike today’s typical hierarchy charts, McCallum’s design allowed decentralized decision-making by placing the board of directors at the root and departments as branches.
As businesses grew, org charts evolved into the pyramid-shaped hierarchies common in the 20th century. Today, they remain essential tools for visualizing company structures, now often in digital formats.
Key Components of an Org Chart
An organizational chart is made up of a few important parts that help show how a company works:
- Roles and titles: These are the names of jobs or positions people hold, like manager, designer, or CEO.

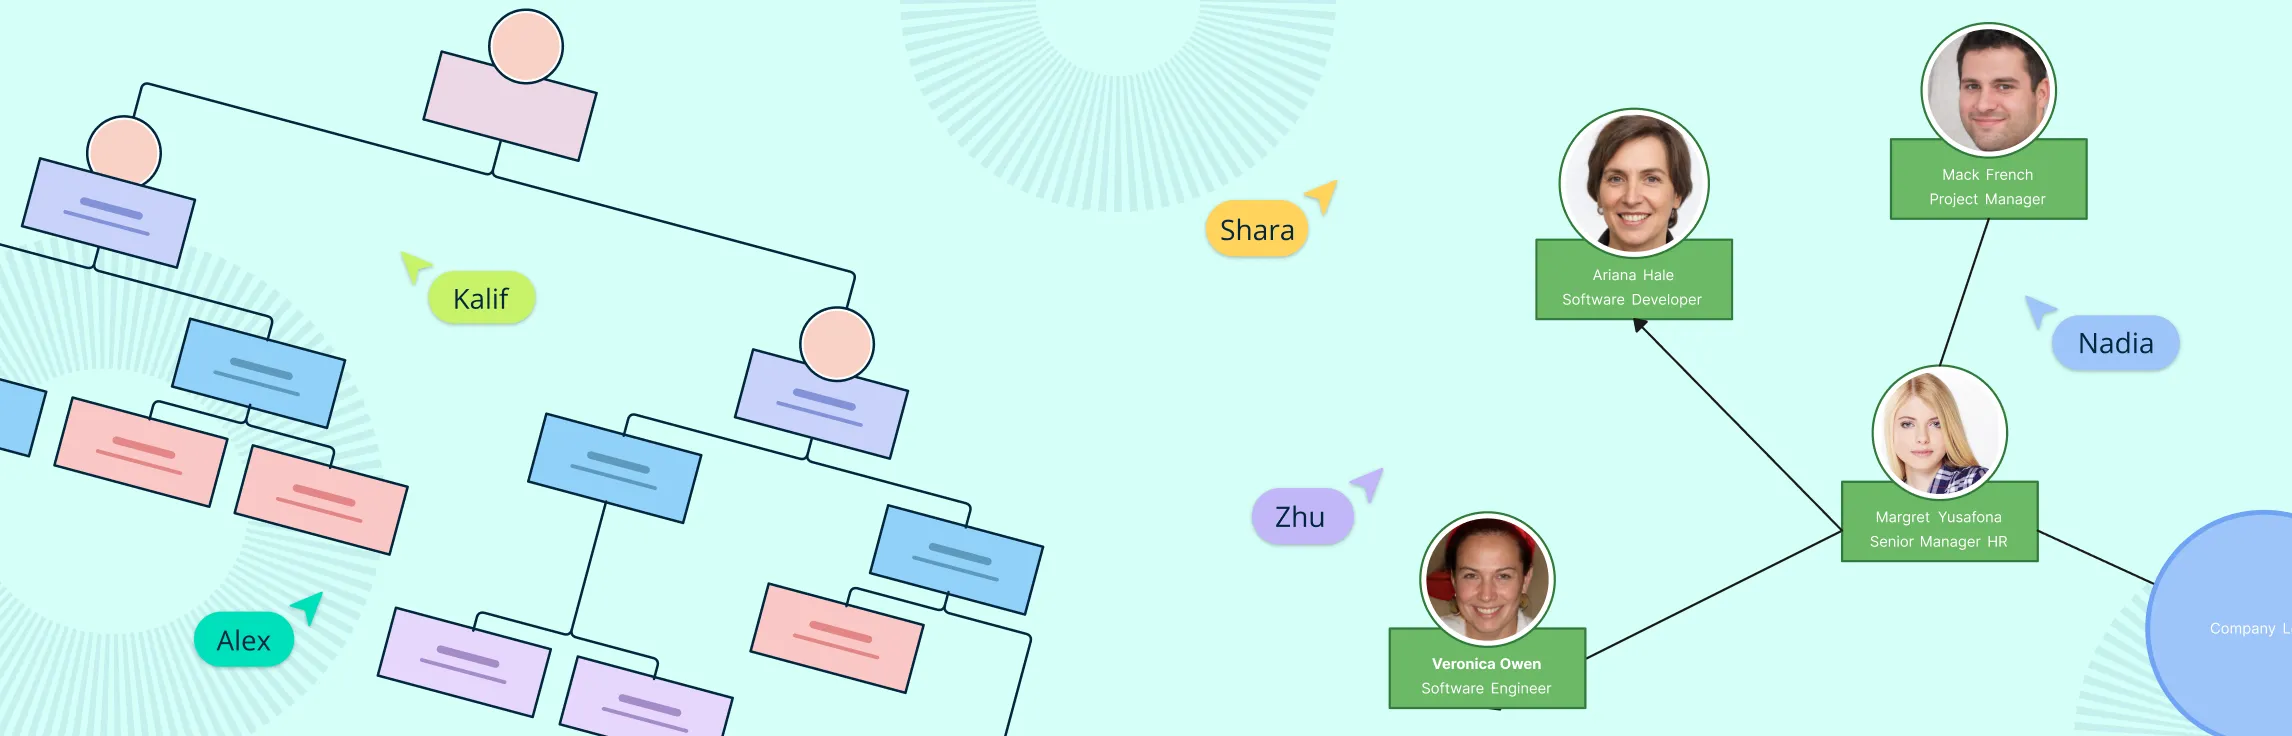
- People: Sometimes the chart shows the names or photos of the individuals in each role.

- Lines and connections: These lines link the boxes or circles to show who reports to whom, so you can see the chain of command.

- Departments or teams: The chart groups roles into different sections based on teams, like marketing, sales, or customer support.
Uses of Org Charts
Organizational charts are valuable tools that help businesses and teams work better by clearly showing how everything fits together. Here are some important ways org charts are used:
Clarifying roles and responsibilities: Org charts show who holds each position and what their duties are. This helps avoid confusion about who is responsible for what tasks. Gallup reports that only 45% of younger workers clearly know what is expected of them at work, which highlights the need for role clarity tools (Gallup, 2024).
Improving communication: By visually mapping relationships and reporting lines, org charts make it easier for employees to know who to contact for information, approvals, or support. McKinsey found that improving communication and collaboration can raise productivity by 20-25% for interaction-heavy work (Keller and Meaney, 2013).
Helping new employees get oriented: When someone joins a company, an org chart helps them quickly understand the structure, so they know who their manager is and how different teams connect. Gallup also found only 12% of employees strongly agree their organization does a great job onboarding, showing how important structured orientation is (Gallup, 2018).
Supporting organizational planning: Leaders use org charts to see if there are gaps where new roles might be needed or if some positions overlap. This makes planning for growth or restructuring simpler. Deloitte reported 92% of companies view organizational redesign as important, and over 80% were restructuring or had recently done so (Deloitte, 2016).
Enhancing teamwork: When people understand how their team fits within the bigger picture, they can collaborate more effectively and align their efforts with company goals.
Guiding decision-making: Clear reporting lines and role definitions help managers assign tasks and projects more efficiently, improving overall productivity.
Types of Organizational Charts
Organizations come in all shapes and sizes, so there are different types of org charts to match how they’re structured. Here are the most common types:
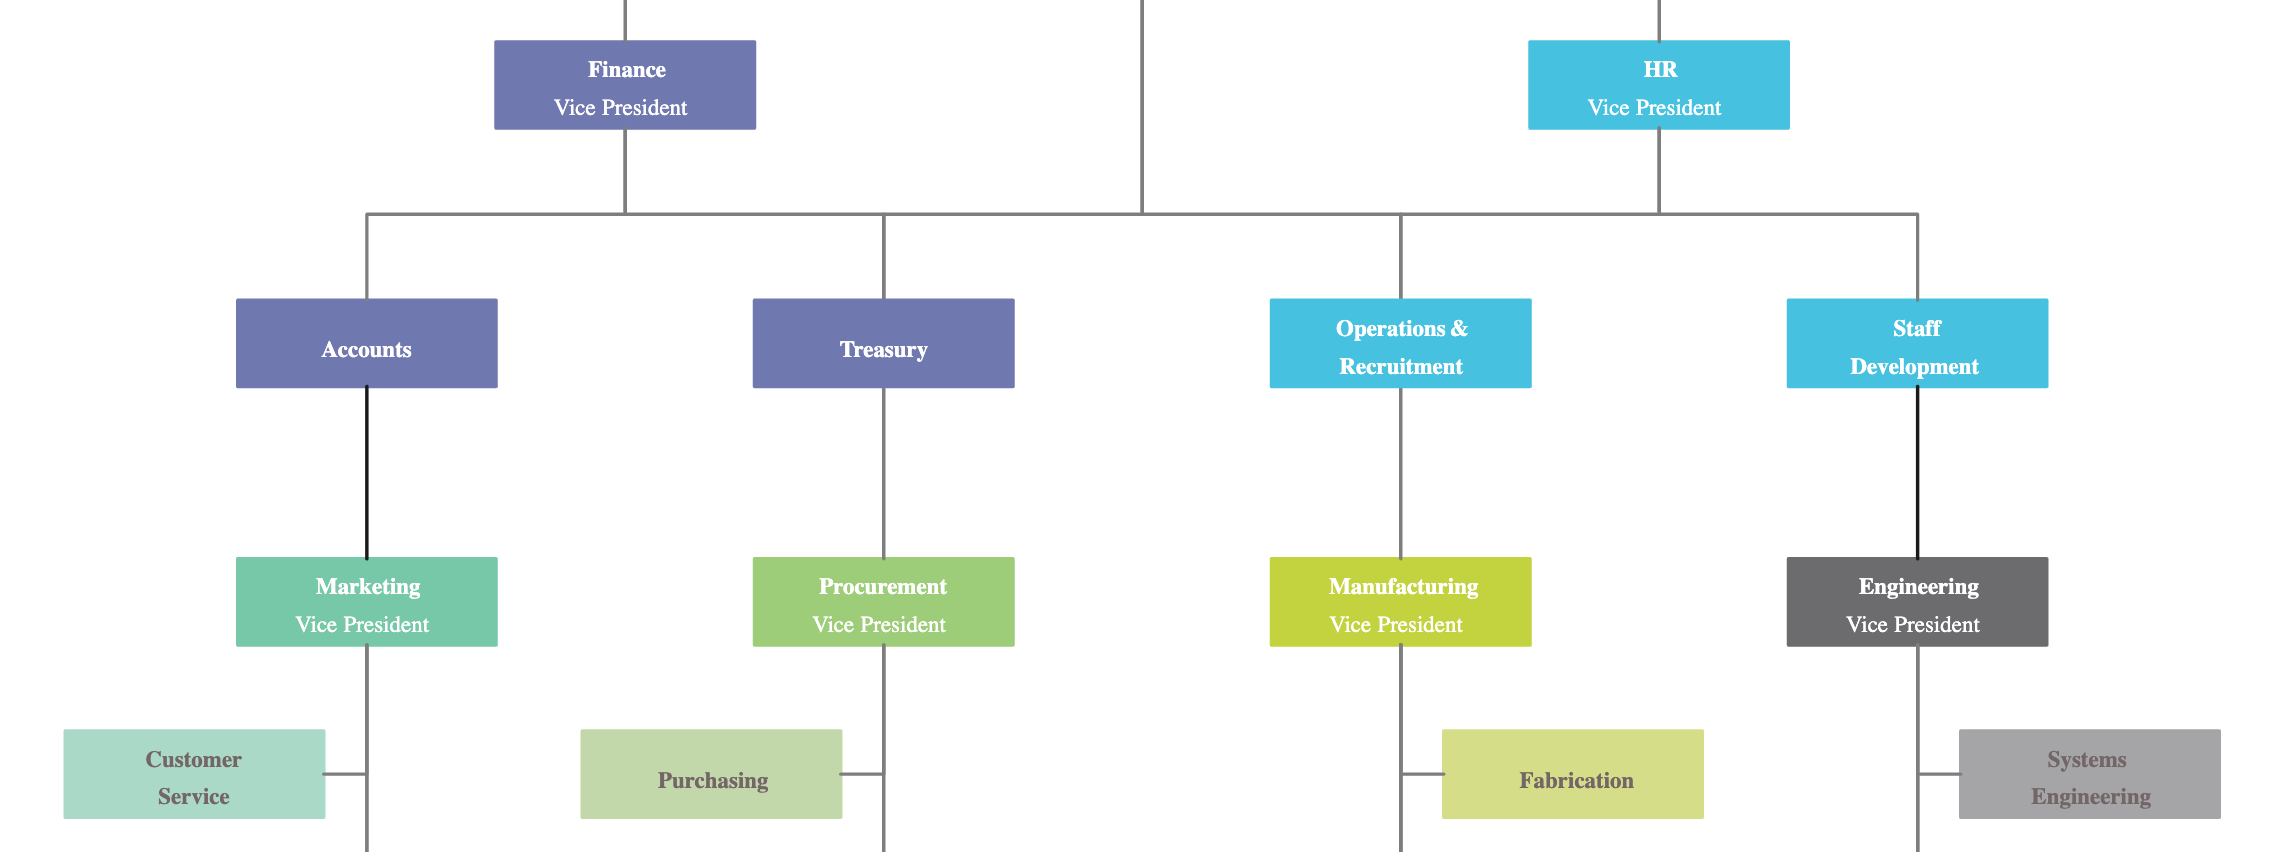
- Hierarchical chart: This is the classic “top-down” chart. It shows a clear chain of command, with leaders at the top and employees below them. It remains common in traditional organizations, though many large companies now combine hierarchy with cross-functional structures.


- Flat chart: In a flat org chart, there are few or no middle managers. It promotes open communication and teamwork, often found in startups or small businesses.

- Matrix chart: This type shows employees reporting to more than one manager — usually both a functional manager (like marketing) and a project manager. It’s common in complex companies working on multiple projects: a Berkeley study found 90% of surveyed companies were at least somewhat matrixed (52% somewhat, 38% highly) (Marmolejo et al., 2021).

- Divisional chart: Here, the organization is divided by product lines, regions, or customer groups. Each division operates like its own mini-company with its own departments.

- Team-based chart: Focused on teams instead of individual roles, this chart highlights collaboration and is often used in project-driven or agile workplaces.

- Network chart: This chart emphasizes relationships and connections between different groups or organizations, rather than formal hierarchy. It’s common in partnerships or decentralized companies, and aligns with Deloitte’s “network of teams” trend where organizations shift away from rigid silos toward more flexible collaboration models.

Pros and Cons of Org Charts
| Pros | Cons |
| Provides a clear visual structure that shows exactly who reports to whom, helping everyone understand the chain of command. | Can create a rigid view of the organization, making it seem overly hierarchical and less flexible. |
| Improves communication by helping employees quickly find the right person to contact for approvals, support, or information. | May not capture informal relationships, collaborations, or cross-team interactions that happen in real life. |
| Helps new hires get up to speed faster by clearly showing the company’s structure and where they fit in. | Requires frequent updates to remain accurate; outdated charts can cause confusion or miscommunication. |
| Assists leaders in identifying gaps, overlaps, or bottlenecks in roles, making it easier to plan for growth or restructuring. | Can oversimplify roles and responsibilities, especially when employees have multiple or shared duties. |
| Boosts accountability by clearly defining who is responsible for what, reducing confusion and overlap. | Might discourage flexibility and innovation by reinforcing strict reporting lines and roles. |
Examples of Organizational Charts
To better understand how org charts work, here are a few common organization chart templates from different types of organizations:
Project Management Organizational Structure

McDonalds Org Chart

Organizational Chart for Transport Company

University Organizational Chart

Airline Organizational Structure Chart

References
Business process and system modeling tools and packages. (2004). Practical E-Manufacturing and Supply Chain Management, pp.112–145. doi:https://doi.org/10.1016/b978-075066272-7/50008-7.
Bannon, J.J. (1982). The Organizational Chart: The Manager’s Toy. Journal of Physical Education, Recreation & Dance, 53(4), pp.47–48. doi:https://doi.org/10.1080/07303084.1982.10631093.
FAQs About Org Charts
What is the best organizational structure?
What are the most commonly used organizational charts?
Why is an organizational chart important?
What are the limitations of org charts?
How to make an organizational chart?
Who uses an organizational chart?