Business Diagram Software
Effectively Leverage Business Data with Business Diagramming Software
Bring together business data, processes, and information on a single business mapping software to analyze, discover breakthrough insights, and make informed strategic decisions with your team.
Intuitive business diagramming tools to visualize ideas, processes, and solutions faster
Real-time collaboration to connect teams across the globe
Seamlessly integrate workflows across your organization with business mapping software
- Intuitive business diagramming tools to visualize ideas, processes, and solutions faster
- Real-time collaboration to connect teams across the globe
- Seamlessly integrate workflows across your organization with business mapping software
Over 10 Million people and 1000s of teams already use Business Diagram Software by Creately

Discover Insights Faster with Business Diagramming Tools
")
Plan, strategize, and ideate faster with templates for 100s of business use cases.
Run structured brainstorming sessions with an interactive online whiteboard.
Migrate business intelligence data from any sources to visualize for quick analysis.
Freehand drawing to assist with visualizing strategies and freehand note-taking.
")
Easily visualize your business concepts with powerful business mapping software
Make simple to complex business diagrams instantly with easy drag-drop tools.
Customize your business diagrams instantly with quick custom styling options.
Create flowcharts, org charts, VSMs, SWOTs, & more with professional shape libraries.
Better arrange business data by diagramming business processes efficiently
")
Create interactive presentations, reports, & dashboards for strategies and plans.
Add more context to your business plans with imported images, screenshots, and more.
Centralize all business information in a single location with integrated notes.
Export your business diagrams as PDFs, PNGs, or SVGs to share or publish.
")
Connect All Teams Across the Board with Business Diagram Software
Facilitate team business discussions and decision-making on a shared canvas.
Integrated commenting to share feedback and for async collaboration.
Keep track of each iteration of your workspace with full version history.
Stay updated on the changes other stakeholders make with smart notifications.

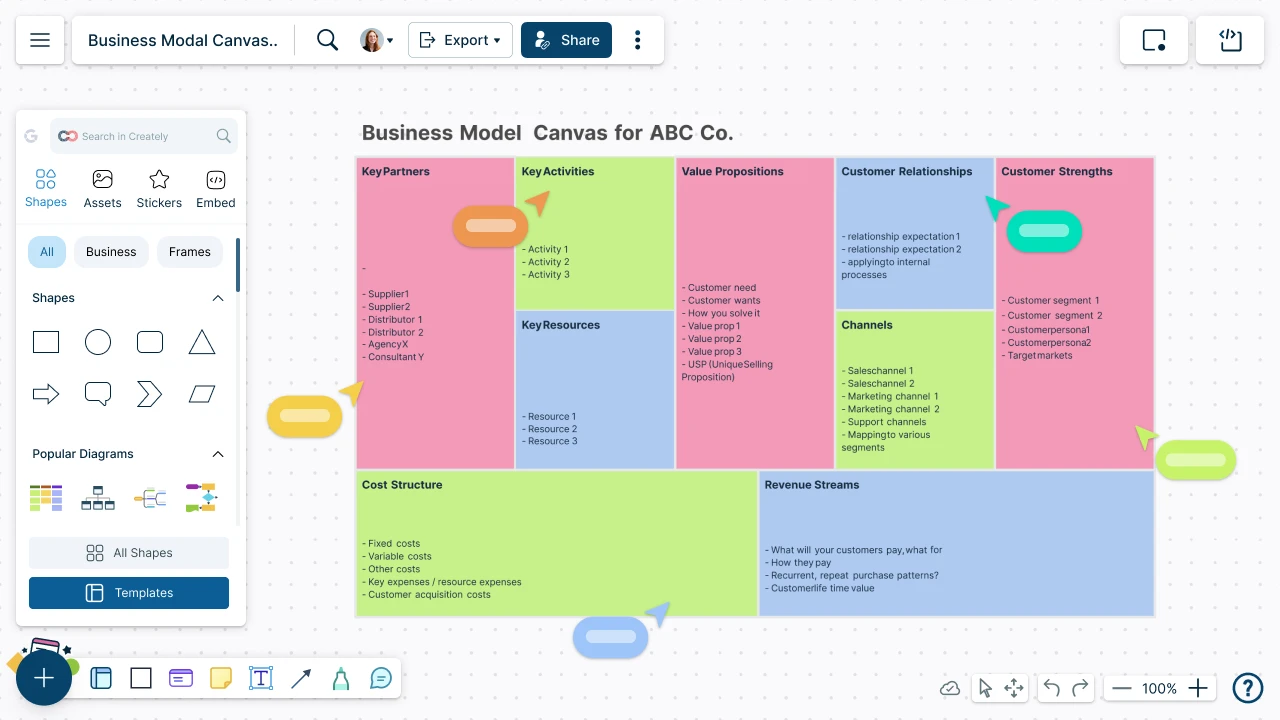
What is a Business Diagram?
How to Create a Business Diagram Collaboratively?
Set Up Your Workspace
Open Creately and create a workspace for your business diagram. Add relevant team members or stakeholders as collaborators to allow them to make edits. You can use real-time mouse cursors and synced previews to easily track the changes other participants make in the workspace.
Conduct a Comprehensive Analysis of the Business Environment
Perform a thorough analysis of the different business elements and plans to be included in the business diagram. As the team comes up with ideas, they can put them down on sticky notes and add them on a post-it note wall on the canvas.
Identify Key Business Diagram Types
Identity key diagram types which will be essential for decision making and strategic planning. Creately provides a wide variety of business diagram types to visualize your business plans, models, and processes. Browse through Creately templates library and select a desired business diagram type. Or you can enable the relevant shape library and create one from scratch.
Draft and Customize Your Business Diagram
Using the information gathered, create a rough draft of the business diagram. Then customize and edit the business plan diagram to the organization’s requirements and brand guidelines.
Gather Real-Time Feedback on Business Diagrams
As you create the business diagram, team members and colleagues can provide real-time feedback on changes or improvements using comments. Changes done to the diagram can be tracked and reverted with version history.
Finalize and Share with Stakeholders
Finalize the business diagrams and share them with multiple stakeholders in various image formats. Alternatively, you can also use an embed code to securely embed the diagram in any site, intranet, or app.
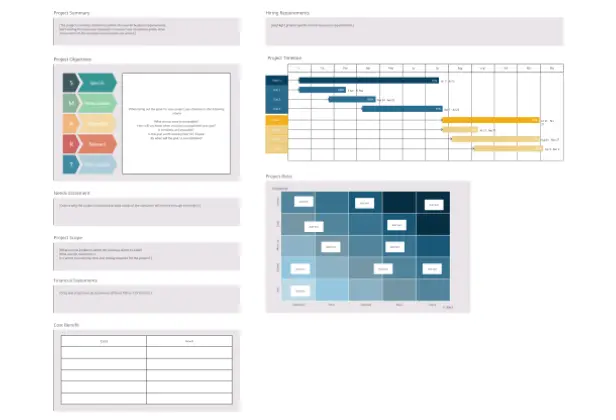
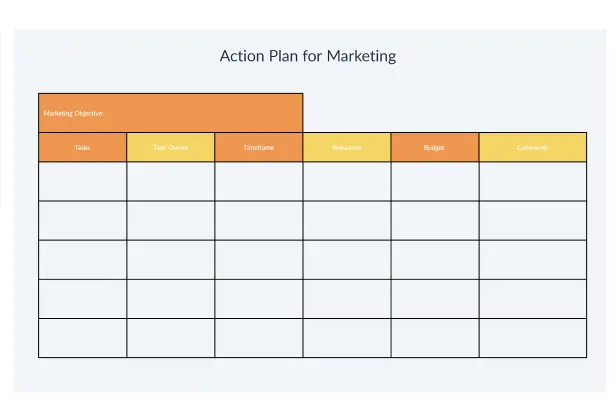
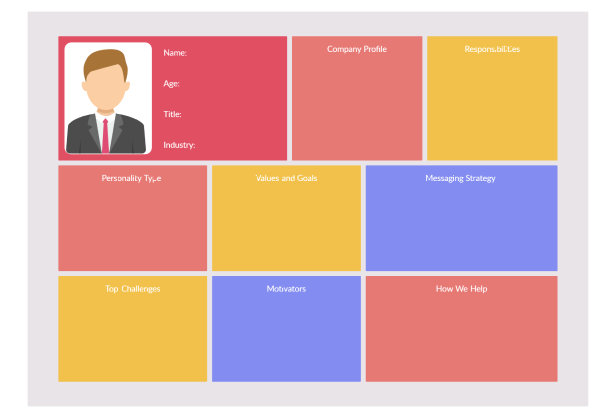
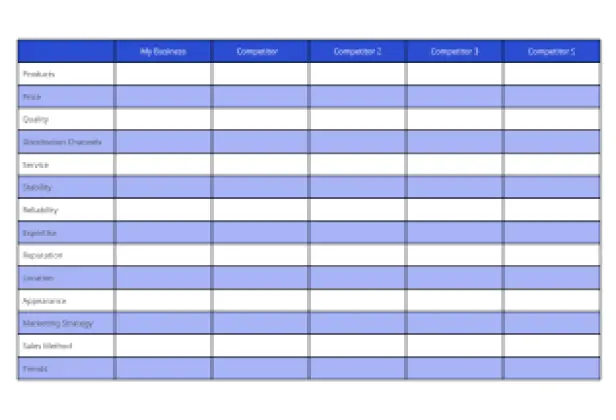
Effortlessly Visualize Business Strategies with Customizable Business Diagram Templates
FAQs about Business Diagrams
What are the main types of business diagrams?
Audit diagrams are mainly used for financial management and to track fiscal information.
Flowcharts are used to illustrate a basic data or work flow.
Brainstorming diagrams are used to generate ideas and for collaborative decision making where team members can share their suggestions.
Fishbone (cause and effect) diagrams help to discover the root causes of an issue.
Data flow diagrams are used to indicate the flow of information.
E- PC is another type of diagram to denote business process workflows. They are used in SAP R/3 modeling concepts.
Fault tree diagrams help investigate system failures and errors. It reverse engineers a system by graphically representing its components and helping to understand the root cause for failure.
Process diagrams are helpful in presenting various business processes and their components.
Marketing charts help illustrate marketing data and statistics in a way that is easy to understand. They are mostly used in marketing presentations to convince clients and stakeholders.
Org charts denote the reporting structure of an organization.
Value stream maps help enhance productivity by distinguishing between value-adding and non-value adding activities in a business process.
How to diagram a business process?
Determine key process components: The first step in diagramming a business process is to determine the main inputs, outputs and activities of the process. Inputs can be resources or information that help conduct the process and outputs are the results of the process such as decisions, components, services, permits, end products etc.
Clarify the order of activities: Once the main components are identified, list them in the chronological order.
Choose correct symbols: Make sure you choose the correct symbols to represent each activity of the process so that your process diagram is easily comprehensible.
Use connectors: Connect all activities and components in your diagram using arrows and lines (dotted or otherwise).
Clearly indicate the start and end of the process: Though it may seem obvious, many people overlook this when creating business process diagrams. Therefore make sure to clearly label the start and end of the process.
Who uses business diagrams?