Compare and Contrast Maker
Easily Compare Concepts and Ideas
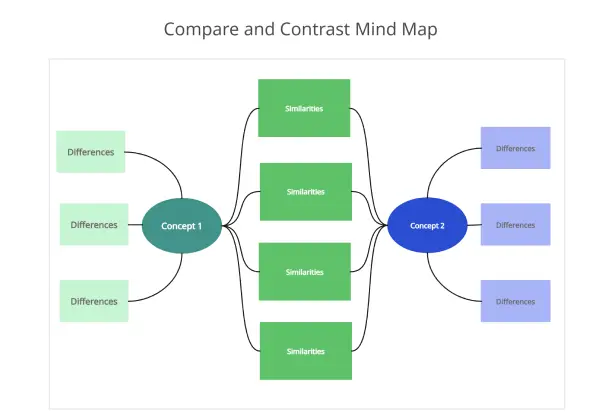
Visualize similarities and differences in one workspace with Creately’s Compare and Contrast Chart Maker to map ideas, brainstorm, and present clearly.
Intuitive drag-and-drop interface to arrange ideas
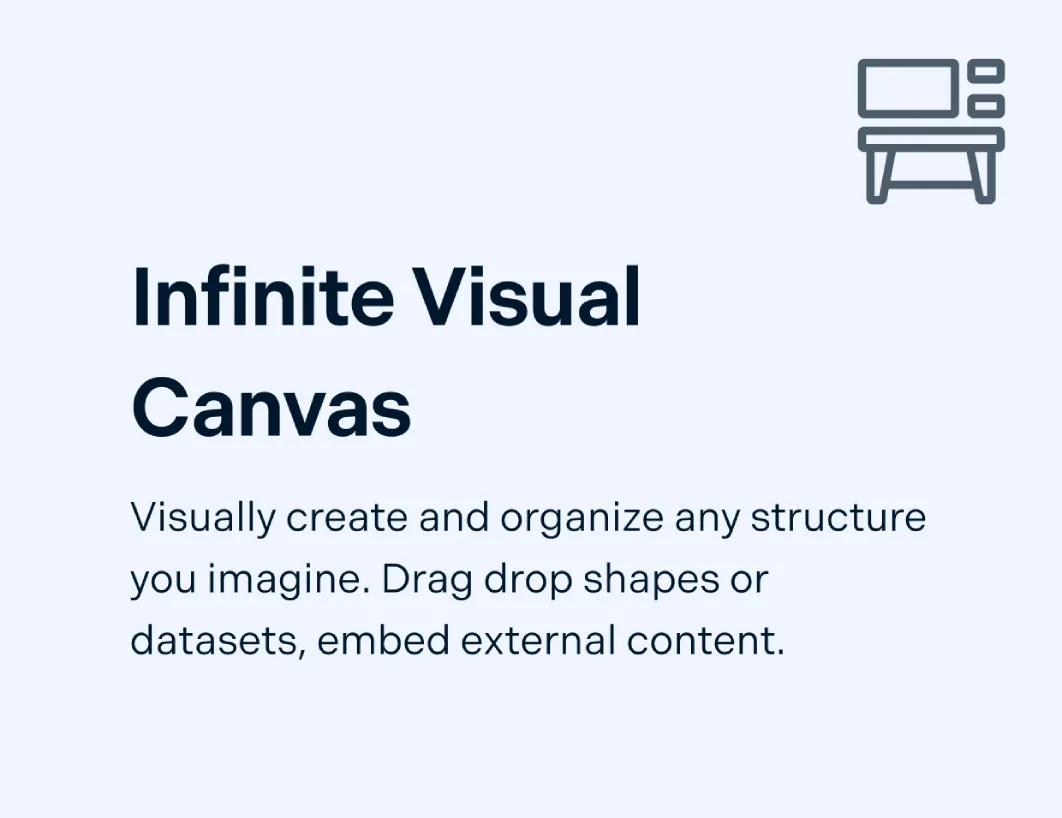
Infinite canvas for brainstorming without limits
Real-time multi cursors and asynchronous editing


 Diagramming Visual Collaboration Org Chart


How to Create a Compare and Contrast Chart?
Help Make Informed Decisions

Quickly jot down ideas with sticky notes and whiteboarding tools
Scale up to thousands of ideas in one view using the infinite canvas
Drag and drop concepts into Venn diagrams, T-charts, or custom layouts
Use color coding, tags, and frameworks to sort similarities and differences

Discuss the Thoughts Behind the Ideas
Brainstorm in real time with multi-user collaboration and live cursors
Comment directly on items to add context or feedback
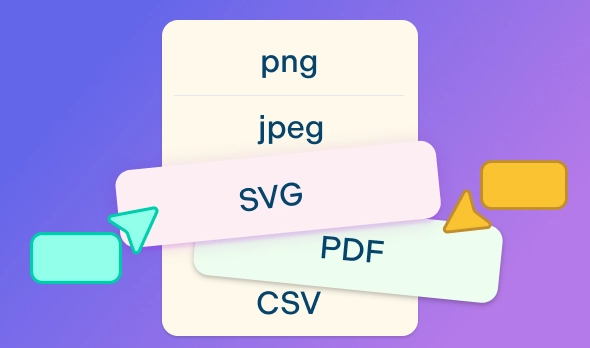
Share your comparison chart securely via links or export as PNG, SVG, PDF, or JPEG
Work seamlessly with integrations like Google Drive, Confluence, and Slack
Sort Ideas to Compare and Contrast

Structure ideas with frames to create step-by-step lesson plans or presentations
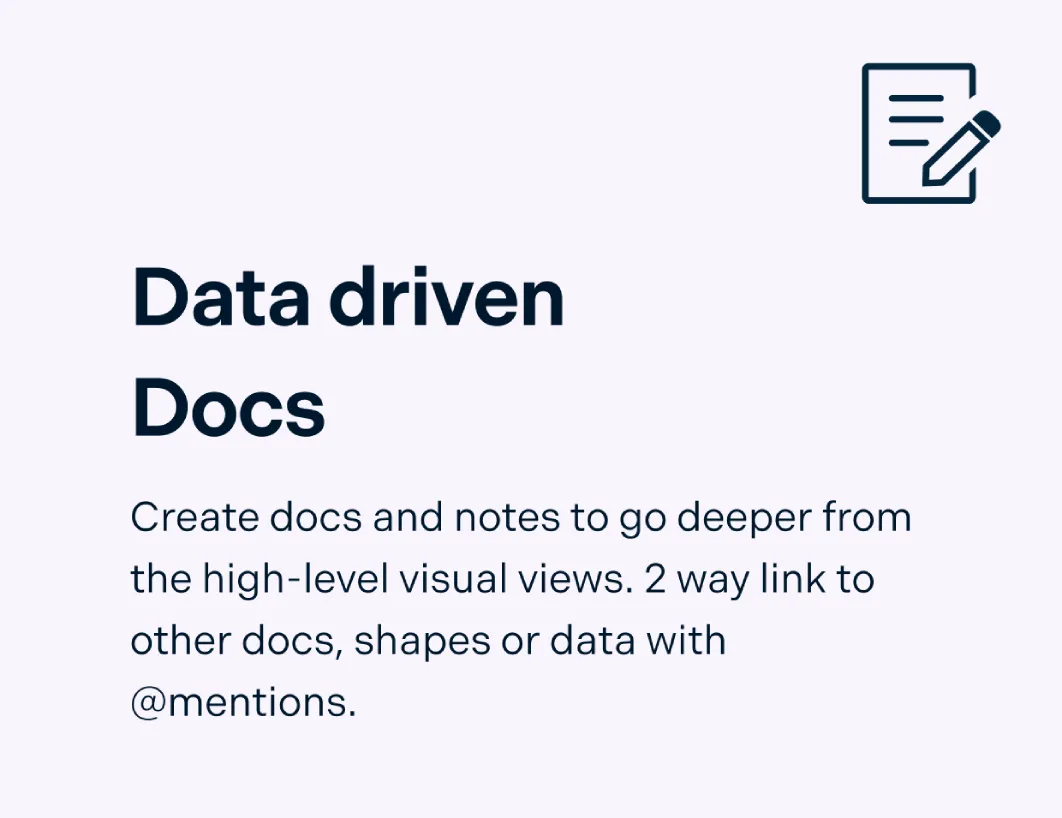
Use Creately’s documentation features to add notes, links, and references
Instantly search across workspaces to connect related charts and topics
Present findings directly with built-in presentation mode, no extra tools needed
Compare Ideas More Clearly From the Start
Whether students are brainstorming for a writing assignment, analyzing concepts in a lesson, or sorting options before making a decision, Creately helps them capture and compare ideas in a more structured visual format.
Start with sticky notes and whiteboarding tools to quickly capture ideas before organizing them into a comparison activity.
Use the infinite canvas to explore multiple concepts, examples, or viewpoints in one space without running out of room.
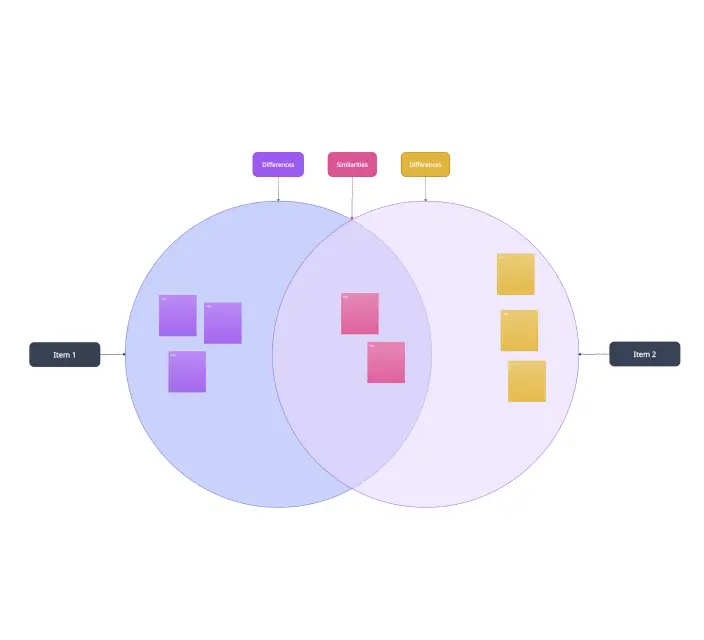
Drag and drop ideas into Venn diagrams, T-charts, or custom layouts to compare similarities and differences more clearly.
Apply color coding, tags, and visual frameworks to group related ideas and make patterns easier to spot.
Turn Comparison Activities Into Shared Discussions
From classroom discussions to group assignments, Creately helps students and teachers explore different viewpoints together and make the reasoning behind each comparison easier to follow.
Brainstorm together in real time with multi-user collaboration and live cursors so everyone can contribute during the activity.
Add comments directly to ideas, categories, or chart sections to capture feedback, questions, and supporting context.
Share comparison charts securely with students or colleagues through links or export options for review, presentation, or submission.
Keep collaboration connected to the rest of the workflow with integrations like Google Drive, Confluence, and Slack.
Turn Comparisons Into Clear Learning Resources
Once ideas are captured, Creately helps organize them into structured materials that can support teaching, revision, presentations, and deeper understanding.
Use frames to arrange comparisons into step-by-step lesson materials, guided activities, or presentation flows.
Add notes, links, and references alongside the chart so supporting information stays connected to the comparison.
Search across workspaces to find related charts, topics, and previous work when expanding or revisiting a lesson.
Present findings directly from Creately with built-in presentation mode so insights can be shared without switching tools.
What Is a Compare and Contrast Chart?

How to Make a Compare and Contrast Chart?
Launch Creately and define your topic
Open Creately and create a workspace for your team or students. Decide on the topic or concept to compare and contrast, and clarify the purpose and goals using Creately’s whiteboard and collaborative tools.
Select or create a chart template
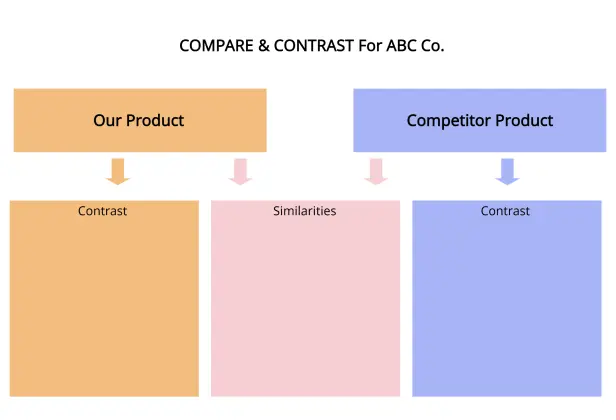
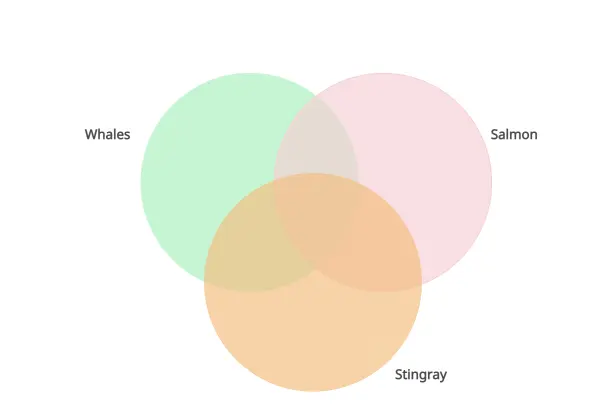
Choose a Compare and Contrast chart template from Creately’s library (like Venn diagrams or column-style organizers), or build one from scratch using drag-and-drop shapes from the shape library. Set up sections for similarities and differences before adding data.
Gather and organize relevant information in Creately
Invite team members to the workspace with edit access. Collect all relevant information, notes, images, links, and attachments directly on the canvas using sticky notes, the notes panel, and shapes. Structure data clearly within the template.
Identify similarities and differences
Collaborate in real time to populate the chart. Use Venn diagrams or column-style charts to write shared traits in common sections and differences in individual sections. Organize information visually so patterns and contrasts are easy to see.
Review, finalize, and share
Conduct a final review entirely in Creately. Use comments, @mentions, and multi-cursor editing for feedback, then share the finalized chart via a secure link or export it as PNG, PDF, or SVG for presentations or reporting.
Create a Comparison ChartCreate Compare and Contrast Charts with Editable Templates
FAQs About the Compare and Contrast Chart Maker
What are Creately’s compare and contrast maker pricing plans?
- Free Plan — $0/month for basic compare and contrast creation and collaboration
- Starter & Team Plans — $8/month or $5/month billed annually
- Business Plan — $149/month or $89/month billed annually
Annual billing helps you save more while unlocking advanced collaboration, workspace management, and enhanced compare and contrast features. You can compare all available plans and features on the Creately Pricing Page.
How can you create compare and contrast charts faster?
Are there templates for different compare and contrast chart use cases?
Can teams collaborate on compare and contrast charts?
Can I add notes, data, and files?
Can I share, present, or export compare and contrast charts?