Fishbone Diagram Maker
Visualize Root Causes with Cause and Effect Diagrams
Uncover root causes faster — collaborate in real time, analyze issues, and find solutions together.
Start instantly with ready-made fishbone diagram templates
Work together with your team, brainstorm causes, and refine solutions
Export, present, or share your diagrams instantly with stakeholders


 Diagramming Visual Collaboration Org Chart


How to Create a Fishbone Diagram Online?
Brainstorm and Organize Causes Visually

Quickly get started with fishbone diagram templates and organize your causes visually.
Break down complex problems into actionable insights with cause categorization.
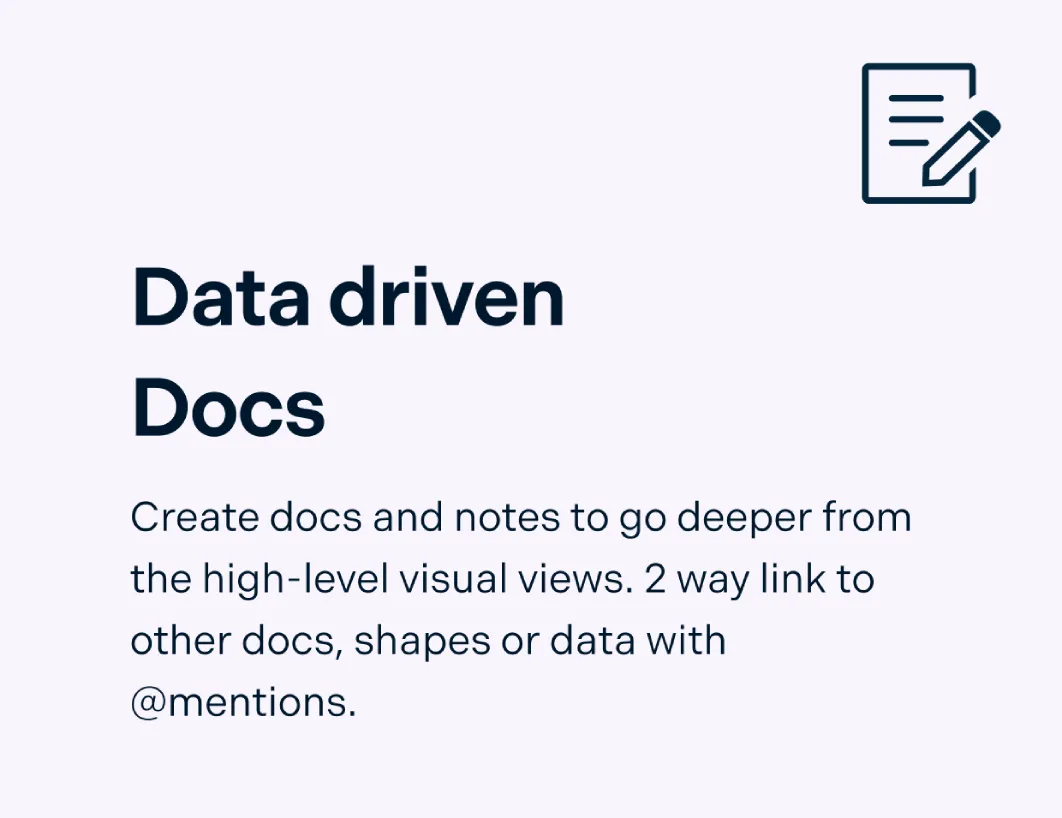
Enhance each branch with notes, sticky notes, and attachments to capture all details.
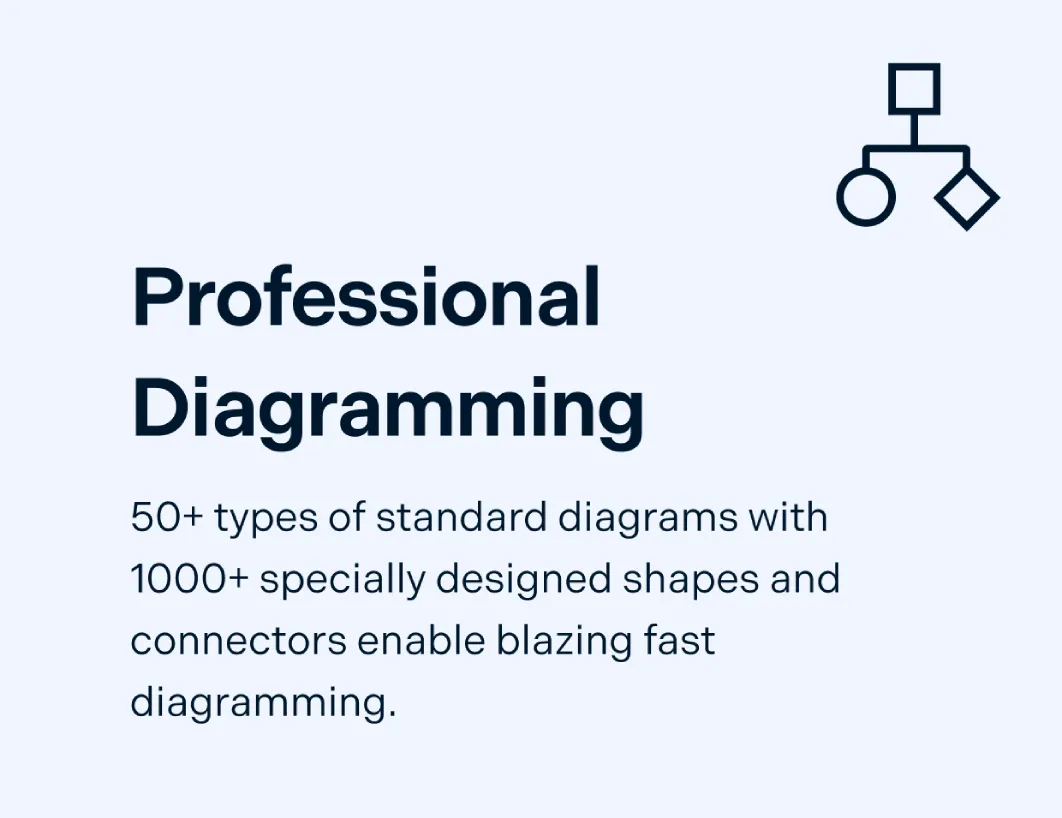
Customize branch layouts and styles to make your diagram clearer and easier to read.

Collaborate in Real Time with Your Team
Share your diagram and co-edit instantly with live collaboration to keep everyone on the same page.
Gather feedback efficiently using comments and reactions directly on branches.
Keep your work organized with version history that tracks all changes.
Brainstorm remotely as effectively as in person using real-time team collaboration.
Customize and Extend Your Analysis

Adjust layouts, colors, and styles with flexible customization to make diagrams clear and readable.
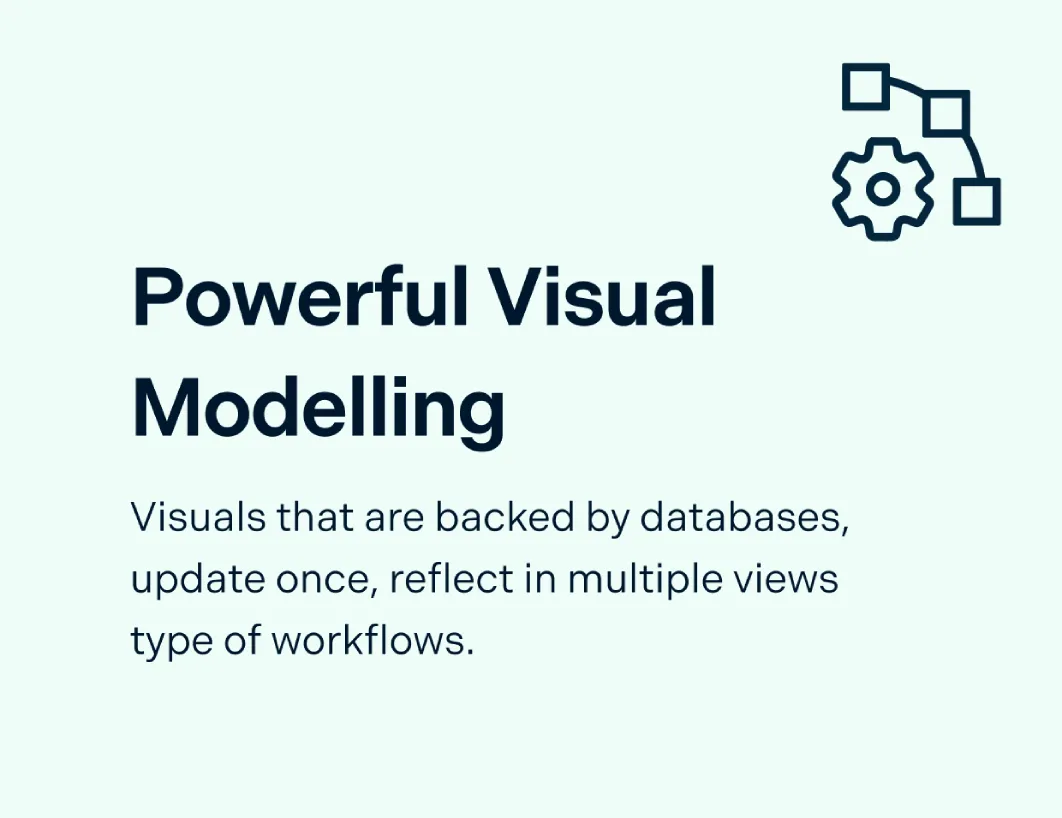
Connect supporting files and references with data integration for deeper analysis.
Link your fishbone diagram with flowcharts, mind maps, and other tools in Creately to create a comprehensive problem-solving workflow.
Turn insights into action by linking your fishbone diagram to Creately’s Kanban boards for task management and follow-up.

Present and Share Findings with Ease
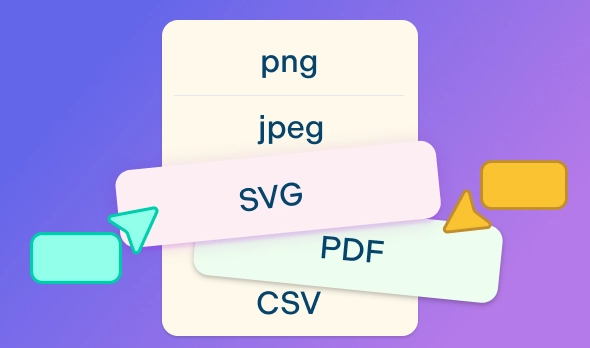
Export your diagrams as PNG, SVG, PDF, or share links instantly using easy export options.
Present step-by-step findings with built-in presentation mode for professional clarity.
Integrate diagrams with Confluence, Google Workspace, Slack, and more using tool integrations.
Embed diagrams in websites, wikis, or apps for easy access and collaboration.
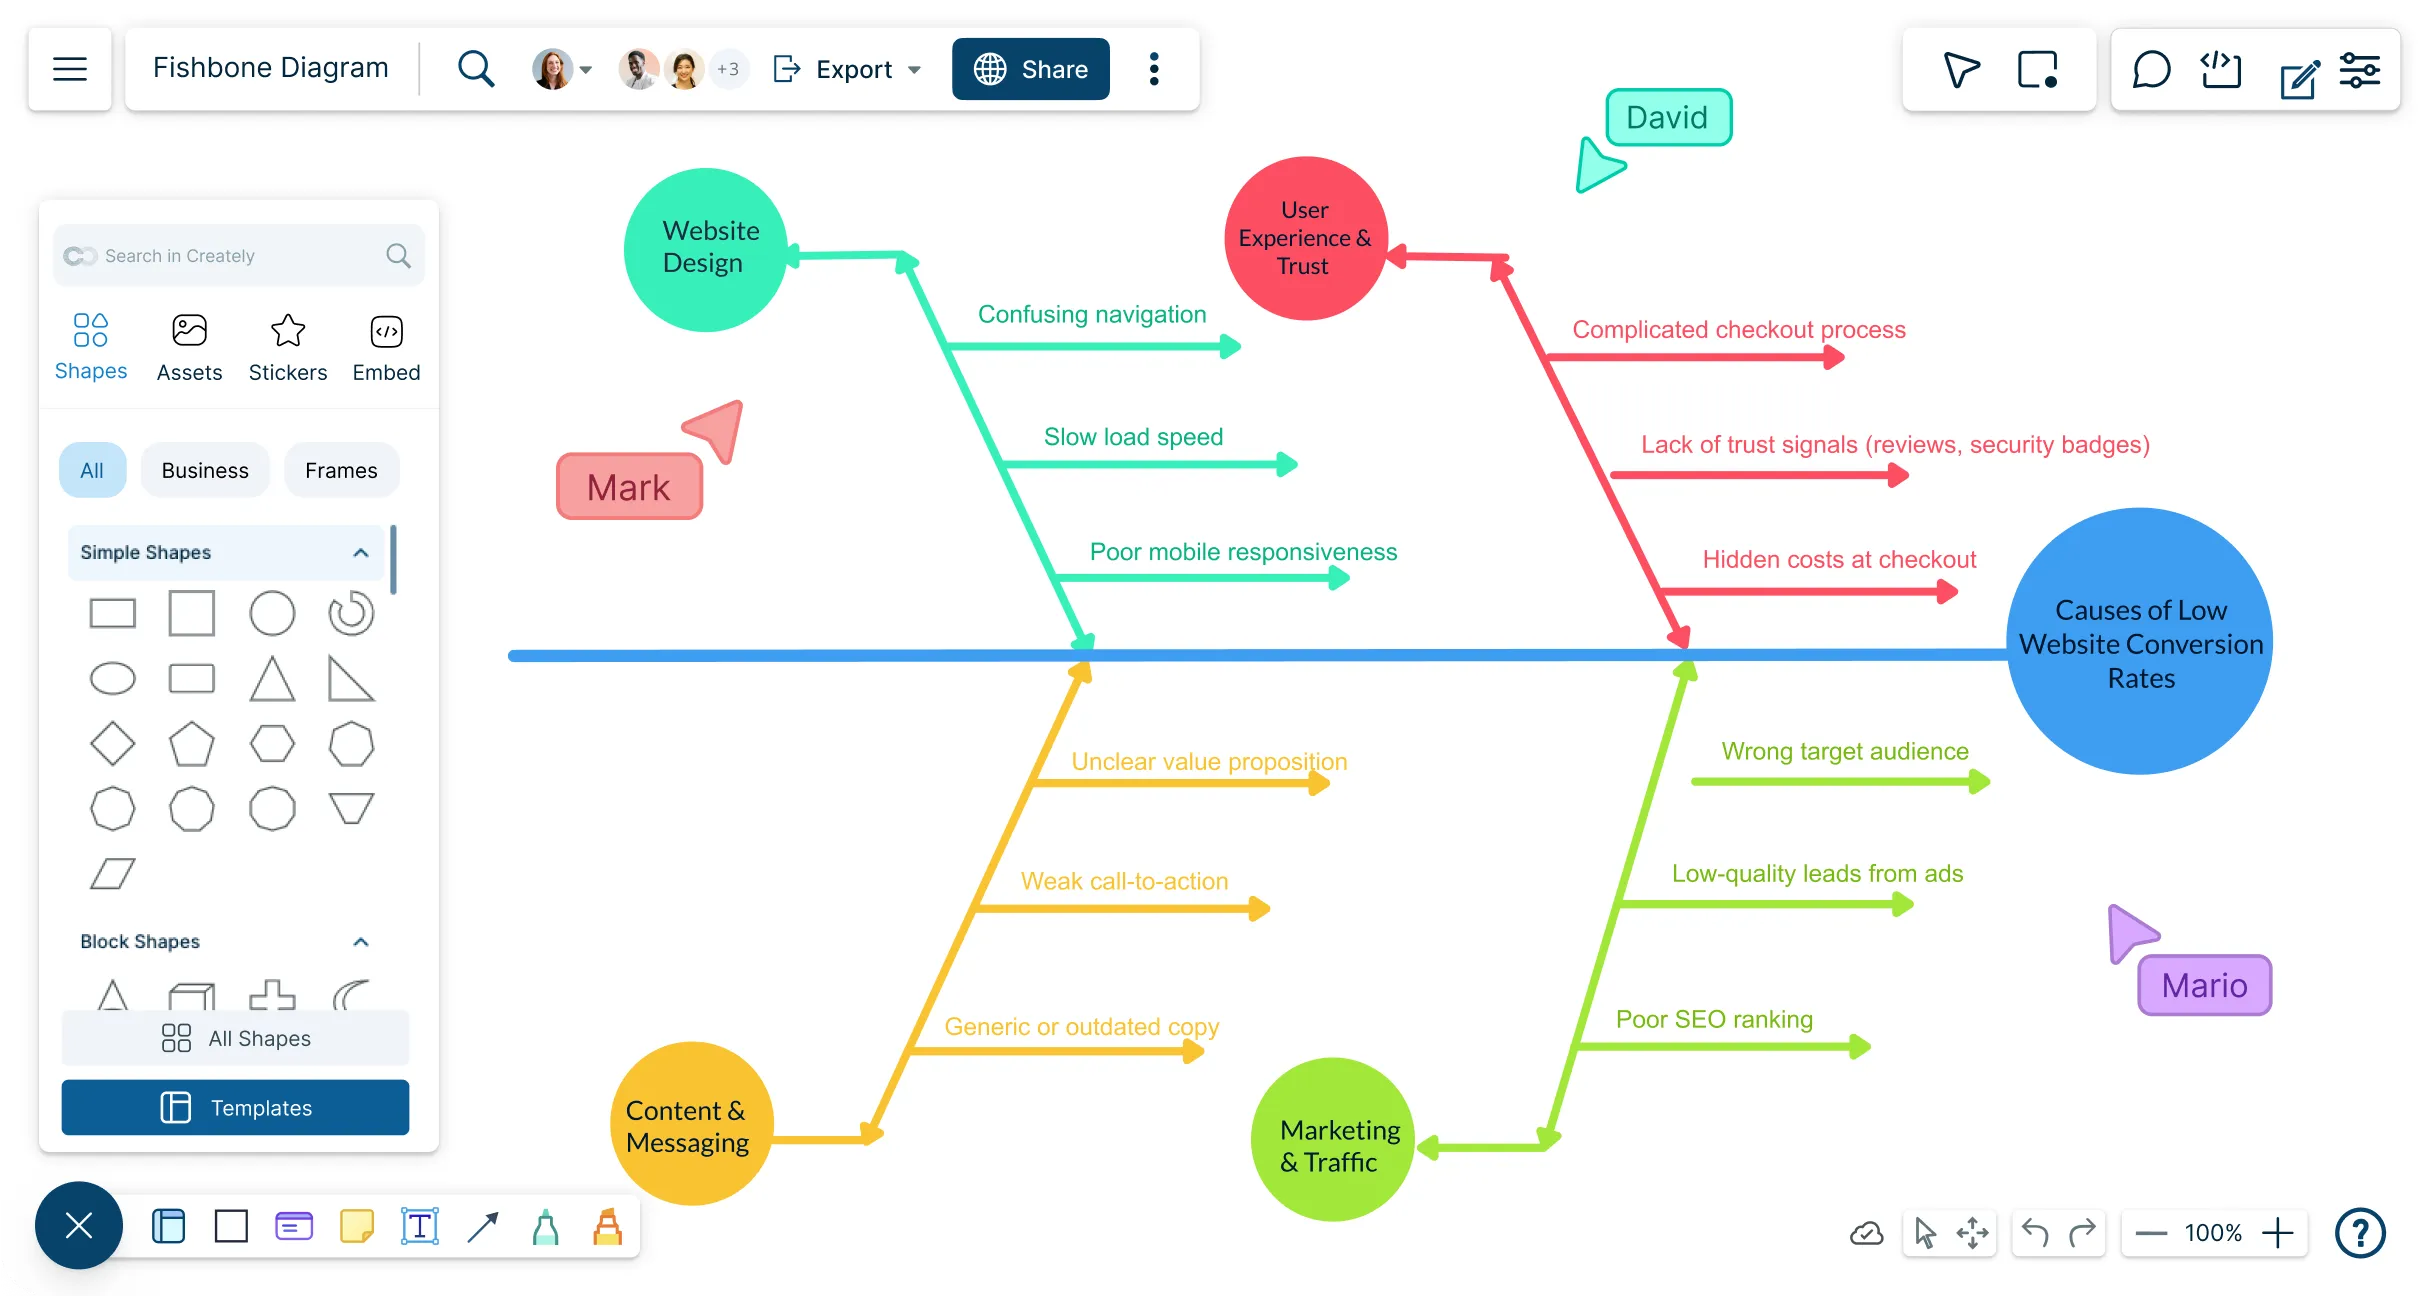
What Is a Fishbone Diagram?

How to Make a Fishbone Diagram in Creately?
Launch Creately and set up your workspace
Open Creately’s fishbone diagram tool, create a new workspace, and select a fishbone diagram template from the library (or start from a blank canvas). Add your problem statement as the “head” of the diagram. Invite your team as collaborators with edit or comment access.
Define and categorize potential causes
Use the spine of the diagram to organize categories such as people, processes, equipment, materials, or environment. Add shapes and labels directly from Creately’s fishbone shape library to structure your categories.
Brainstorm collaboratively on the canvas
With your team working in real time, add possible causes under each category using sticky notes, text boxes, or branches. Make use of live cursors, comments, and reactions so everyone’s input is captured visually.
Review and prioritize causes
Facilitate discussion within the workspace to review all potential causes. Use dot voting, color coding, and grouping tools to highlight and prioritize the most likely root causes right on the diagram.
Turn insights into an action plan
Attach tasks to specific causes using shape data fields. Assign owners, add deadlines, and track progress inside the workspace. Share the final diagram and action plan with stakeholders using presentation mode or by exporting to PDF/PNG.
Create a Fishbone DiagramCreate Your Fishbone Diagrams Using Editable Templates


FAQs About the Fishbone Diagram Creator in Creately
What is the “5 Whys” fishbone technique?
How can I share my fishbone diagram with others?
How do I start drawing a fishbone diagram in Creately?
What is a fishbone diagram used for?
Does Creately offer fishbone diagram templates?
What is the best software to make a fishbone diagram?
What are the elements of a fishbone diagram?