Venn Diagram Maker
Create Venn Diagrams Easily With the Best Venn Diagram Tool
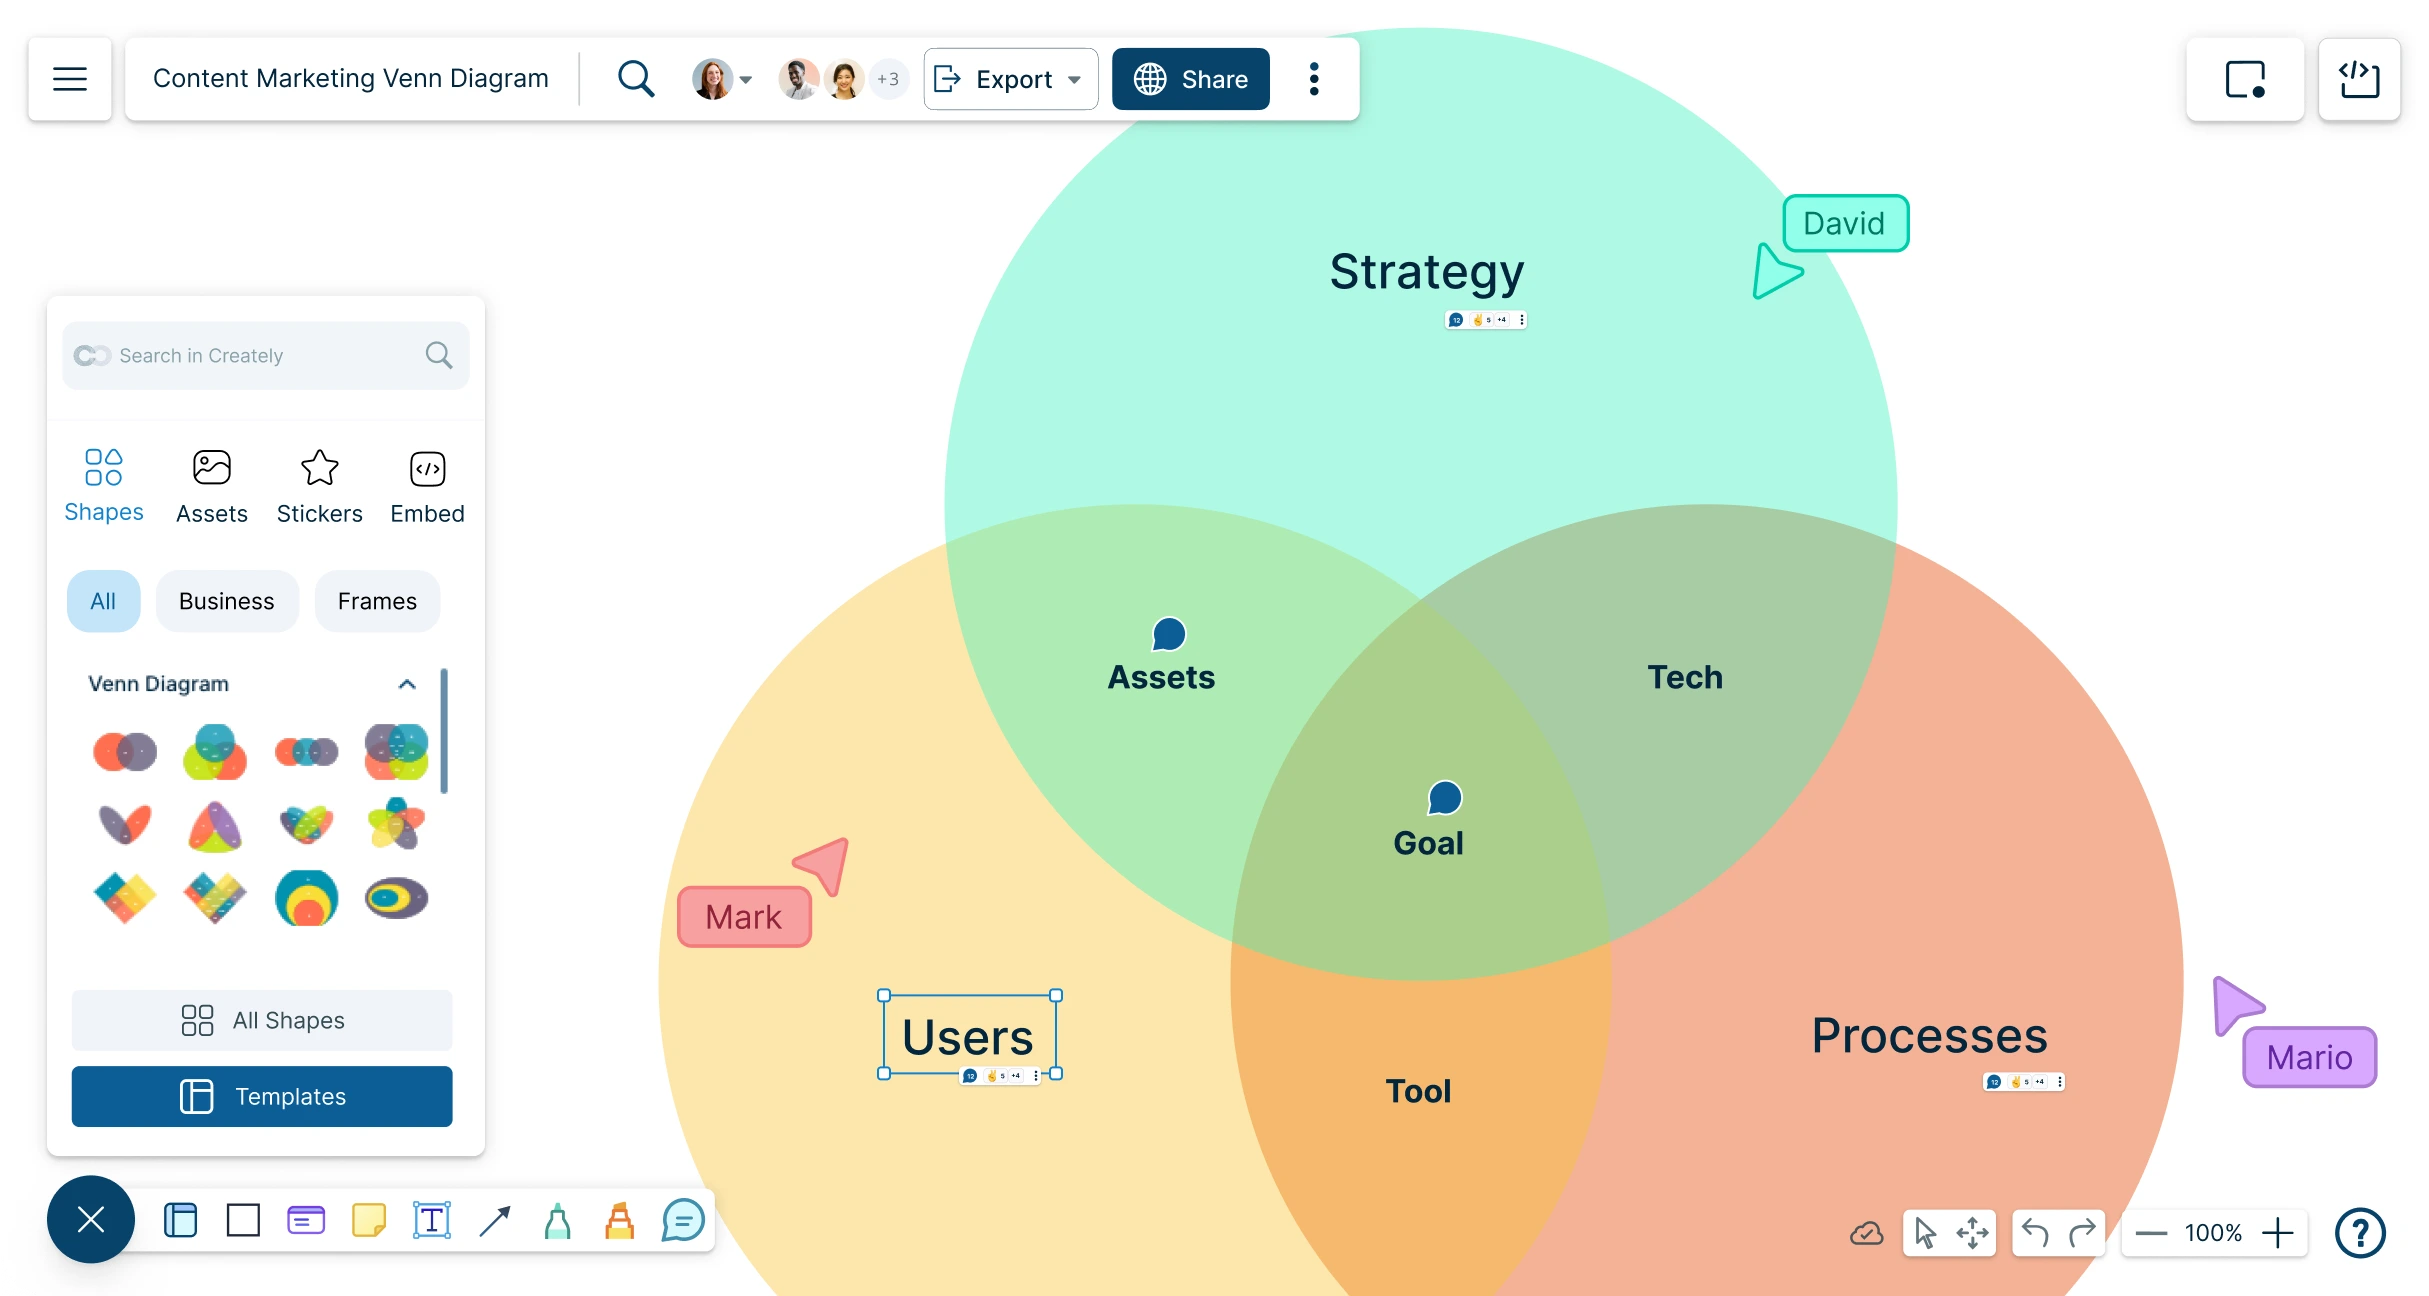
Better understand and represent data with our free Venn diagram tool. Visually represent information with our shape library and simple drag-and-drop tools.
- Multiple free Venn diagram templates
- Fully customizable styling options to easily input information
- Share with others, embed in any site, or export in multiple formats


 Diagramming Visual Collaboration Org Chart


How to Create a Venn Diagram Online?
Launch Creately
Sign in to Creately’s Venn diagram builder and open a new workspace. Invite team members to collaborate in real-time so everyone can contribute from the start.
Choose a Template and Organize Your Data
Select from a variety of free, editable Venn diagram templates. Arrange your information within the diagram to highlight key intersections and differences.
Build Your Diagram with Ease
Use the Venn diagram creator’s drag-and-drop tools to add and adjust circles, labels, and shapes. Visualize multiple sets clearly and structure your diagram to communicate insights effectively.
Customize and Enhance
Apply color themes, fonts, and icons to make your Venn diagram visually appealing. Add sticky notes, images, or additional data points to enrich your presentation.
Review, Share, and Export
Review, Share, and Export Collaborate with team members using comments and live editing. Once finalized, share your Venn diagram online, embed it on websites, or export in high-quality formats such as PNG, SVG, PDF, or JPEG.
Create Venn Diagrams Online with Editable Free Templates
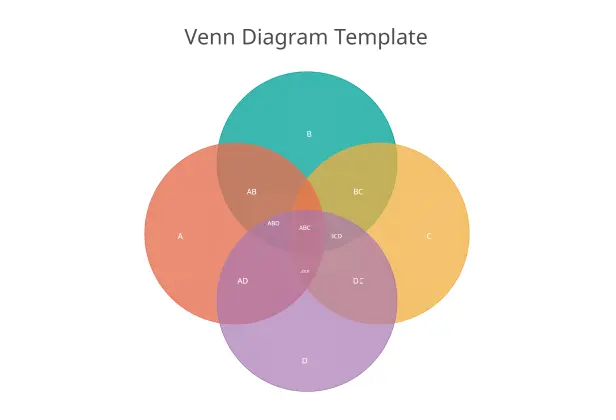
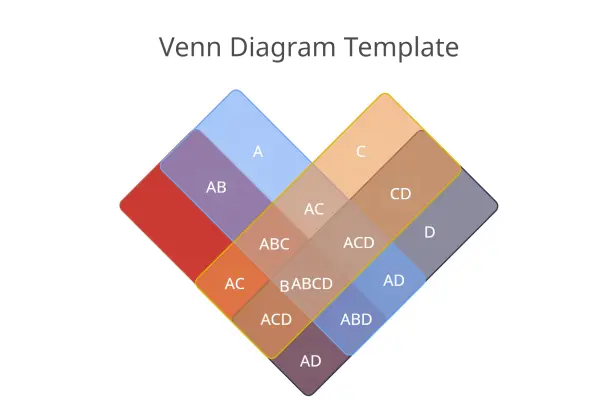
How to Make a Venn Diagram?
Easily Create Venn Diagrams

Create professional Venn diagrams with our extensive shape library.
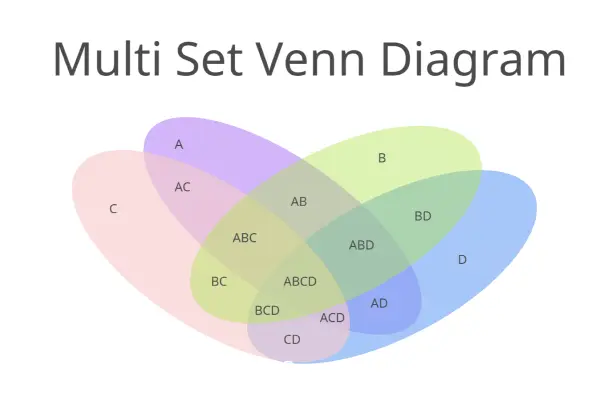
Choose from over 1000+ industry-standard shapes to visualize multiple data sets clearly with our easy-to-use Venn diagram maker.
Visualize multiple data sets and represent Venn diagrams in multiple ways.

Understand, Discuss, and Modify Together
Work closely with teams in real-time with live mouse tracking and whiteboarding.
Multiple access and role levels to streamline sharing, reviewing, and editing a Venn diagram online.
Make suggestions and make Venn diagrams together with in-line comments.
Share Across Multiple Platforms

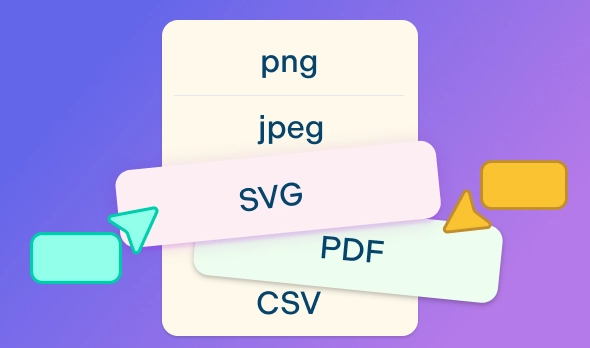
Publish, present, print, and share with multiple export options (SVGs, PNGs, JPEGs, and PDFs ).
Create presentation flows for multiple stakeholders with frames and other navigation features.
Multiple add-ons to easily embed the Venn diagram in Google/Microsoft documents, slides, and sheets.
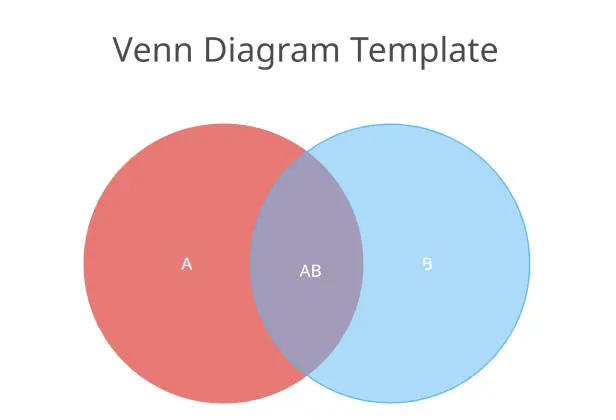
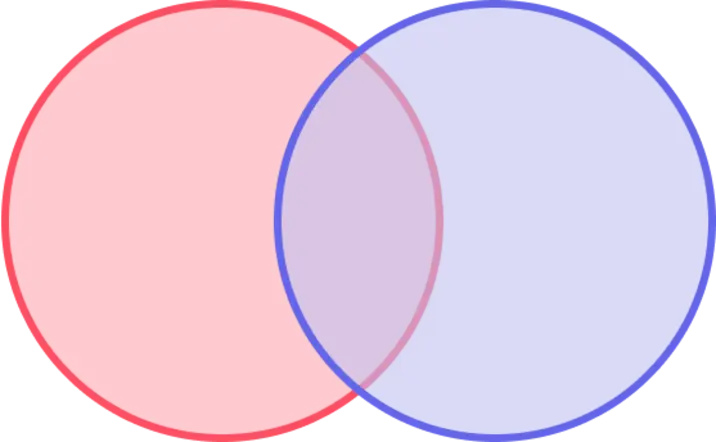
What Is a Venn Diagram?

Components of a Venn Diagram

The common overlapping section of 2 or more categories
The collection of all the circles combined

The parts of the diagram that do not overlap- they are the parts that are more different than alike
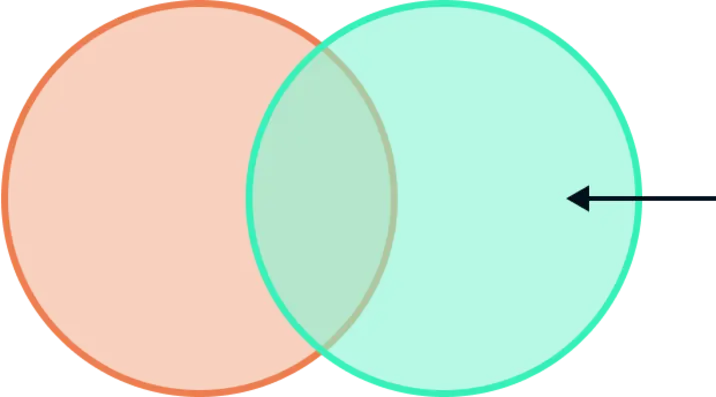
The overlapping section of a circle that does not intersect with another circle
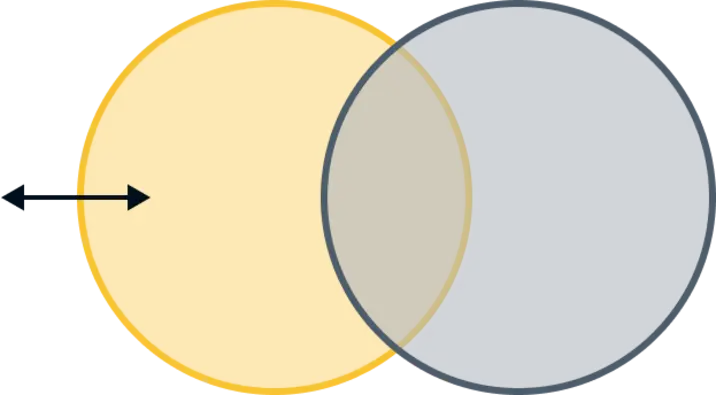
This is the area outside the set and can include the area outside the circle
This is the area around the circle in which a larger category of information exists.
How to Create a Venn Diagram Online?
Launch Creately
Sign in to Creately’s Venn diagram builder and open a new workspace. Invite team members to collaborate in real-time so everyone can contribute from the start.
Choose a Template and Organize Your Data
Select from a variety of free, editable Venn diagram templates. Arrange your information within the diagram to highlight key intersections and differences.
Build Your Diagram with Ease
Use the Venn diagram creator’s drag-and-drop tools to add and adjust circles, labels, and shapes. Visualize multiple sets clearly and structure your diagram to communicate insights effectively.
Customize and Enhance
Apply color themes, fonts, and icons to make your Venn diagram visually appealing. Add sticky notes, images, or additional data points to enrich your presentation.
Review, Share, and Export
Review, Share, and Export Collaborate with team members using comments and live editing. Once finalized, share your Venn diagram online, embed it on websites, or export in high-quality formats such as PNG, SVG, PDF, or JPEG.
How Can Teams Use Venn Diagrams?
Venn diagrams are a great way to share ideas and explore different perspectives in teams.
For Brainstorming
Teams can use the Creately canvas to have brainstorming sessions where they can share thoughts and ideas and place them in appropriate sections of the Venn diagram.
To Make Better Decisions
Teams can use these representations to clarify concepts, improve alignment and make better decisions together.
To Share with Others
These diagrams can be inserted into presentations and shared across the organization for easy reference.
FAQs for Creately’s Venn Diagram Maker
Does Creately support large scale Venn diagrams?
Can I collaborate on Creately’s Venn diagram software?
Does the Venn Diagram Generator come with ready-to-use templates?
How can I change the colors on my Venn diagram circles?
Are my Venn diagrams on Creately secure?
Is Creately’s Venn Diagram Maker free?