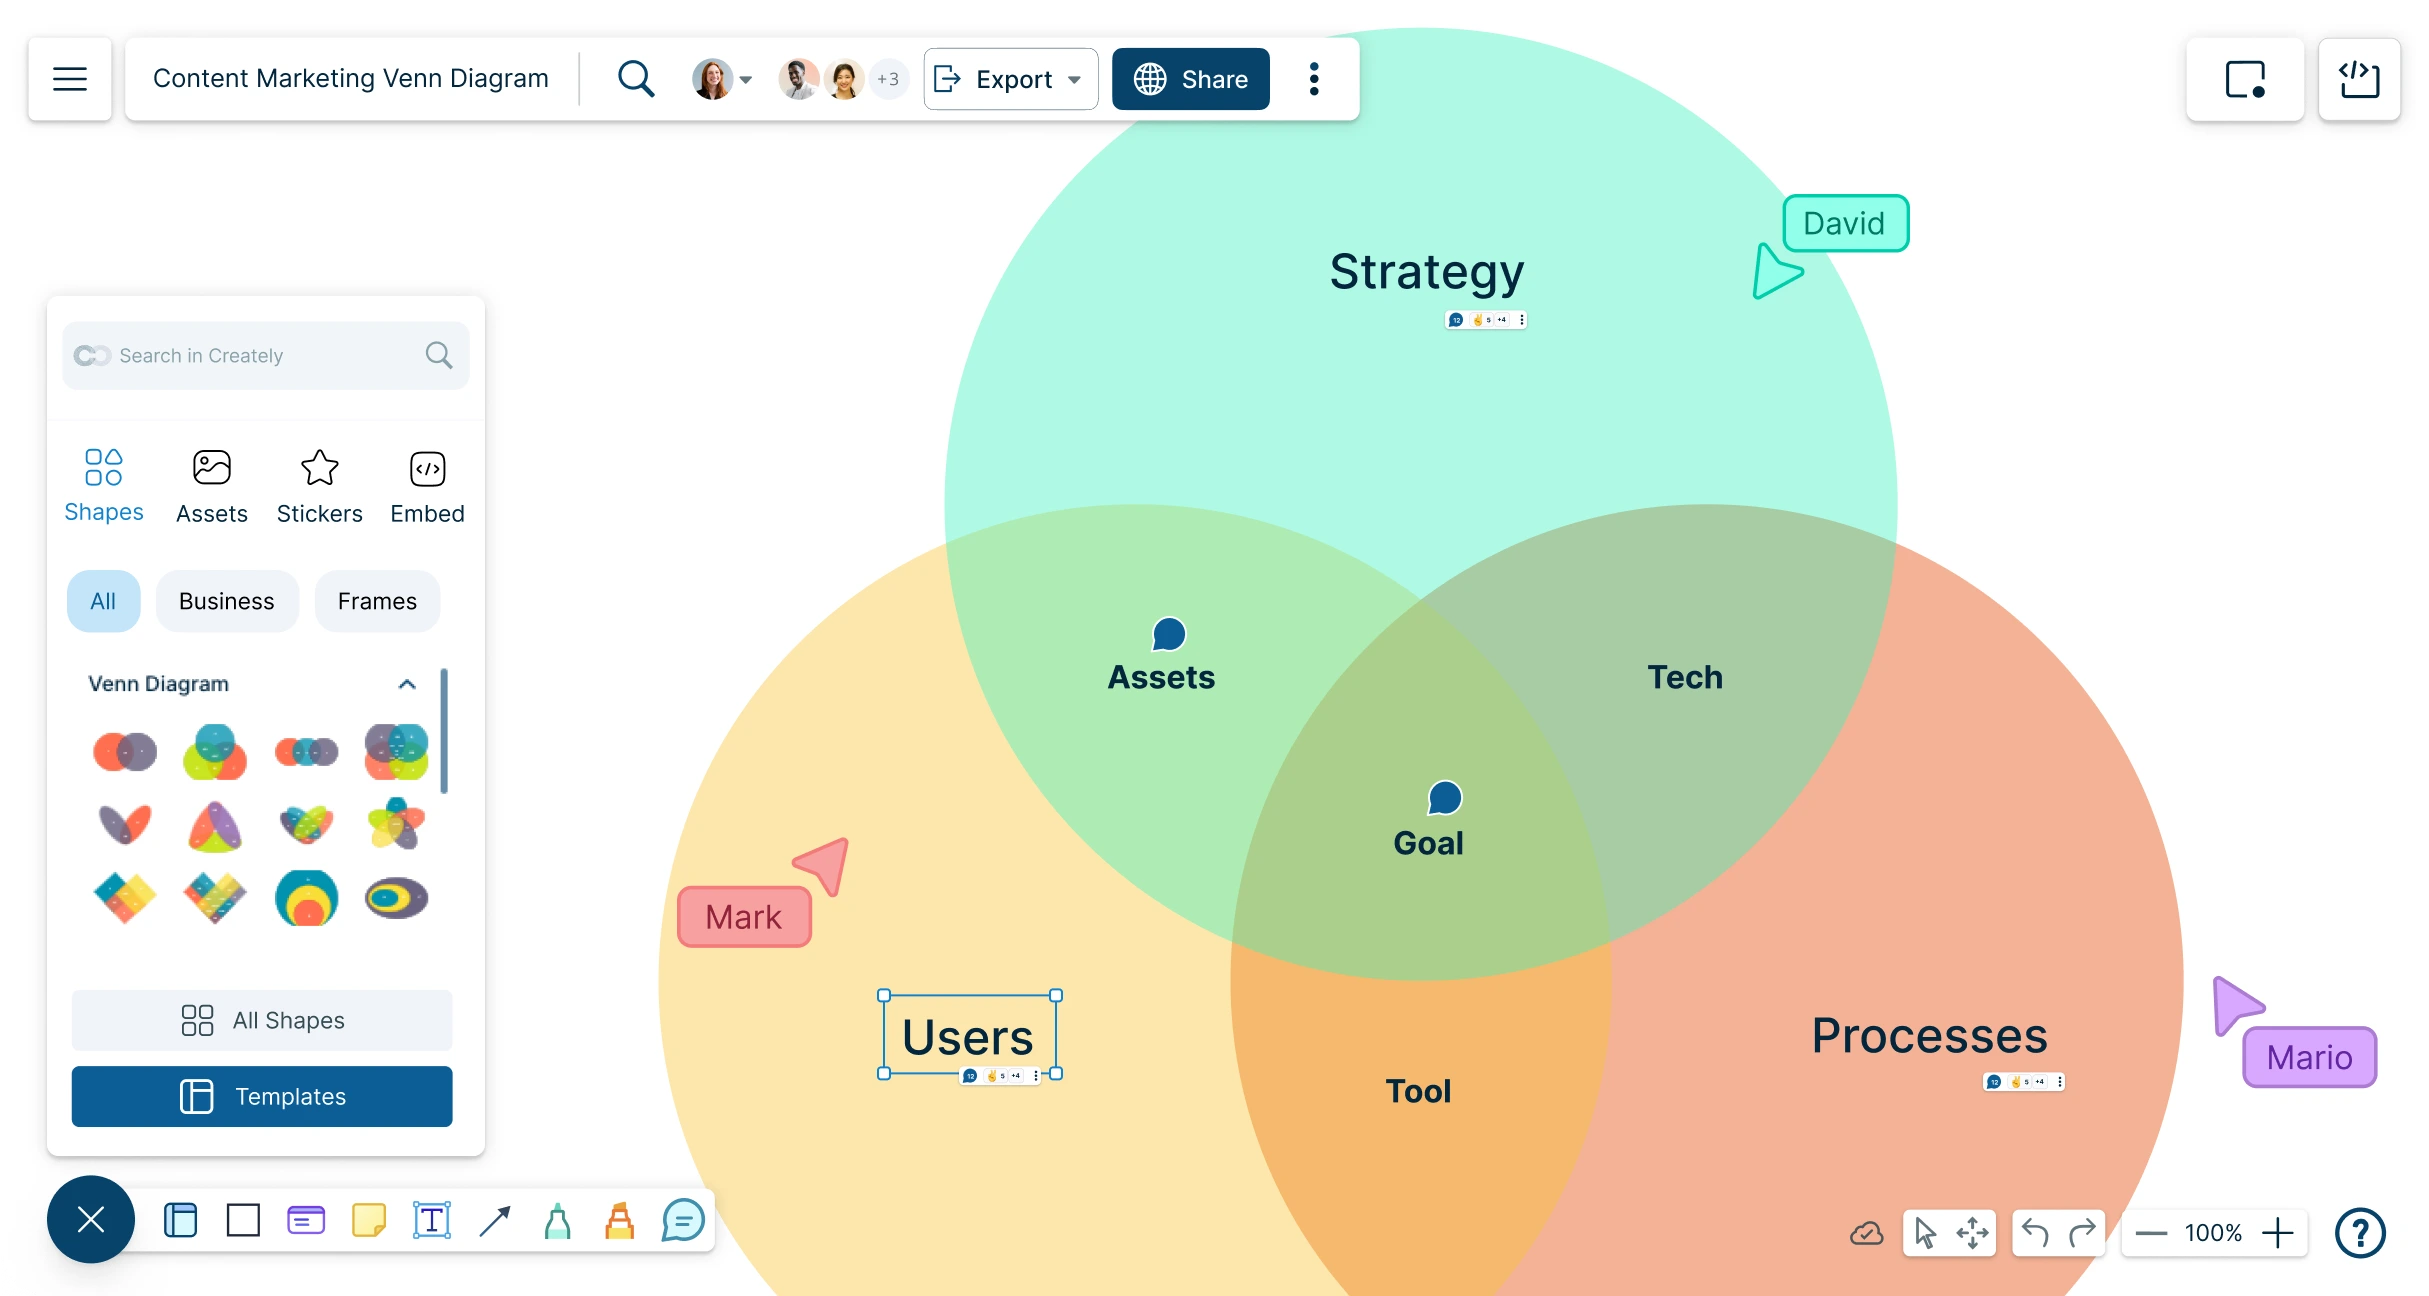
Venn Diagram Maker
Create Easy Venn Diagrams to Compare Ideas, Options, and Relationships
Compare ideas, options, concepts, or groups with editable Venn diagrams that help people see what is different, what overlaps, and what matters most.
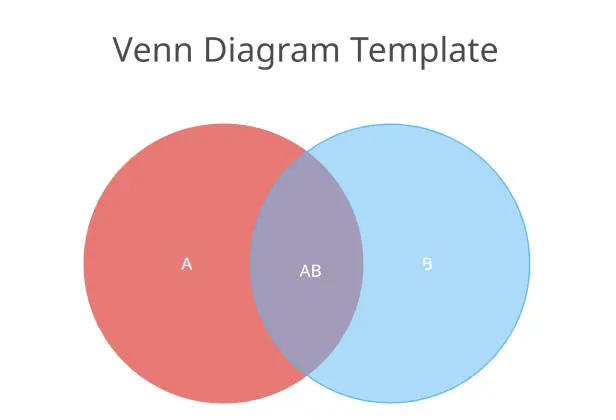
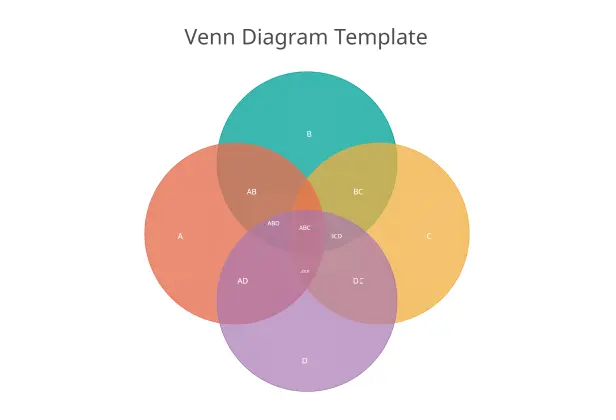
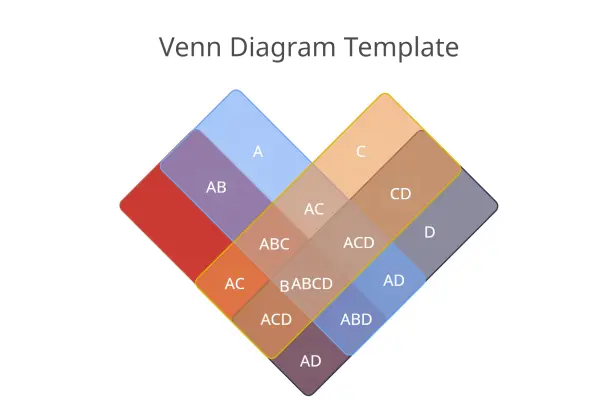
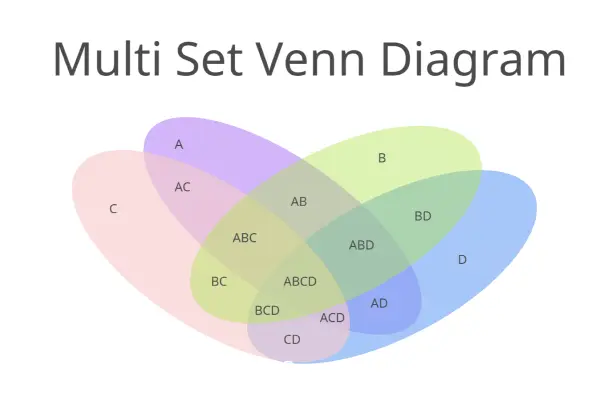
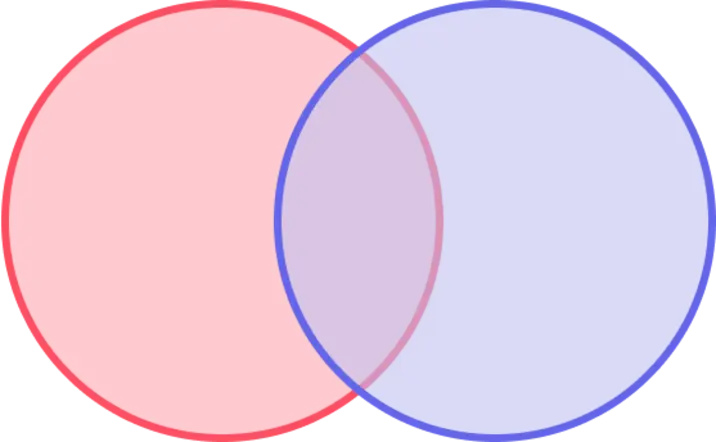
- Editable templates for 2-circle, 3-circle, multi-set, and custom Venn diagrams
- Drag-and-drop editing for circles, labels, colors, icons, and overlaps
- Collaborate, review, present, and export from one workspace


 Diagramming Visual Collaboration Org Chart


How to Create a Venn Diagram in Creately?
Start With the Right Venn Diagram Structure
Choose a blank canvas or an editable Venn diagram template. Use two circles for simple comparisons, three circles for more overlap, or a multi-set layout for several categories.
Define What You Are Comparing
Label each circle with the concepts, groups, products, ideas, audiences, or data sets you want to compare. Keep labels short and clear.
Add Unique and Shared Points
Place differences in the outer sections and similarities in the overlaps. Use short phrases so the diagram stays easy to read.
Add Context Without Cluttering the Diagram
Use notes, links, images, documents, or comments for extra details that do not need to appear inside the circles.
Review, Share, or Export the Final Diagram
Invite others to review the diagram, use comments to clarify overlaps, then share, present, embed, or export it as PNG, SVG, PDF, or JPEG.
Watch this quick walkthrough to see how to create a Venn diagram in Creately, organize similarities and differences, customize the layout, and share or export your final diagram.
Choose Editable Venn Diagram Templates
Help People See What’s Similar, Different, and Overlapping

When comparison points are scattered, the real overlap is easy to miss. Turn them into a clear Venn diagram that shows what is unique, shared, and worth discussing.
Start with a blank canvas or an editable 2-circle, 3-circle, multi-set, or custom Venn diagram template.
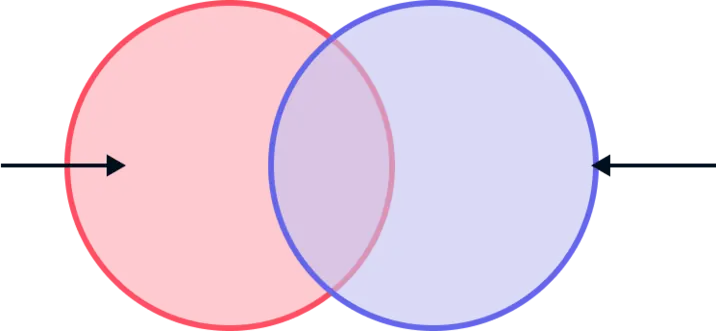
Label each circle with the ideas, topics, products, audiences, concepts, or groups you want to compare.
Place unique points in the outer sections and shared points in the overlapping areas so the comparison is easy to follow.
Use colors, labels, icons, and formatting to make key similarities and differences stand out.
Keep longer explanations, sources, or examples in notes so the diagram stays clean and readable.

Make Complex Comparisons Easier to Understand
A Venn diagram should make comparisons clear, not crowded. Organize points visually for lessons, reports, workshops, or team decisions.
Drag and drop points into the right sections as your comparison develops.
Resize, reposition, and style circles to show simple or more complex overlaps clearly.
Add notes, links, attachments, or comments to explain details that do not fit inside the diagram.
Place your Venn diagram next to research notes, tables, mind maps, or other visuals to connect the comparison to the bigger picture.
Use frames to organize different versions, examples, or stages of the comparison on the same canvas.
Build Shared Understanding

Comparisons often change when more people add context or challenge assumptions. Give everyone one shared workspace to add ideas, question overlaps, and refine the diagram together.
Invite students, teammates, clients, or stakeholders to view, comment on, or edit the Venn diagram.
Use real-time cursors to see where others are working during live brainstorming, lessons, or workshops.
Add comments and @mentions to ask questions, clarify differences, or confirm shared points.
Use sharing permissions to control who can view, comment, or edit the diagram.
Review the diagram together before using it in a lesson, report, presentation, or decision-making session.
Share Comparison Diagrams People Can Act On
A useful Venn diagram should make the final comparison easy to explain, not just nice to look at. Help turn it into a polished visual for lessons, reports, workshops, presentations, and stakeholder discussions.
Customize colors, fonts, borders, opacity, and layout to make each section easy to read.
Use short labels and icons to highlight important similarities, differences, or shared themes.
Present the diagram step by step using frames when you need to explain a larger comparison.
Share the diagram with a link or embed it in documentation for ongoing access.
Export your Venn diagram as PNG, JPEG, SVG, or PDF for worksheets, reports, slides, handouts, and presentations.
Components of a Venn Diagram

The overlapping section that shows what two or more sets have in common
The complete collection of all categories represented in the diagram
The sections that do not overlap and show what is different between sets
The part of one set that does not belong to another set being compared
The area outside a specific set within the wider comparison space
The full context or category that contains every set shown in the diagram
What Can You Create With Creately’s Venn Diagram Tool?
Classroom Comparison Diagrams
Help students compare characters, stories, historical events, scientific concepts, vocabulary, or themes. Teachers can start from a template, guide students through the comparison, and export the final diagram as a worksheet or class handout.
Product and Feature Comparisons
Compare products, tools, features, plans, or customer segments. Use the overlap areas to show shared capabilities and the outer sections to show what makes each option different.
Strategy and Decision Diagrams
Use Venn diagrams to compare business priorities, market opportunities, risks, stakeholder needs, or solution options. This helps teams see where ideas overlap and where trade-offs need to be discussed.
Research and Data Summary Diagrams
Organize research findings, interview themes, survey responses, or literature review insights. Add supporting files or links so the source material stays connected to the visual comparison.
Brainstorming and Workshop Diagrams
Use Venn diagrams during group activities to sort ideas, identify common ground, and make discussions more focused. Participants can add points, comment on overlaps, and refine the diagram together.
Marketing and Audience Analysis Diagrams
Compare customer groups, campaign ideas, messaging angles, or audience needs. Use overlaps to identify shared interests, positioning opportunities, or content themes.
FAQs for Creately’s Venn Diagram Creator
What are Creately’s venn diagram maker pricing plans?
- Free Plan — $0/month for basic venn diagram creation and collaboration
- Starter & Team Plans — $8/month or $5/month billed annually
- Business Plan — $149/month or $89/month billed annually
Annual billing helps you save more while unlocking advanced collaboration, workspace management, and enhanced venn diagram features. You can compare all available plans and features on the Creately Pricing Page.
How can you create venn diagrams faster?
Are there templates for different venn diagram use cases?
Can teams collaborate on venn diagrams?
Can I add notes, data, and files?
Can I share, present, or export venn diagrams?
What is a Venn diagram?