The shift toward data-driven decision-making is reshaping how companies visualize and manage their structures. By integrating real-time insights into organizational charts, businesses can unlock new efficiencies, enhance collaboration, and future-proof their strategies. In this guide, we explore the power of data-linked org charts and how they’re becoming indispensable tools for HR planning, strategy alignment, and organizational growth.
What is a Data-Linked Org Chart?
Traditional organizational charts are giving way to dynamic, data-linked alternatives. A data-linked org chart is an innovative solution that integrates real-time data, offering a more comprehensive and interactive view of the company’s structure. Unlike static diagrams, these charts seamlessly update with any changes in personnel or hierarchy, ensuring accuracy and relevance.
Traditional org chart, often created haphazardly in programs like Excel, can become outdated quickly, especially for larger organizations. Organizational Chart Maker offers a more sophisticated approach by using data links to keep every organizational detail up-to-date.
Such charts hold increasing significance for HR professionals who need reliable tools for planning and strategizing. With data-linked org charts, HR teams benefit from centralized employee information, making it easier to identify potential leaders, plan onboarding processes, and visualize employee journey mapping effectively. By providing a holistic overview, these charts support HR in linking organizational processes directly with data-driven insights.
How to Create a Data-Linked Org Chart
A well-structured, data-linked organizational chart provides clarity and facilitates decision-making.
CSV Import for Org charts
Step 1. Prepare and Organize Employee Data
Begin by compiling all necessary HR data in a centralized spreadsheet (e.g., a CSV or Excel file). Key data points to include are:
Employee names
Job titles
Departments
Reporting managers
Additional details such as location, contact information, or specific skills (optional for added depth).
Ensure that the data is up-to-date and formatted correctly to avoid errors during the import process. This preparation lays the groundwork for a smooth chart-building experience. Access the notes panel by clicking on an orchard shape.
Step 2. Access and Set Up the Charting Tool
Log in to your Creately account or create one if you’re new to the platform. From the dashboard, navigate to the organizational chart section. Creately serves as the central hub where you’ll manage and customize your charts efficiently.
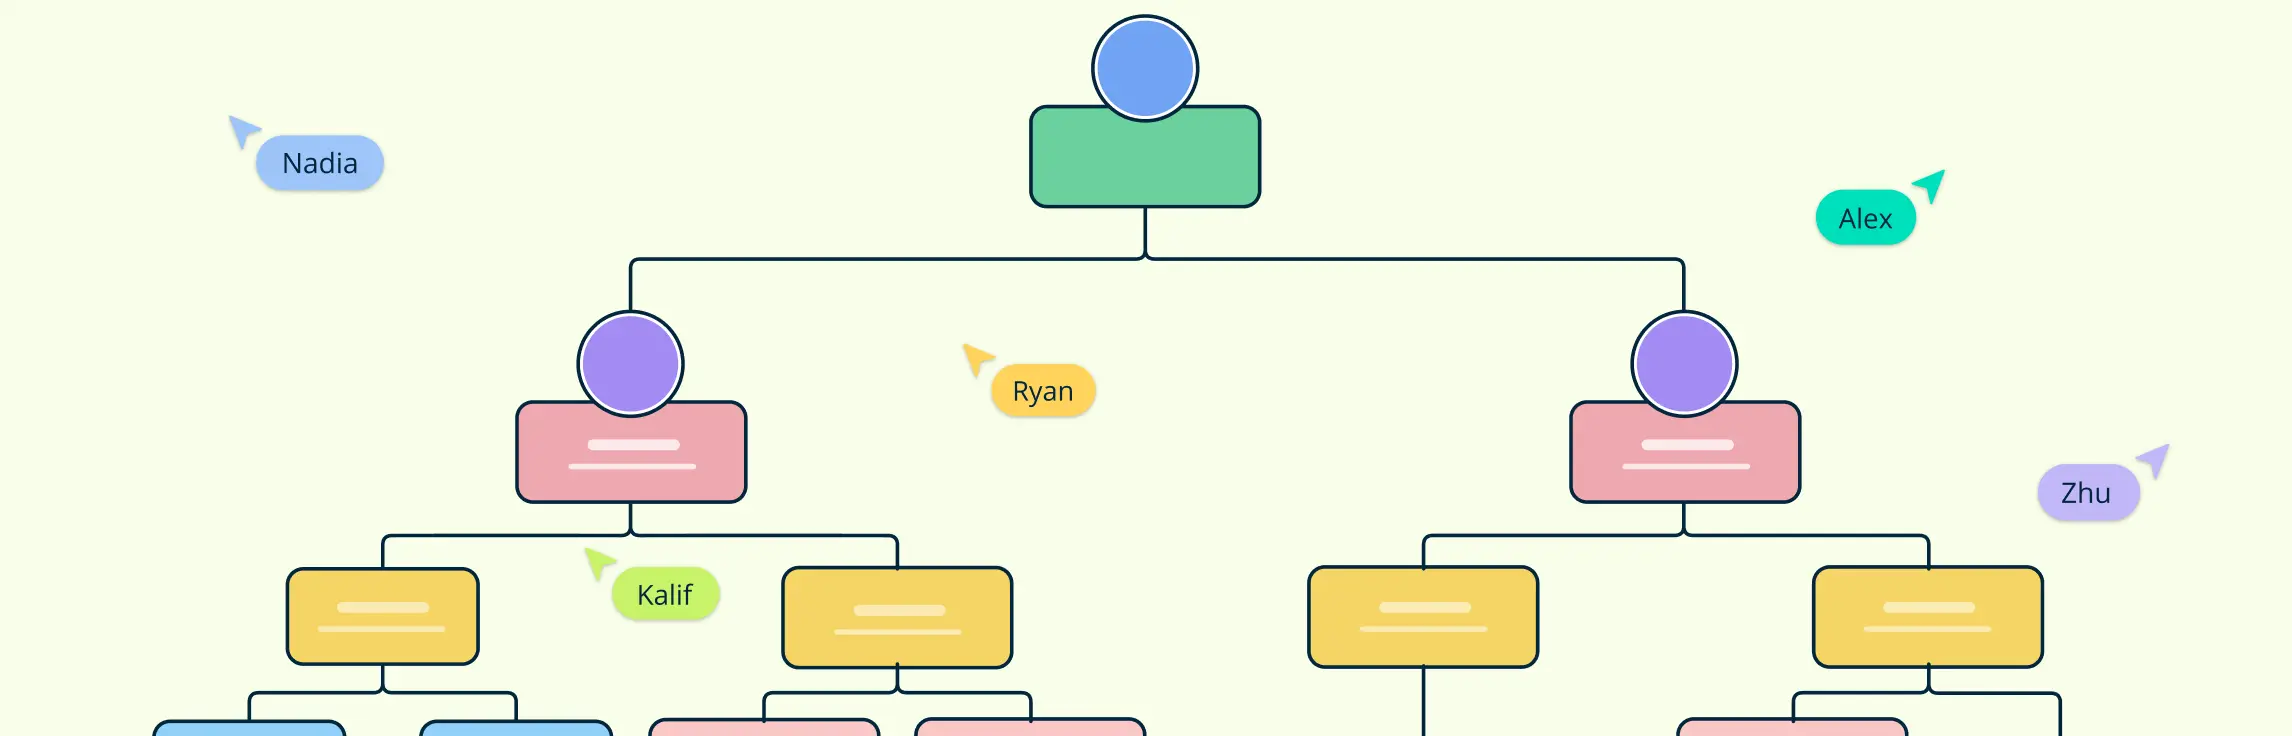
Step 3. Choose or Create a Template
Browse through Creately’s extensive library of templates tailored for different organizational structures. Select one that fits your company’s hierarchy—whether flat, hierarchical, or matrix-based.
If none align with your needs, start from a blank canvas to design a chart that’s unique to your organization’s workflow and structure.
Step 4. Import Employee Data
Leverage Creately’s CSV import feature to simplify the chart-building process. Upload your spreadsheet directly into the platform, and Creately will guide you through mapping columns (e.g., names, managers, departments) to the relevant fields in the org chart.
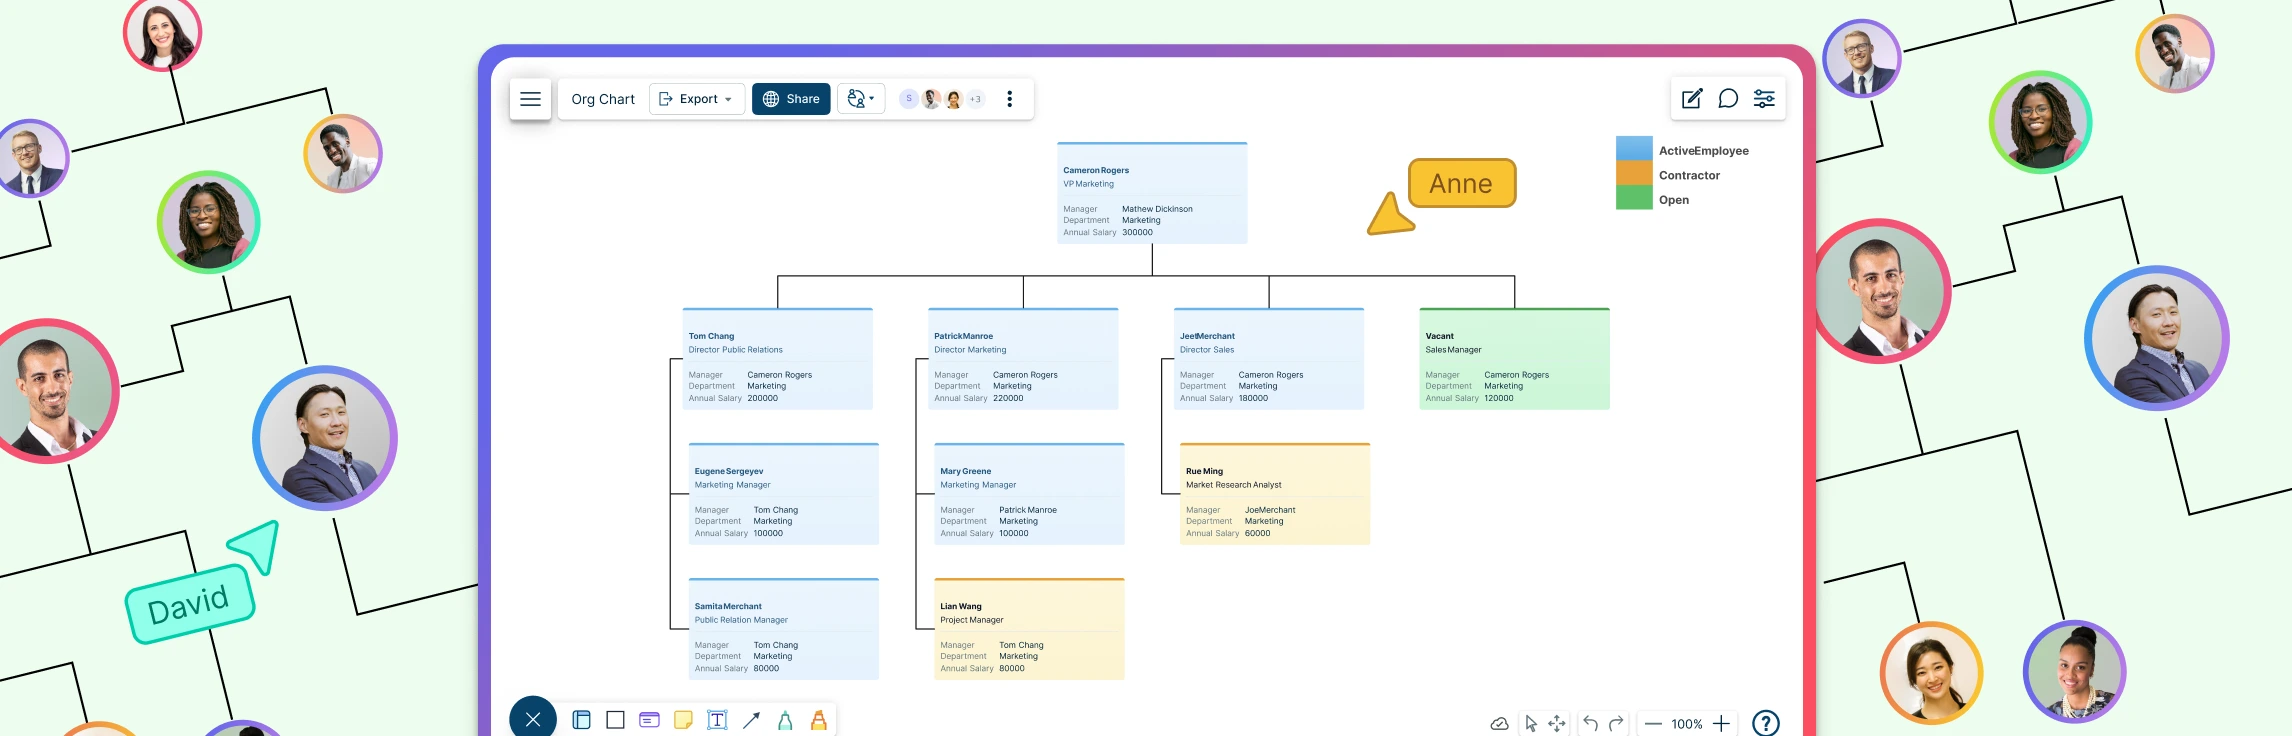
Step 5. Refine and Customize the Chart
With the initial structure in place, customize the chart to suit your organization’s style and branding. Options include:
Adjusting the layout (e.g., vertical for clarity or horizontal for space-saving).
Using color coding to represent different departments or teams.
Adding icons or shapes to emphasize specific roles or functions.
Step 6. Enable Dynamic Updates
One of the key advantages of a data-linked org chart is its ability to stay up-to-date. Utilize features like Saved Sets in Creately to group employees by criteria such as department or location. These sets update automatically whenever changes are made to the source data, ensuring your chart remains current without manual adjustments.
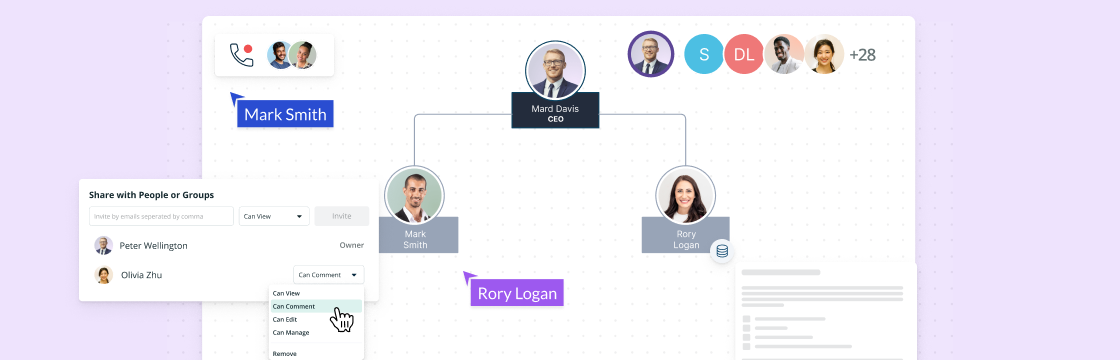
Step 7. Collaborate with Teams
Share the org chart with stakeholders by sending a secure link directly from Creately. Set permissions to control who can view or edit the chart, allowing for collaborative input while maintaining data integrity. This feature is especially useful for cross-departmental alignment and feedback sessions.
Important Data Points to Include in an Org Chart
Creating an effective data-linked org chart requires capturing critical information that not only defines the structure but also enhances organizational workflow and decision-making. Here are the essential data points to include:
Roles: Clearly defined roles are the backbone of any organizational chart. They help in understanding who is responsible for what within the firm. Adding this information directly onto the org chart can help ensure that these roles are accurately represented.
Responsibilities: Outline specific responsibilities associated with each role to provide clarity and prevent overlap. This not only boosts productivity but also defines accountability through each layer of an organization.
Hierarchy and Reporting Structure: Traditional org charts emphasize hierarchy, and it’s crucial to maintain this aspect. It helps in understanding the command and control channels.
Contact Information: Providing up-to-date contact information allows for swift communication, thus enhancing collaboration and operational effectiveness across departments.
Skills and Competencies: Highlight the unique skills and competencies of each team member. This information aids in allocating resources efficiently and aligns the right skills with the right opportunities.
Location: In today’s global business environment, knowing the geographical location of team members can help coordinate activities across time zones and plan for remote collaborations.
To maintain the accuracy of your org chart, it’s important to regularly update these data points. Changes in roles, responsibilities, and personnel should be reflected promptly in the chart to keep it relevant and useful for organizational planning.
Importance of Centralizing Employee Data
Centralizing employee data can transform organizational clarity. By having a single point of truth, organizations can significantly reduce data redundancy, ensuring that all departments work from the most current and accurate data. This allows HR to:
1. Improved Decision-Making
Centralized employee data enables leaders to make informed, data-driven decisions by providing access to real-time information. This includes insights into workforce distribution, skills inventory, and performance trends, which are essential for strategic initiatives like workforce optimization and succession planning.
2. Streamlined Compliance Management
Maintaining a single source of truth simplifies compliance with labor laws, tax regulations, and organizational policies. It reduces the risk of discrepancies and errors during audits by ensuring that all data is accurate and readily accessible from one location.
3. Enhanced Data Security
A centralized system can be fortified with robust security measures to protect sensitive employee information. Access control ensures that only authorized personnel can view or modify specific data, reducing the risks associated with fragmented storage and unauthorized access.
4. Seamless Onboarding and Offboarding
Centralized employee information simplifies the onboarding process by giving HR professionals quick access to all necessary details, such as department assignments and training requirements. Similarly, during offboarding, centralized data ensures a smooth transition by tracking tasks like access revocation and exit interviews.
5. Better Insights for Employee Development
By consolidating employee performance reviews, training records, and competency assessments, organizations can easily identify skill gaps and development opportunities. Centralized data aids in creating personalized learning plans and tracking progress over time.
6. Increased Operational Efficiency
Redundancies in data management—such as multiple versions of employee records—can waste significant time and resources. Centralization eliminates such inefficiencies, enabling HR teams to focus on high-impact activities rather than reconciling inconsistent information across departments.
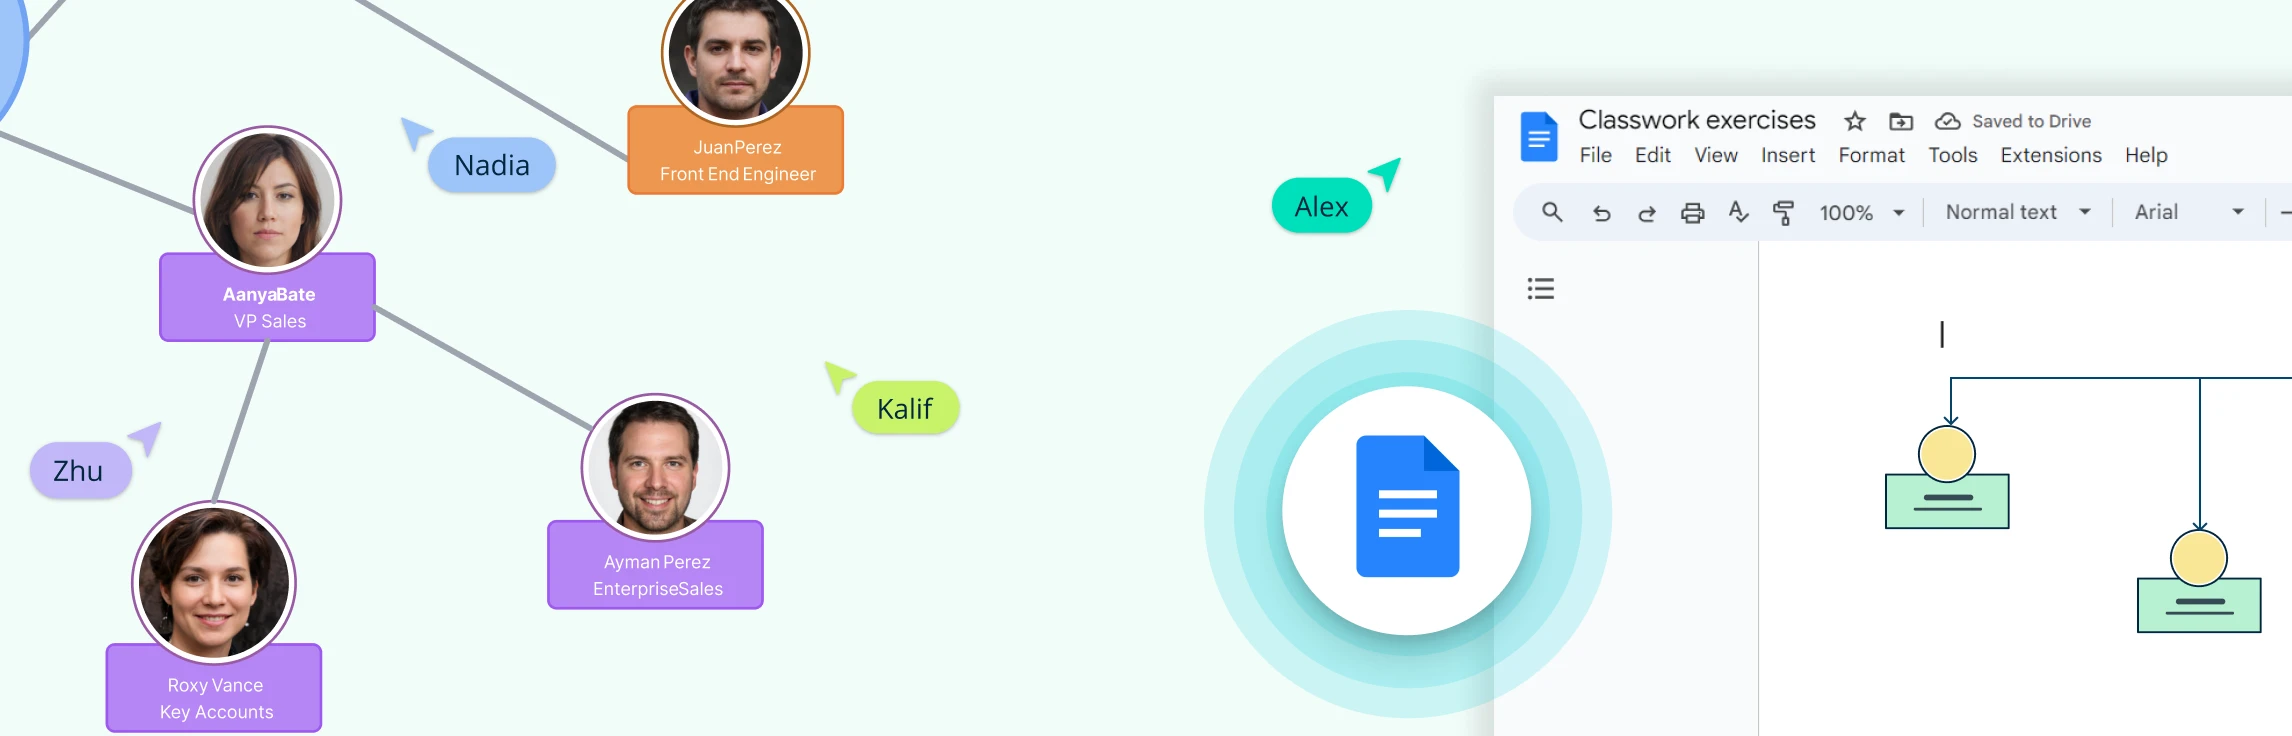
7. Integration with Other Systems
A centralized data repository integrates seamlessly with other tools, such as payroll systems, performance management platforms, and talent acquisition software. This integration reduces duplication of efforts and ensures consistency across various operational processes.
Enhanced Collaboration Potential
Organizations thrive when all departments collaborate seamlessly. By centralizing employee information, HR departments can act as a connecting hub that fosters cross-departmental collaboration. This integration facilitates effective HR planning and data management, streamlining workflows and ensuring that teams remain aligned and focused on common objectives.
With centralized data, organizations can not only create and update data-linked org charts effortlessly but also harness these charts to align organizational goals with workforce capabilities, ensuring clarity and agility in today’s dynamic business environment.