Understanding how a system behaves requires looking at both its process flow and its state changes, and that’s where Activity and State Diagrams come in. This guide explores the Difference Between Activity Diagram and State Diagram in UML, explaining how each visualizes system behavior from a different perspective. You’ll learn how each diagram works with real-world examples, and how to choose the right one for your modeling needs.
What is a UML Activity Diagram?
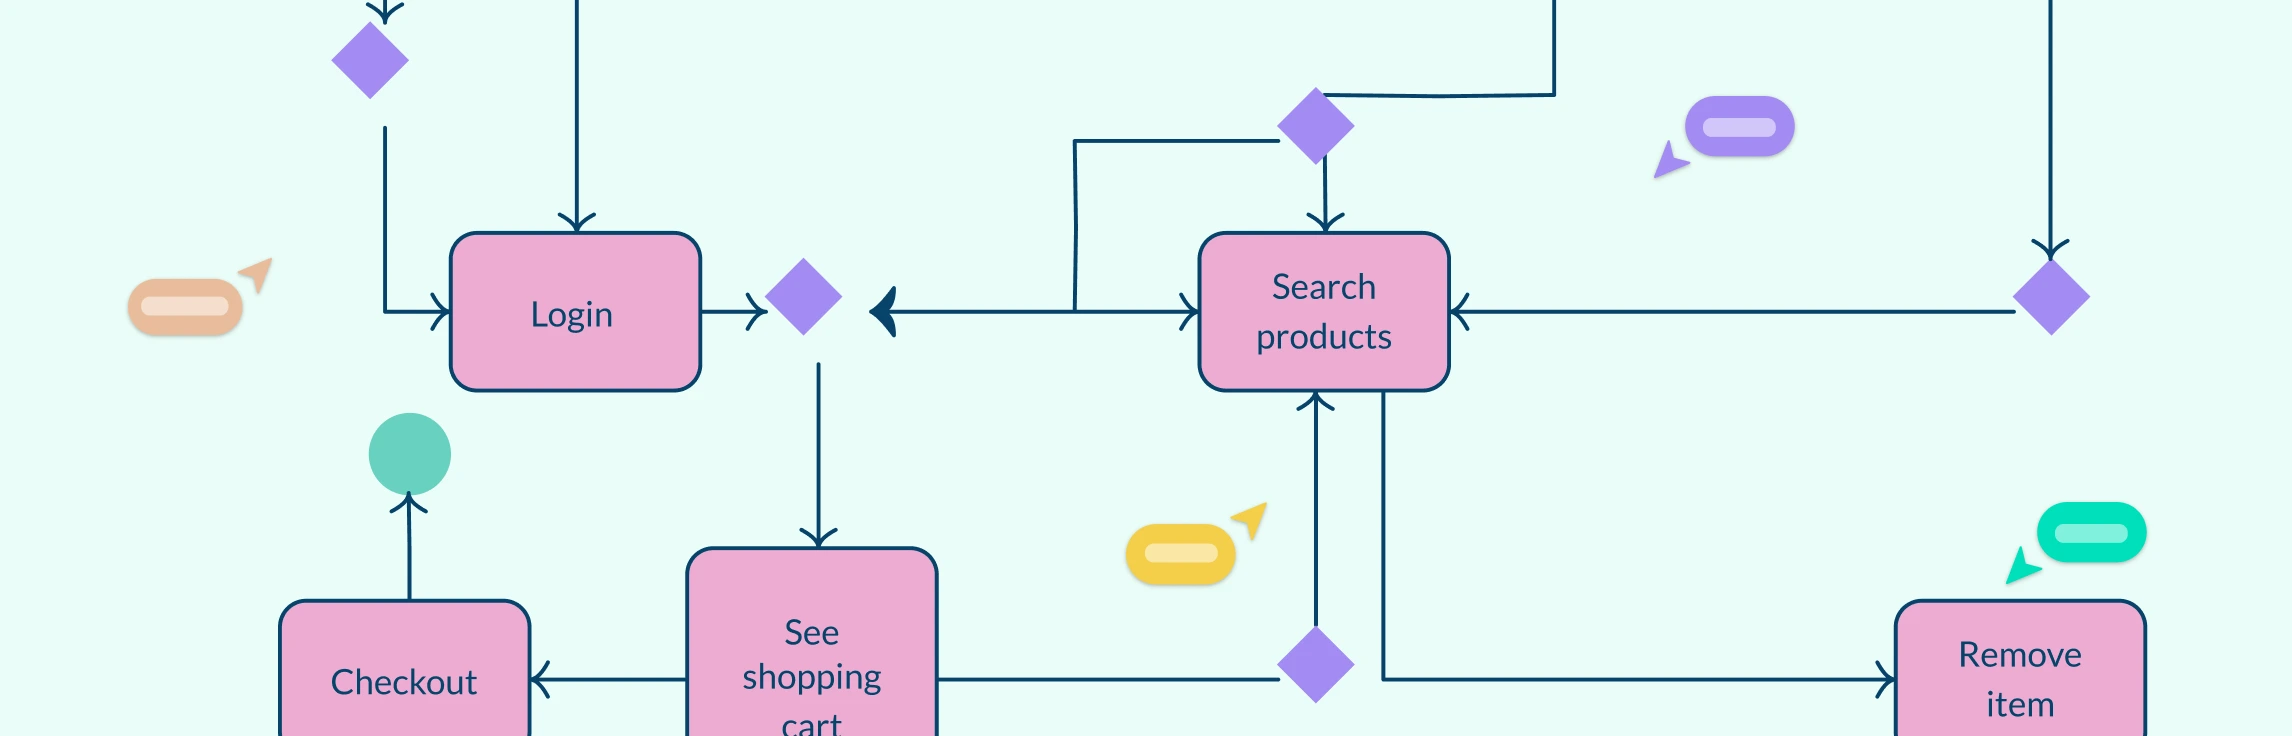
An Activity Diagram is a behavioral UML diagram used to model the workflow or sequence of actions in a process or system. It visually represents how different activities, decisions, and concurrent processes occur, showing how a system moves from one activity to another until the process is complete. UML Activity diagrams are particularly useful for analyzing business workflows, describing system operations, or illustrating logic within a use case.
Read the activity diagram tutorial for more about what they are, their symbols, and how to draw them.


What is a UML State Diagram?
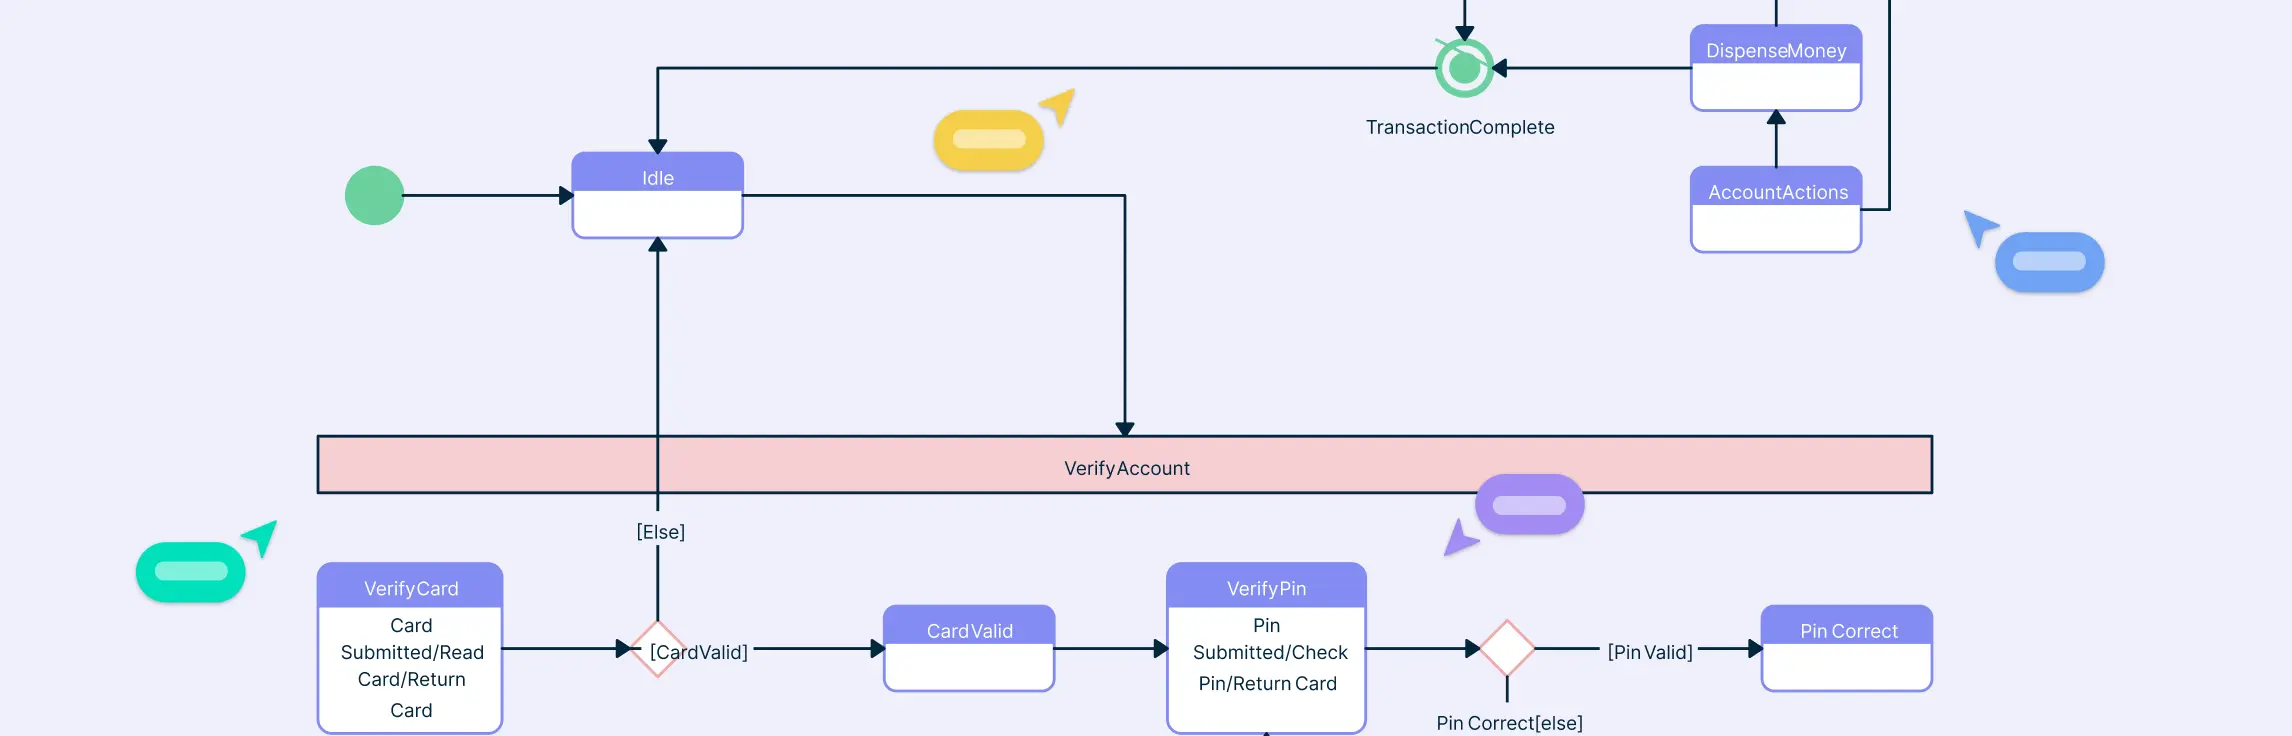
A State Diagram (also known as a State Machine Diagram or State Chart) is a behavioral UML diagram that models the different states an object goes through during its lifecycle and the events or conditions that trigger transitions between those states. It focuses on how a system or object responds to internal and external stimuli over time. This makes UML state diagrams especially valuable for modeling reactive systems, where behavior depends on past and current states such as devices, controllers, or user sessions.
Read the guide to state diagrams to learn about their notations, how to draw, and applications.

Key Differences Between Activity Diagram and State Diagram
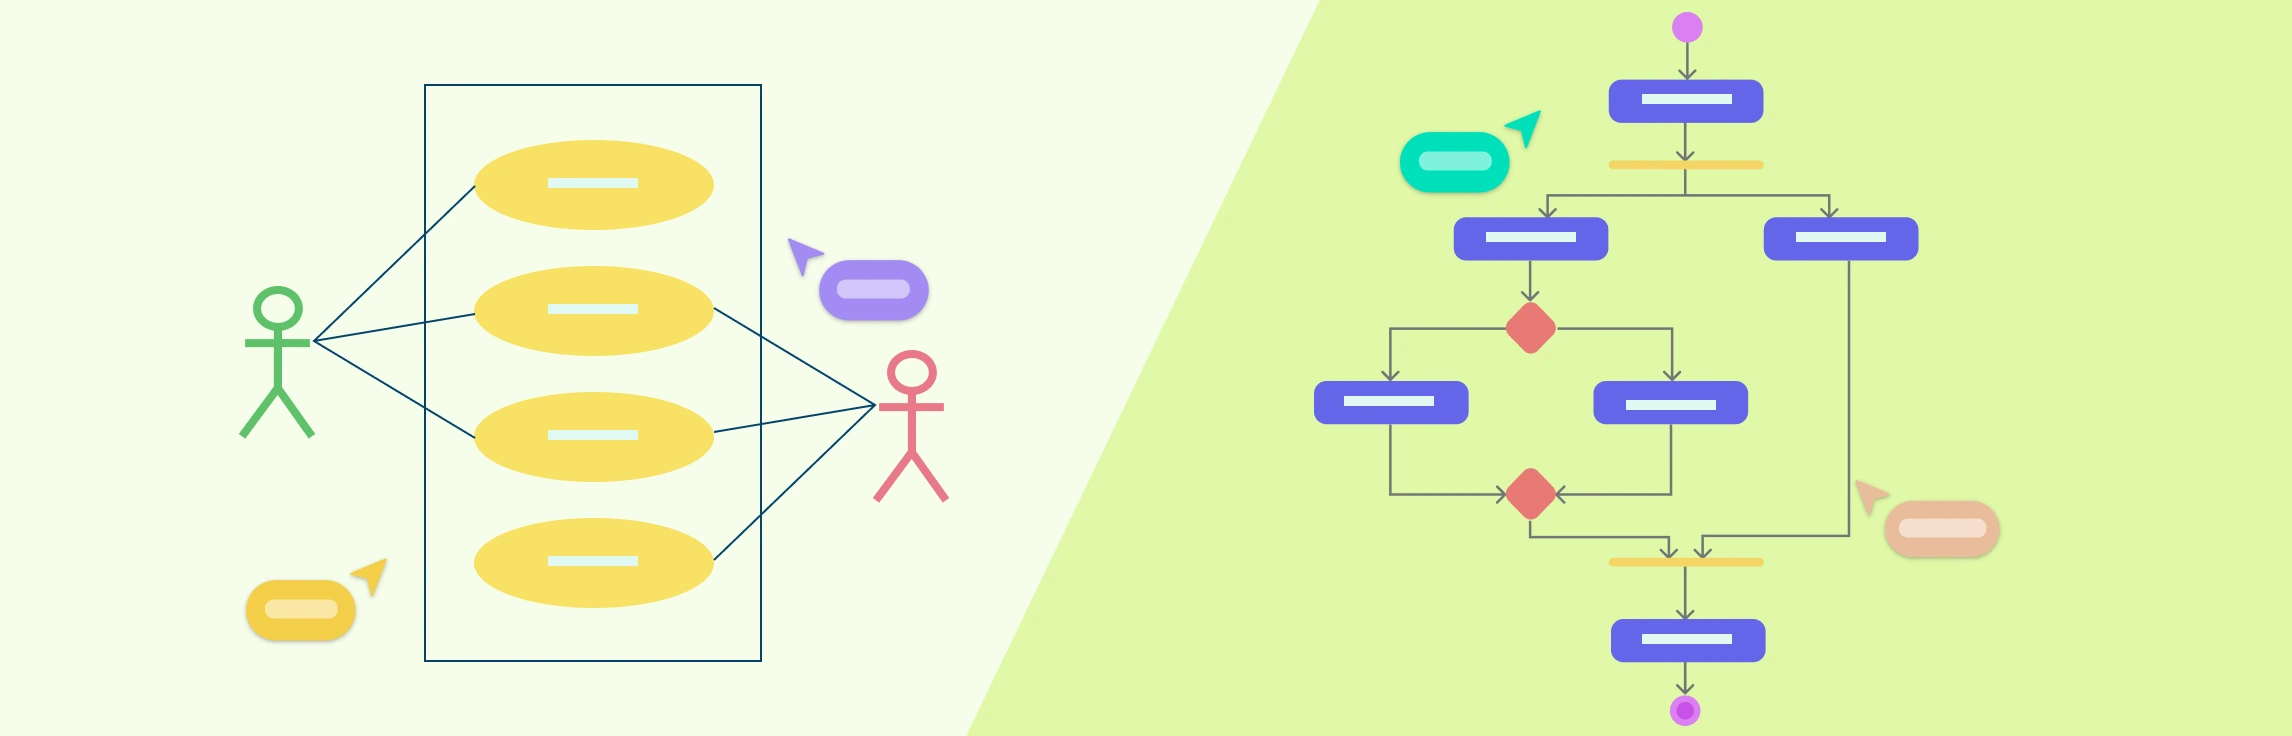
While both Activity Diagrams and State Diagrams are behavioral UML diagrams used to model dynamic aspects of a system, they focus on different perspectives.
Aspect | UML Activity Diagram | UML State Diagram |
Primary Focus | Models the flow of control or activities within a system or process. | Models the states of an object and how it transitions based on events. |
Purpose | Used to represent workflows, business processes, or operational logic. | Used to represent the lifecycle and event-driven behavior of a system or object. |
Flow Type | Sequential or parallel flow of actions and decisions. | Event-driven transitions between defined states. |
Representation | Emphasizes activities, actions, and decisions using symbols like ovals and diamonds. | Emphasizes states, transitions, and events using rounded rectangles and arrows. |
Time Aspect | Focuses on the progression of activities from start to finish. | Focuses on how an object’s state evolves over time. |
Used For | Modeling business processes, use case flows, or system operations. | Modeling reactive systems, object lifecycles, or event-driven behavior. |
Notation Examples | Start node, activity, decision, merge, fork, join, end node. | Initial state, state, transition, guard condition, final state. |
Typical Questions Answered | “What tasks are performed and in what order?” | “How does the system or object react when events occur?” |
Example Use Case for State Diagram Vs. Activity Diagram
Let’s take an online food ordering system as an example, and see how it would be represented in both diagrams.
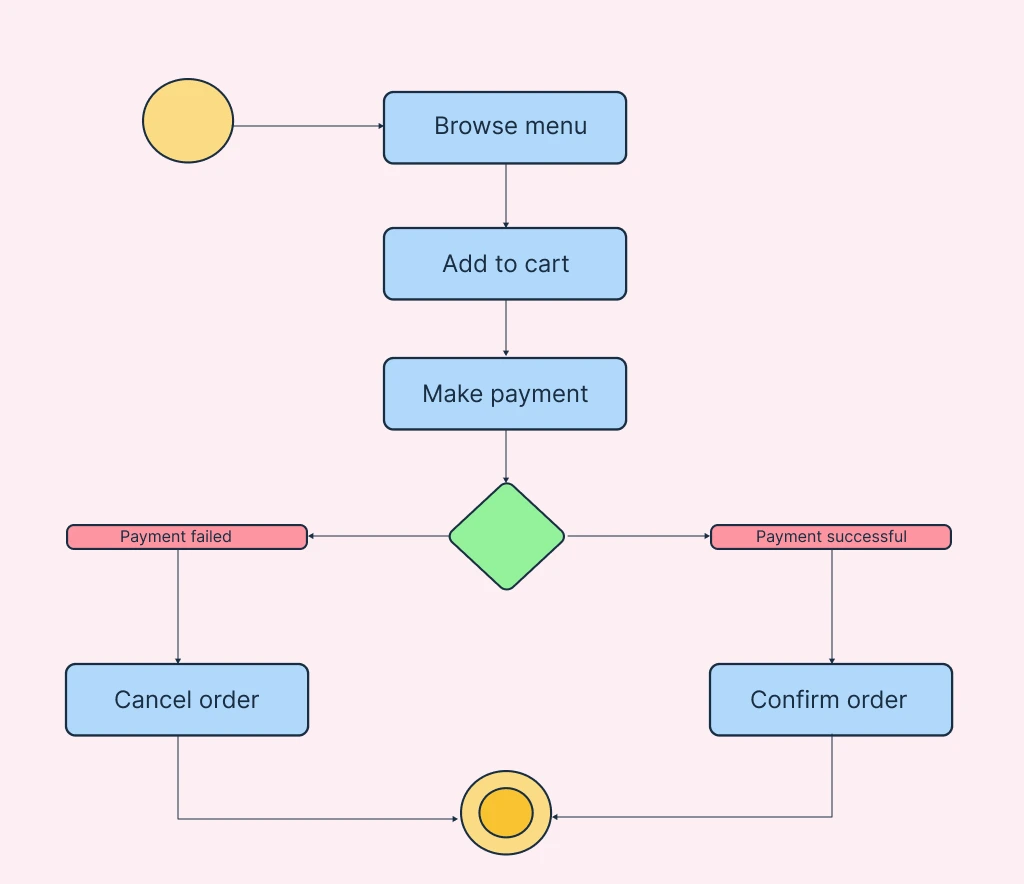
UML Activity Diagram – Workflow Representation
Remember that the purpose is to show the sequence of actions and decision flow in the process of ordering food online. You can easily create and customize this using Creately’s activity diagram tool, which helps you visually map each step and add decision points with standard UML symbols. Things to include in the UML activity diagram are,
Start node – Marks the beginning of the process.
Activities (actions)
- Browse Menu
- Add to Cart
- Make Payment
- Confirm Order
Decision node: After “Make Payment,” branch into:
[Payment Successful] → Proceed to “Confirm Order”
[Payment Failed] → “Cancel Order”
End node – Marks the completion of the process (e.g., “Order Confirmed”).
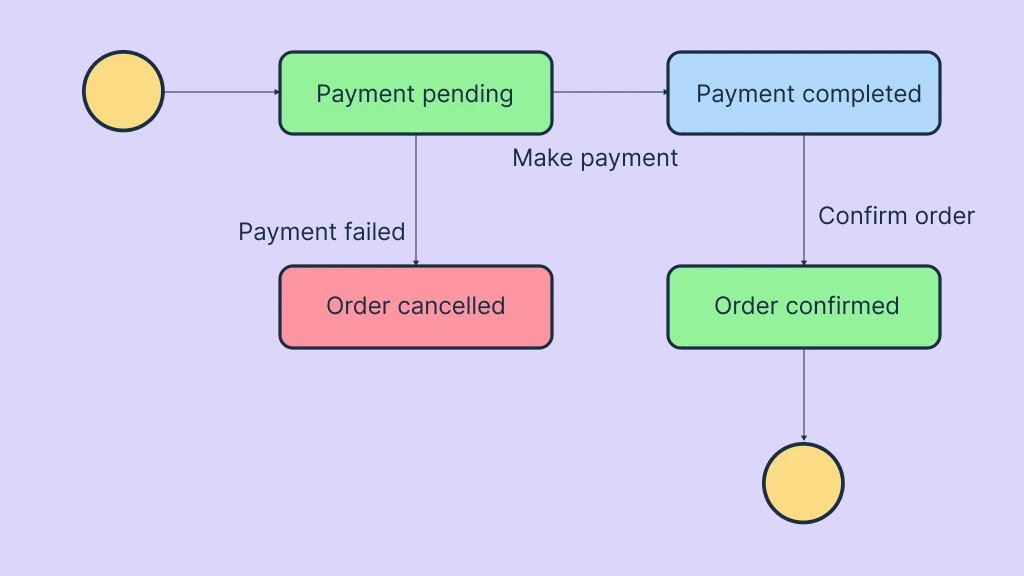
UML State Diagram – Object Lifecycle Representation
The purpose is to show how the Order object changes states throughout its lifecycle in response to events such as payments or cancellations. You can easily visualize and modify this using Creately’s state machine diagram tool, which helps you map each state, transition, and event clearly using standard UML notation. You need to include,
Initial State: Marks where the order’s lifecycle begins.
States: Each represents a condition of the order object during its lifecycle:
- Payment Pending – The order is created but payment is not yet made.
- Payment Completed – Payment is successful, and the order is confirmed.
- Order Canceled – Payment failed or the user canceled the order.
- Order Confirmed – The order is finalized and ready for processing.
Transitions: Arrows connecting states, labeled with the triggering event or action:
- Make Payment → moves from Payment Pending → Payment Completed
- Payment Failed → moves from Payment Pending → Order Canceled
- Confirm Order → moves from Payment Completed → Order Confirmed **
Events / Triggers: These cause transitions between states:
- Make Payment
- Payment Failed
- Confirm Order
Final State: Marks the end of the order’s lifecycle.
How to Choose Between Activity Diagram and State Diagram
Both Activity Diagrams and State Diagrams are valuable for modeling system behavior, but they serve different purposes and should be used in different contexts.
Use a UML Activity Diagram when you need to:
Visualize the workflow or process logic within a system.
Represent sequential or parallel actions and decision points.
Explain how tasks flow between actors or components in a use case or business process.
Model high-level operations, such as “Order Processing,” “User Registration,” or “Data Validation.”
Browse our collection of ready-made activity diagram templates to get started.
Use a UML State Diagram when you need to:
Model the lifecycle of an object and how it changes state in response to events.
Capture system reactions to internal or external triggers, like “Payment Received” or “Order Canceled.”
Describe event-driven behavior or reactive systems such as devices, controllers, or automated processes.
Understand conditions and transitions rather than step-by-step workflows.
Check the state diagram templates in our template library to pick and start customizing your own.
Free UML Activity Diagram and UML State Machine Diagram Templates


FAQs about UML State Diagram Vs. UML Activity Diagram
Can activity diagrams and state machine diagrams be used together?
Which diagram should I draw first, an activity diagram or a state diagram?
Is a UML State Machine diagram better for modeling system logic than a UML Activity Diagram?
Resources
Gogolla, Martin, and Cris Kobryn. UML 2001 - the Unified Modeling Language. Modeling Languages, Concepts, and Tools. Springer, 30 June 2003.
Ng, Muan Yong, and M. Butler. “Towards Formalizing UML State Diagrams in CSP.” IEEE Xplore, 1 Sept. 2003, https://ieeexplore.ieee.org/abstract/document/1236215.