Perceptual mapping helps you see your brand the way customers do, along with who you’re competing with, where you shine, and where gaps or opportunities might be hiding. In this guide, you’ll learn how to draw a perceptual map step-by-step using Creately’s free templates, along with practical tips to make sure your map reflects real customer perceptions.
What is Perceptual Mapping?
Perceptual mapping is the process of visually charting how customers see different brands or products in a market. It results in a perceptual map, a simple visual chart that uses key attributes (such as price vs. quality, innovation vs. reliability, or style vs. functionality) to plot each brand based on consumer perception. By mapping these insights, teams can quickly understand their market position, identify direct competitors, and spot opportunities or gaps that can shape stronger marketing, branding, and product decisions.


How to Make a Perceptual Map in 6 Steps
Perceptual mapping is simple when you break it down into a few clear steps. You can follow these steps to create a perceptual map using Creately’s free perceptual map maker which comes with ready-made templates that can be customized in minutes.
Step 1: Clarify the goal of your perceptual map
Begin by defining what you want the perceptual map to reveal. Are you trying to identify a market gap, compare competing products, understand brand positioning, test a new concept, or validate customer perceptions? Write down the objective clearly so everyone involved understands the purpose of the analysis. This ensures every decision you make afterward such as attributes, competitors, data, and interpretation stays aligned with the outcome you want to achieve.
Step 2: Choose the attributes you want to compare
Select the two attributes that most strongly influence how customers perceive your product or category. Label each axis of the map clearly so the comparison is easy to understand. Common attribute pairs include:
- Price vs. Quality
- Modern vs. Traditional
- Simple vs. Complex
- Healthy vs. Unhealthy
- Creative vs. Predictable
Step 3: List all relevant competitors
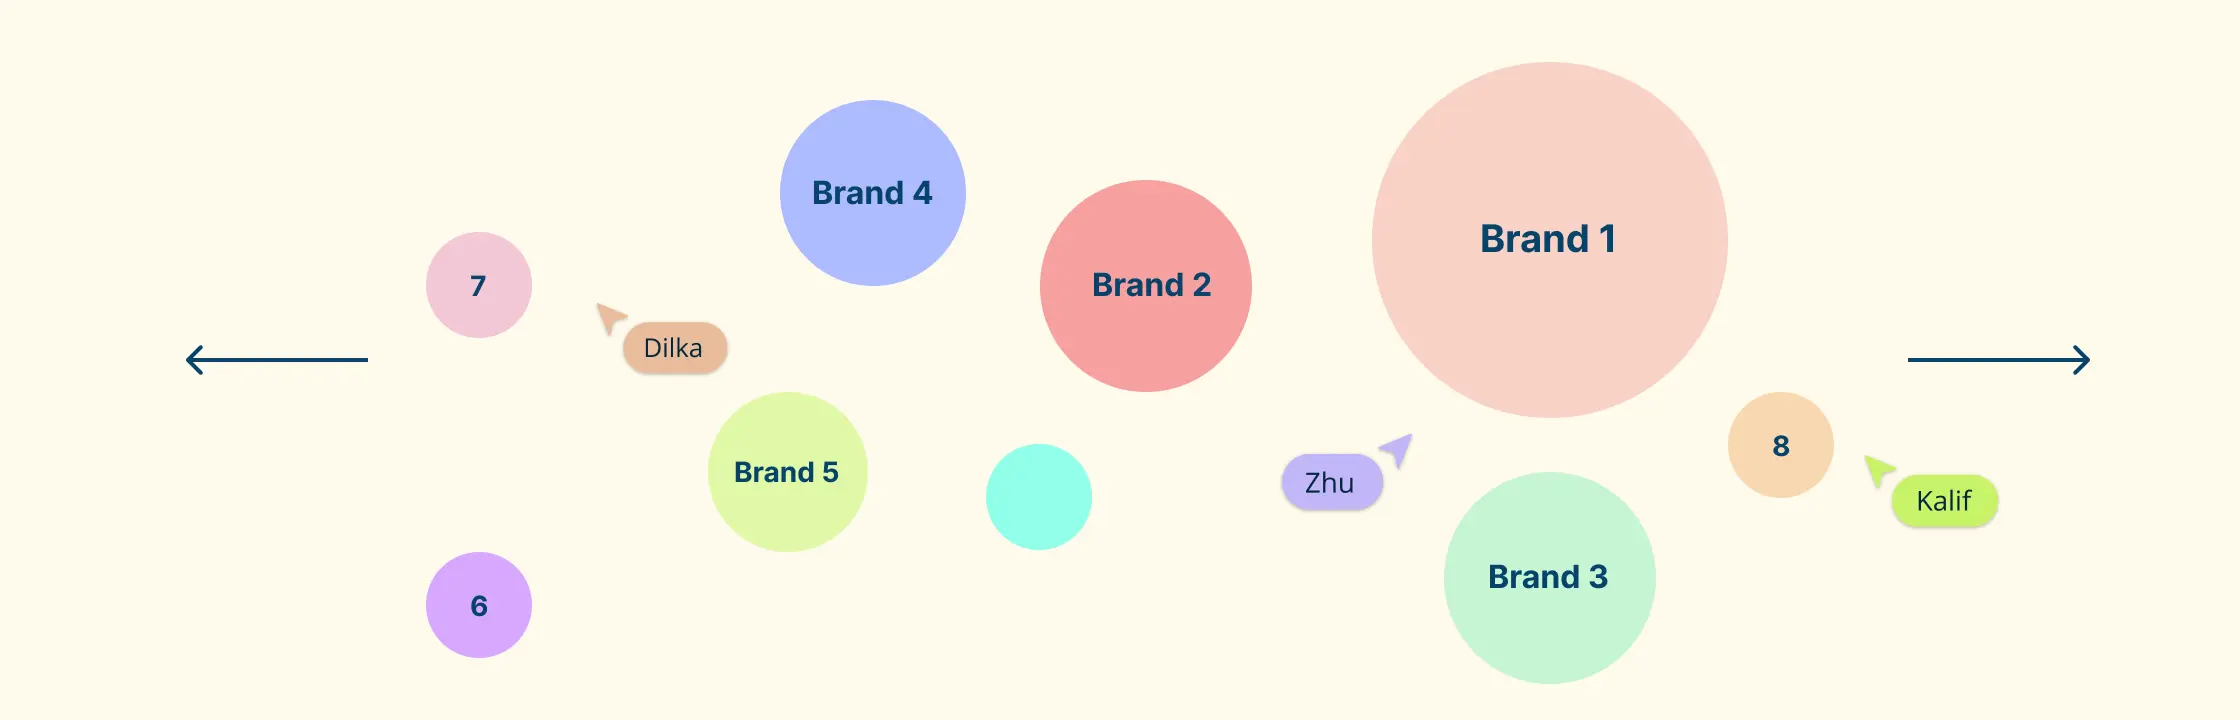
Identify every direct and indirect competitor your audience might consider. Include established brands, emerging players, substitutes, and niche options. Keep this list visible so you can revisit, refine, or reorganize it before placing anything on the map.
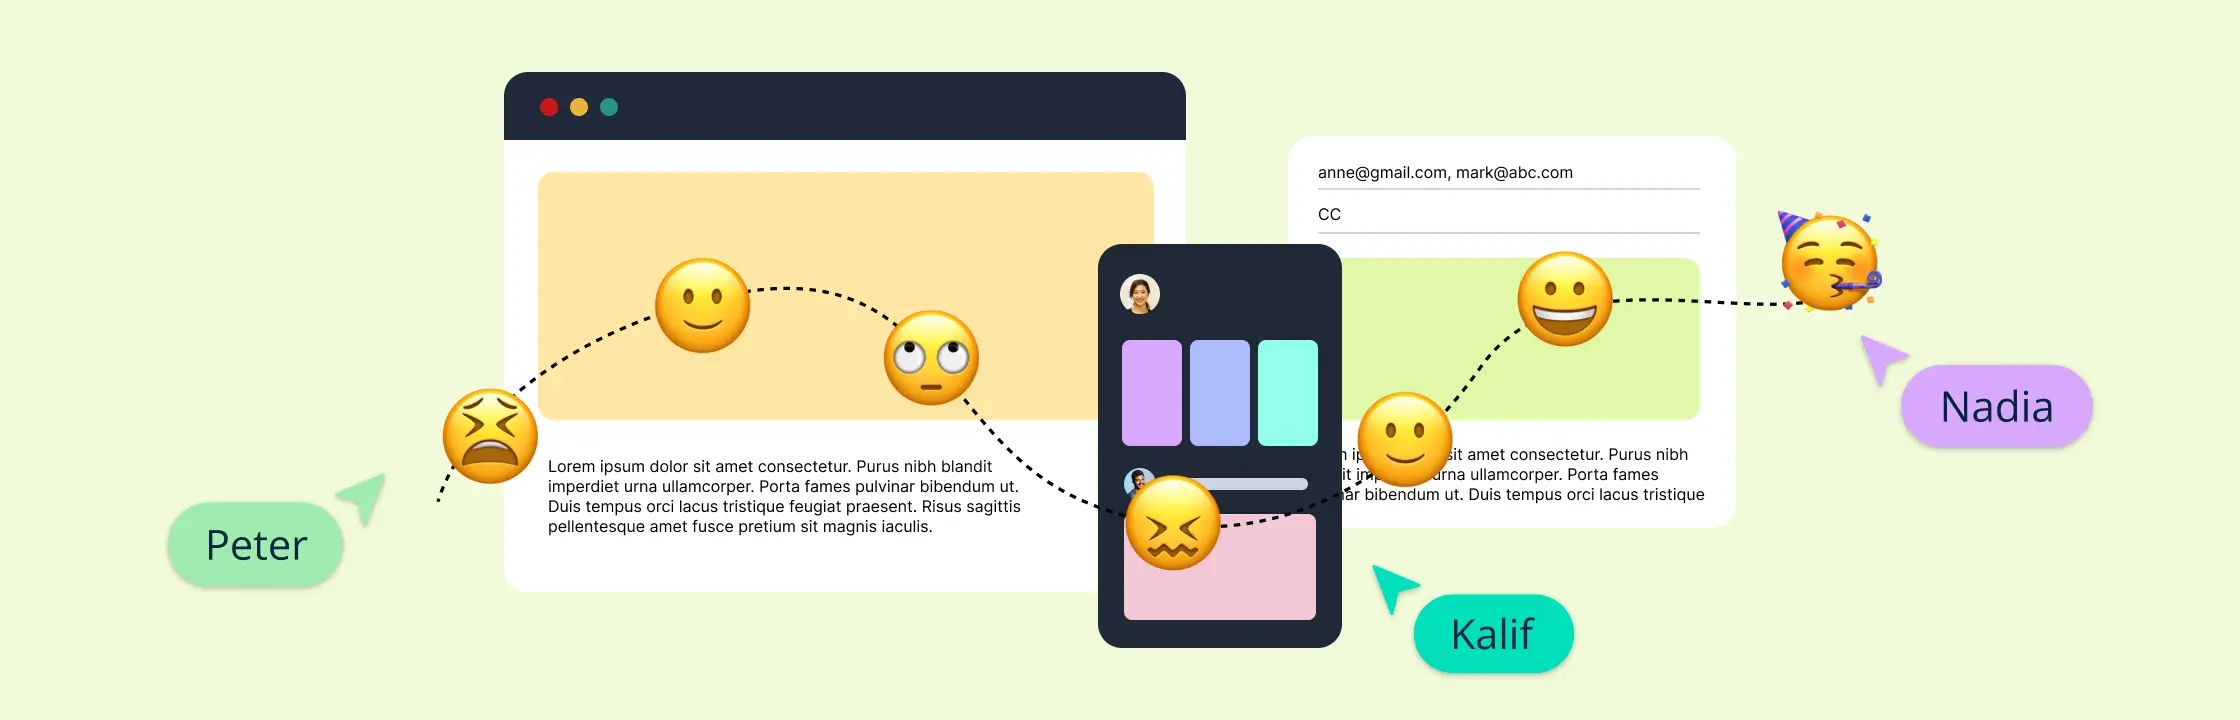
Step 4: Gather customer perception data
Collect insights from surveys, interviews, reviews, industry reports, and social listening. Compile this information in one place so you can reference it easily while mapping. These insights act as the evidence behind where each brand or product will be positioned.
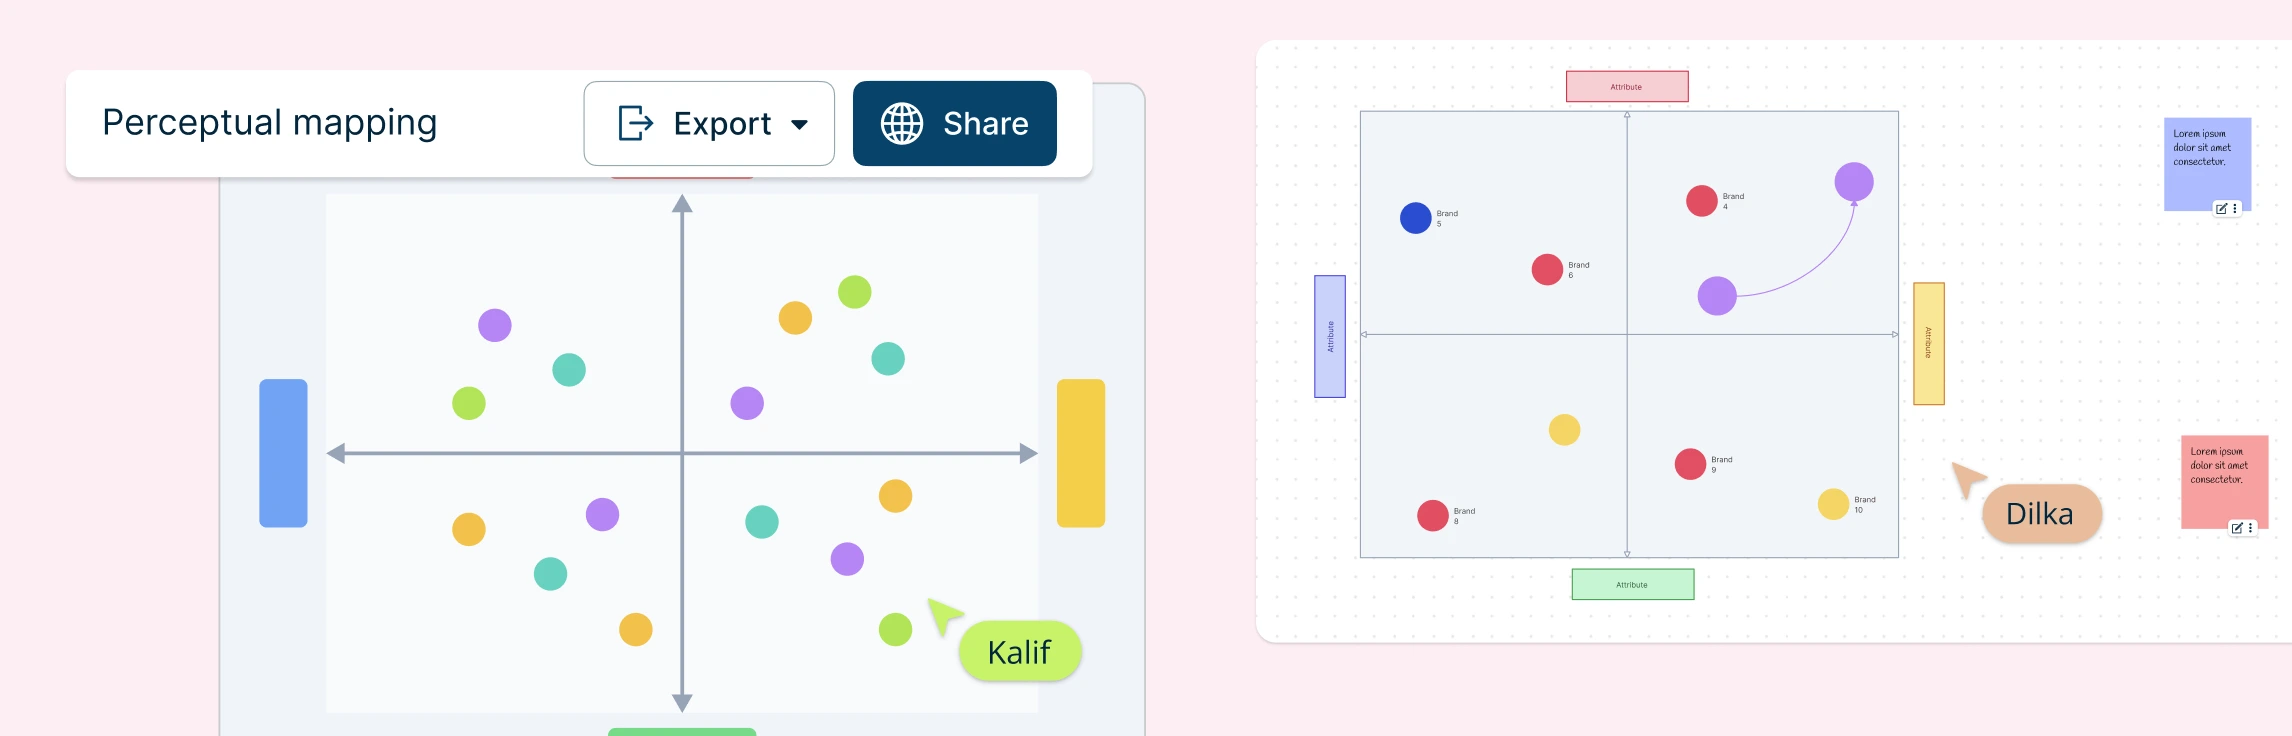
Step 5: Plot each competitor on the map
Using the chosen attributes as your axes, place each competitor in the quadrant that reflects how customers perceive them. Adjust positions as you compare the data, refine interpretations, or revisit earlier observations. Add your own brand or product last since this helps you see how it stands relative to the full competitive landscape.
Step 6: Analyze the map and determine next steps
Review the completed map for patterns, such as:
- Crowded areas where many competitors overlap
- Empty spaces that might indicate market gaps
- Brands positioned differently than expected
- Opportunities to differentiate or reposition
From here, outline potential actions such as adjusting messaging, refining product features, targeting new segments, or exploring new positioning strategies.
Tips to Create a Perceptual Map That Works
Now that you know how to build a perceptual map, keep these practical tips in mind to make sure the insights you uncover are accurate, meaningful, and grounded in real customer perception.
Pick attributes that really matter: Choose determinant attributes, meaning factors that truly influence customer decisions to get insights that reflect real-world behavior.
Use the right data collection method: Surveys, polls, interviews, and focus groups can all work; choose the method that best fits your goals and audience.
Ensure your sample represents your market: A diverse and appropriately sized sample helps your map reflect actual customer perceptions instead of skewed or niche feedback.
Watch out for “middle scores”: If respondents aren’t familiar with certain brands, they may default to the middle of the scale. This often signals low brand awareness, not balanced perception.
Be realistic about positioning: Perceptual maps often reveal mismatches between how you think customers see you and how they actually do. Prepare teams for honest insights, not just good news.
Label everything clearly: Keep axes, attributes, and brand markers easy to read so the map is immediately understandable to anyone reviewing it.
Update your map regularly: Perceptual maps are most valuable when tracked over time. Refresh them as campaigns launch, competitors shift, or customer expectations change.
Free Perceptual Map Templates


FAQs about How to Make a Perceptual Map
How many competitors should I include in the perceptual map?
Do I have to use only two attributes?
Should I plot my own brand first?
How often should I update my perceptual map?
Resources
Steenkamp, Jan-Benedict E.M., et al. “Perceptual Mapping Based on Idiosyncratic Sets of Attributes.” Journal of Marketing Research, vol. 31, no. 1, Feb. 1994, pp. 15-27, https://doi.org/10.1177/002224379403100102.
Ganesh, Jaishankar, and Gillian Oakenfull. “International Product Positioning.” Journal of Global Marketing, vol. 13, no. 2, 3 Apr. 2000, pp. 85-111, https://doi.org/10.1300/j042v13n02_06.