Is your design team seen as a strategic powerhouse—or just a cost center?
Design teams today face mounting pressure to justify their impact. As creative work scales across products and channels, measuring design ops has become crucial for proving value, securing budgets, and optimizing processes. This guide breaks down how to measure ROI in design operations, track meaningful KPIs, and use frameworks and templates to maximize business outcomes.
What Is Design Operations ROI?
Before measuring design ops effectively, you need to understand what you’re measuring.
Design Operations ROI (Return on Investment) quantifies the value created by your design operations compared to the cost of running them. It reflects how well your workflows, systems, and design efforts contribute to efficiency, quality, and revenue.
How to Measure DesignOps ROI
To calculate ROI, use this simple formula:
ROI = (Value Delivered – Cost of Design Ops) / Cost of Design Ops
1. Calculate Costs
Include:
- Team salaries
- Software licenses
- Training and onboarding
- Platform integrations
- Overhead (allocated)
2. Identify Value Streams
Quantify:
- Time saved (e.g., shorter cycle times)
- Quality gains (e.g., fewer rework hours)
- Revenue impact (e.g., faster launches, improved retention)
Example:
A design team cuts cycle time by 20%, saving 500 hours annually at $70/hour ($35,000). Reducing rework saves another $10,000. If faster delivery drives a $5,000 revenue uplift, total value = $50,000. If the annual cost is $100,000, then:
ROI = ($50,000 – $100,000) / $100,000 = –50%
(You now have data to make smarter investment decisions.)
Essential Metrics for Measuring Design ROI
Tracking the right design operations metrics gives insight into both process performance and business impact.
Process Metrics
- Cycle time: Time from request to delivery
- Throughput: Number of design units completed per sprint
- Iteration count: Average versions before approval
Outcome Metrics
- NPS (Net Promoter Score)
- User adoption rate
- Feature utilization rate
Quality Metrics
- Defect escape rate
- Rework percentage
- User-reported issues
Business Metrics
- Revenue uplift from design-led features
- Customer retention delta
- Time-to-market improvement
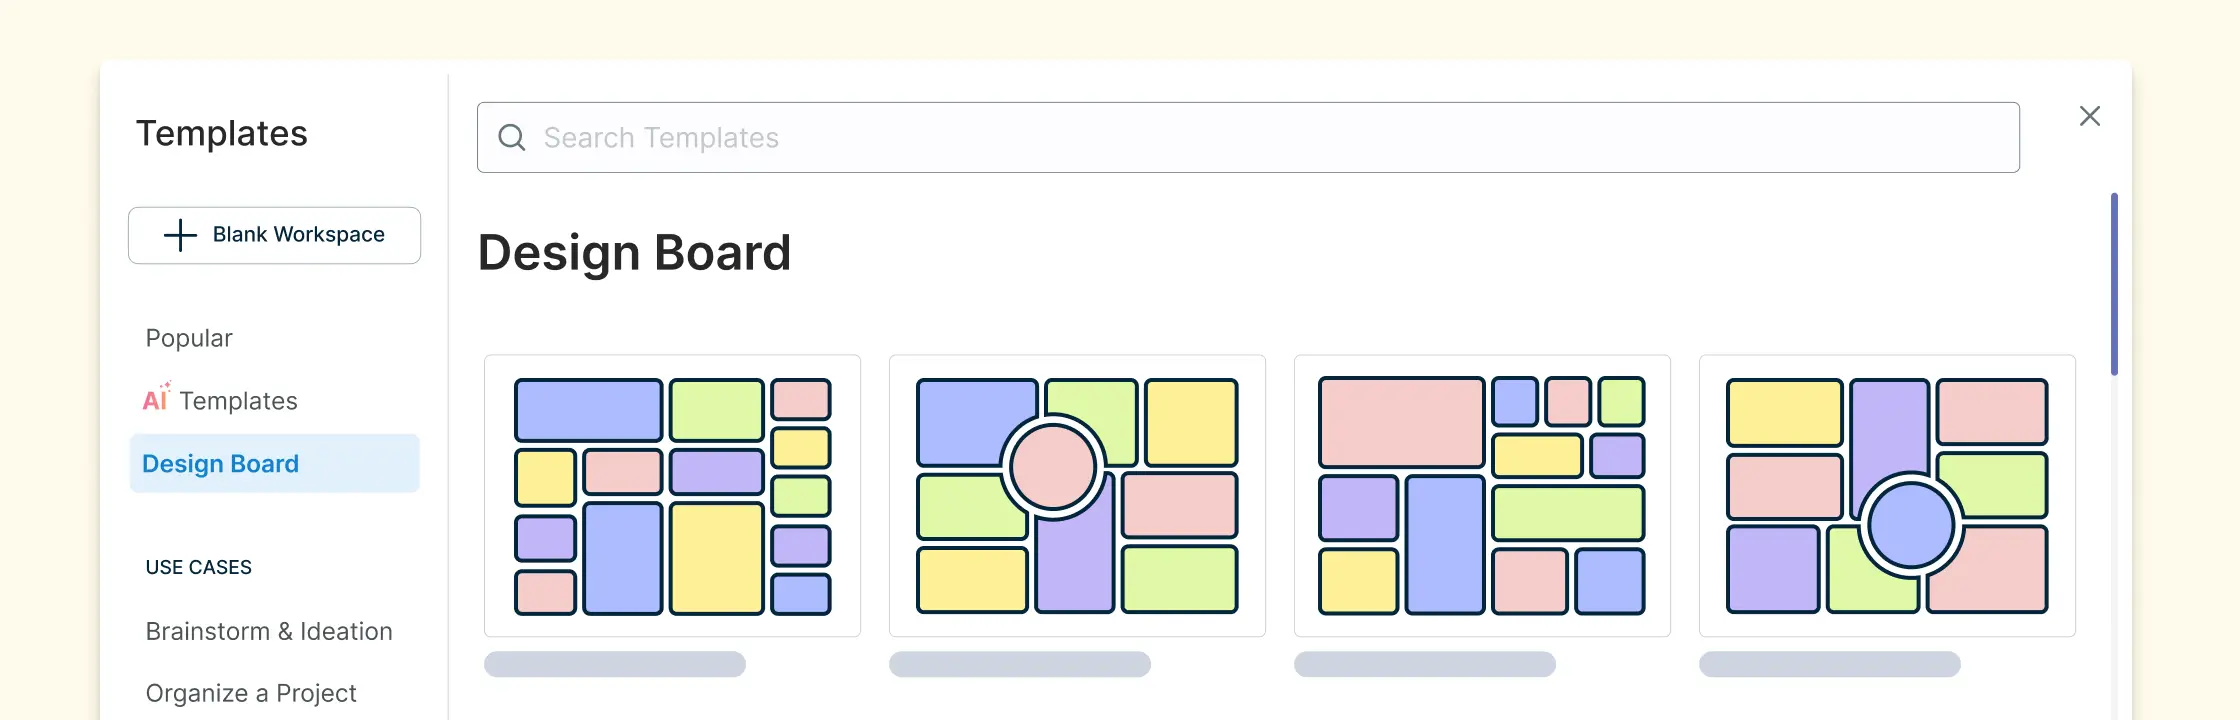
Using Templates to Visualize, Measure, and Optimize ROI
Visual tools and templates simplify measuring design ops by making your metrics and processes clear, trackable, and shareable.
1. DesignOps KPI Dashboard
Track core metrics—cycle time, NPS, throughput—in a single view.


2. DMAIC Analysis Template
Use the DMAIC (Define, Measure, Analyze, Improve, Control) framework to improve workflows.

3. Service Blueprint
Visualize customer touchpoints and internal operations to identify inefficiencies.

4. Design Workflow Mapping Template
Lay out the full design lifecycle—from research to handoff—and surface bottlenecks.

Measuring design ops isn’t just about reporting—it’s about improving. By tracking ROI and aligning design metrics with business objectives, teams can move from reactive design delivery to strategic business partnership.
Resources:
Kosicki, M., Tsiliakos, M., ElAshry, K., Borgstrom, O., Rod, A., Tarabishy, S., Nguyen, C., Davis, A. and Tsigkari, M. (2022). Towards DesignOps Design Development, Delivery and Operations for the AECO Industry. Towards Radical Regeneration, pp.61–70. doi:https://doi.org/10.1007/978-3-031-13249-0_6.