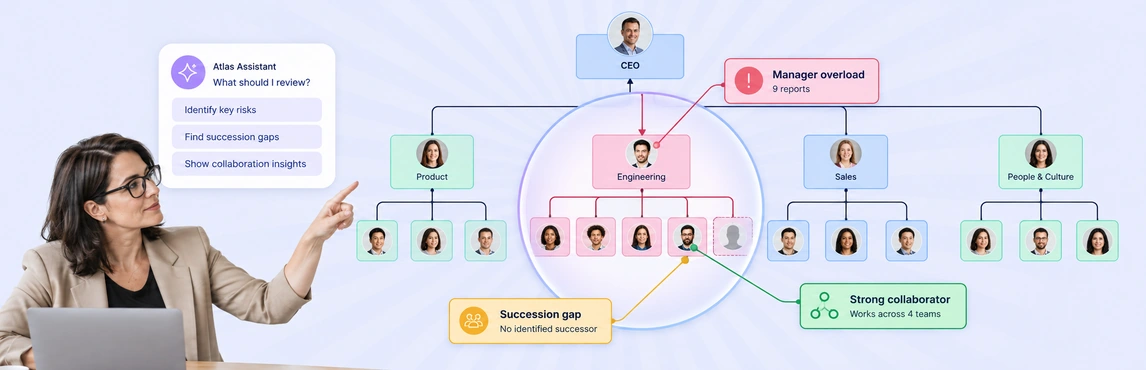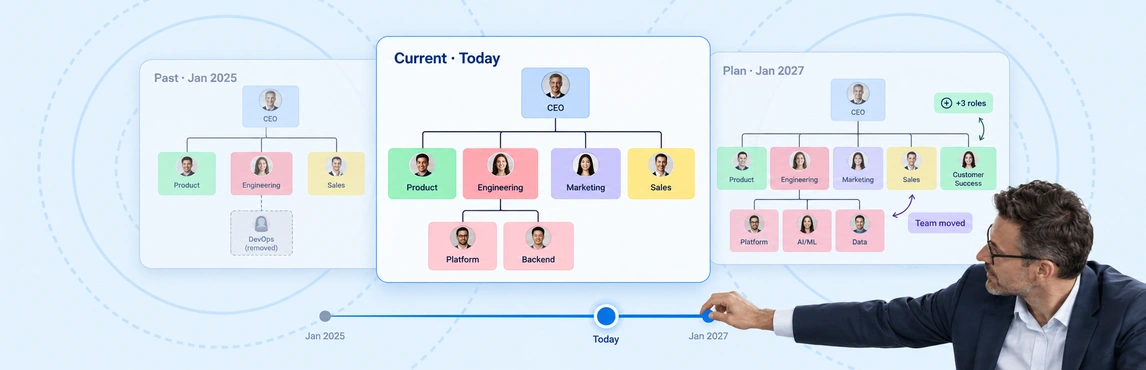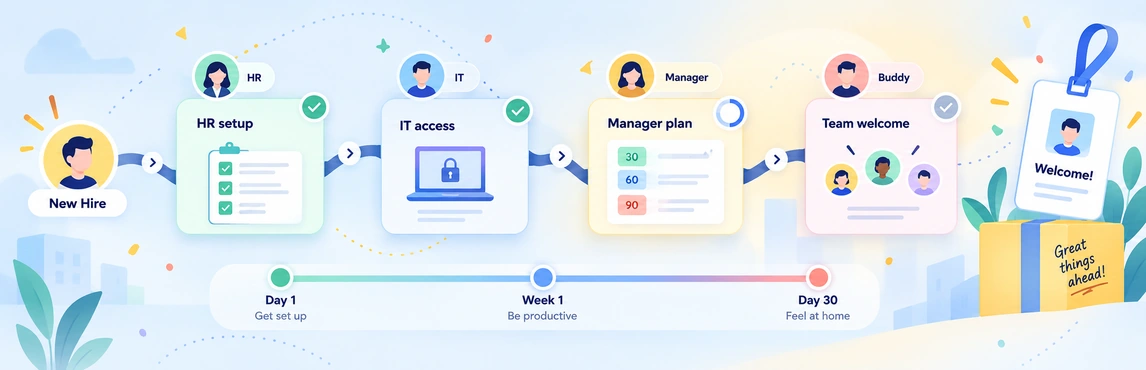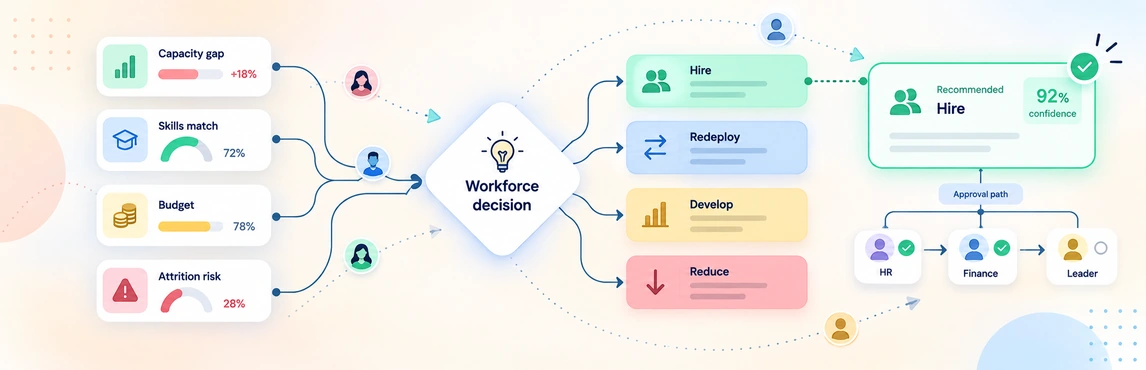
Most org chart tools let you draw boxes with names and titles. That works for simple visuals, but the moment HR needs to track performance ratings, compensation bands, flight risk, or succession readiness, those tools fall apart — pushing teams that manage real people data back into spreadsheets.
We built field packs to fix this. Instead of a flat org chart with a name and a title, Creately Atlas provides 201 built-in fields organized into 15 packs. You start simple — name, title, department, hire date — and activate additional packs as your needs grow. The HR generalist sees 40 fields. A user with the required access can activate additional packs. Nobody sees fields they shouldn’t.
Field packs bring related HR data into the org chart with consistent names and sensitivity tiers. This guide explains how it works, what’s in each pack, and how the sensitivity model keeps compensation data invisible to anyone who shouldn’t see it.
What Are HR Org Chart Field Packs?
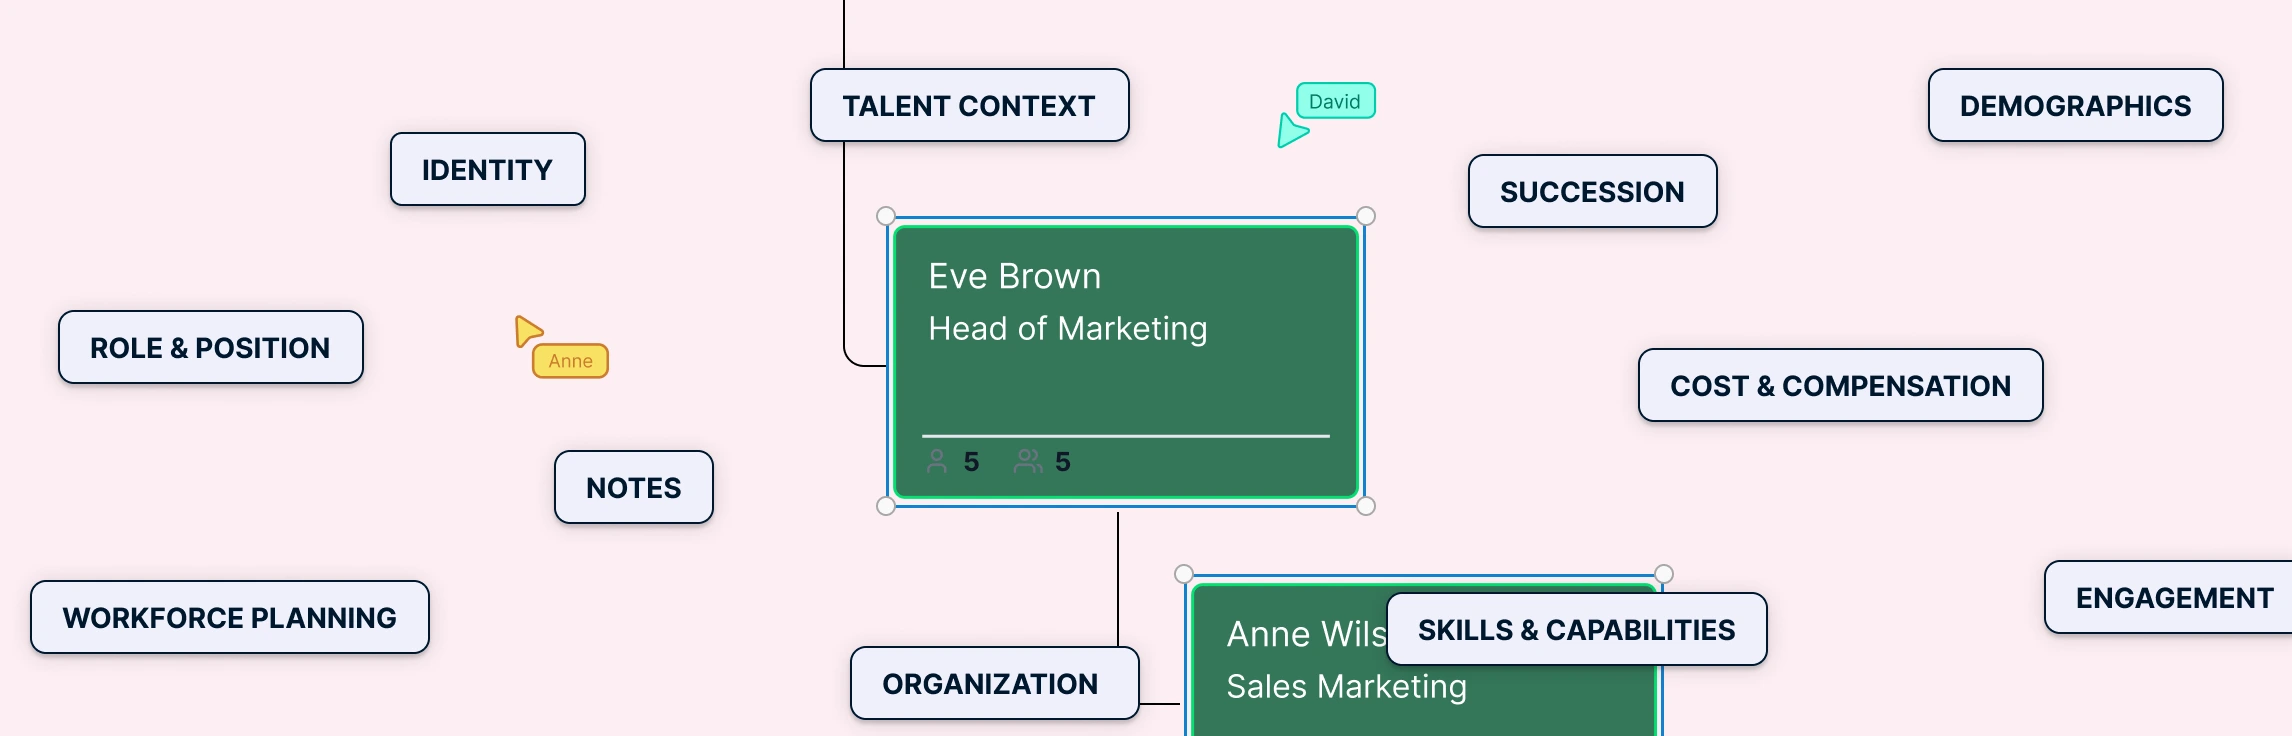
HR org chart field packs are pre-configured bundles of related fields for people, positions, departments, teams, projects, and role profiles. Think of them as a plugin system for HR data: when you activate a pack such as Compensation, every person card gains the relevant fields (salary, compa‑ratio, pay grade, bonus target, equity). Deactivating a pack hides its fields without deleting data, while separate sensitivity tiers determine which users can access those fields.
Why field packs instead of custom fields? Consistent field names make shared analysis easier. For example, teams might otherwise create “Salary”, “Base Pay”, and “Annual Comp” for the same value. Duplicated fields make comparison harder. Packs group related attributes with consistent names, types, and sensitivity tiers, while custom fields capture additional organization-specific information.
Packs apply to both person objects (current employees) and position objects (budgeted headcount). This distinction matters for workforce planning: you can model future positions with compensation bands before anyone is hired into them.
The 15 Field Packs for Organizational Charts
Here are the available organizational chart data field packs. You don’t need to enable all of them — most teams start with 2–3 and add more over time.
| Pack | ~Fields | Best For | Key Fields |
|---|---|---|---|
| 1. Base | 16 | Everyone | Name, title, department, photo, email, employee ID, join date, departure date |
| 2. Organization | 12 | People Ops | Location, cost center, division, legal entity, business unit, region, work arrangement |
| 3. Role | 12 | HR and org designers | Job family, job level, band, management level, FLSA status, EEO category |
| 4. Talent | 13 | Authorized managers and HR | Performance rating, potential assessment, 9-box placement, flight risk, development plan status |
| 5. Compensation | 12 | HR Confidential access | Salary, compa-ratio, pay range min/mid/max, bonus target, equity grant, merit increase |
| 6. Skills | 11 | Project managers | Skills inventory, certifications, technical skills, skill level, years of experience, education |
| 7. Workforce | 15 | Workforce planners | FTE, worker type, contract dates, retirement eligibility, notice period, work permit |
| 8. Succession | 12 | HR Restricted access | Readiness, bench strength, successor count, emergency successor, development actions, critical role |
| 9. Demographics | 11 | Sensitive PII access; aggregate reporting only | Gender, ethnicity, age group, veteran status, disability status, nationality |
| 10. Engagement | 10 | Authorized managers and HR | Engagement score, eNPS, manager rating, survey participation, pulse score trend |
| 11. Department | 16 | Department planning | Headcount, target headcount, budget, attrition rate, vacancy rate, cost per headcount |
| 12. Position | 19 | Position planning | Incumbent, vacancy date, position status, job grade, pay band, requisition ID |
| 13. Team | 10 | Team leads | Team type, max size, member count, team lead, status, formation date, charter |
| 14. Project | 15 | Project managers | Project type, status, budget, skills needed, timeline, sponsor, staffing model |
| 15. Role Profile | 17 | Job architecture | Required and preferred skills, pay grade, career path, competency model, experience range |
The product guide lists 201 built-in fields across 15 packs, with custom fields available for additional organization-specific data.
Progressive Disclosure: Start Simple, Scale Up
This is the design principle that makes 201 fields usable instead of overwhelming.
Day one:
Base, Organization, and Role are always active. They provide identity, organizational context, and role classifications. Together they contain 40 fields, with visibility controlled by access permissions. Card settings determine which permitted fields appear.
Month two:
Your HRBP asks for performance data during talent reviews. You enable the Talent and Succession packs. Suddenly the same org chart can show 9-box placement, flight risk, and succession readiness — but only for users with the right access tier. Each reviewer sees only fields permitted by their access tier.
Quarter two:
The Compensation Director needs pay equity analysis. Enable the Compensation pack. Heatmap by compa-ratio. See who’s above and below range across the entire org in one view. The Compensation Director sees salary data; a department manager viewing the same chart sees nothing — the fields don’t exist in their view.
This is what we mean by progressive disclosure: the system grows with your HR maturity. You can activate the packs needed for your workflow. You see exactly the fields that matter for your role and your current task.
The practical benefit is that teams can review relevant talent, workforce, or compensation data alongside the org structure. It’s the same visual workspace — it just gets smarter as you activate more packs.
The 6-Tier Data Sensitivity Model
Not all org chart data is equal. A person’s name is public. Their salary is not. We built a 6-tier sensitivity model that controls who sees what — and critically, unauthorized users don’t see locked fields or grayed-out placeholders. The fields simply don’t exist in their view.
| Tier | Who Sees It | Example Fields |
|---|---|---|
| 1. Public | Everyone in the org | Name, title, department, photo |
| 2. Internal | Users granted Internal access | Email, phone, hire date, work arrangement |
| 3. Manager | Authorized direct managers and HR | Performance rating, potential assessment, engagement score |
| 4. HR Restricted | HR team broadly | Succession risk, flight risk, readiness assessment |
| 5. HR Confidential | HR Directors + CHRO | Salary, bonus target, compa-ratio |
| 6. Sensitive PII | Authorized CHRO and Legal users; aggregate reporting only | Demographics, disability status, veteran status, nationality |
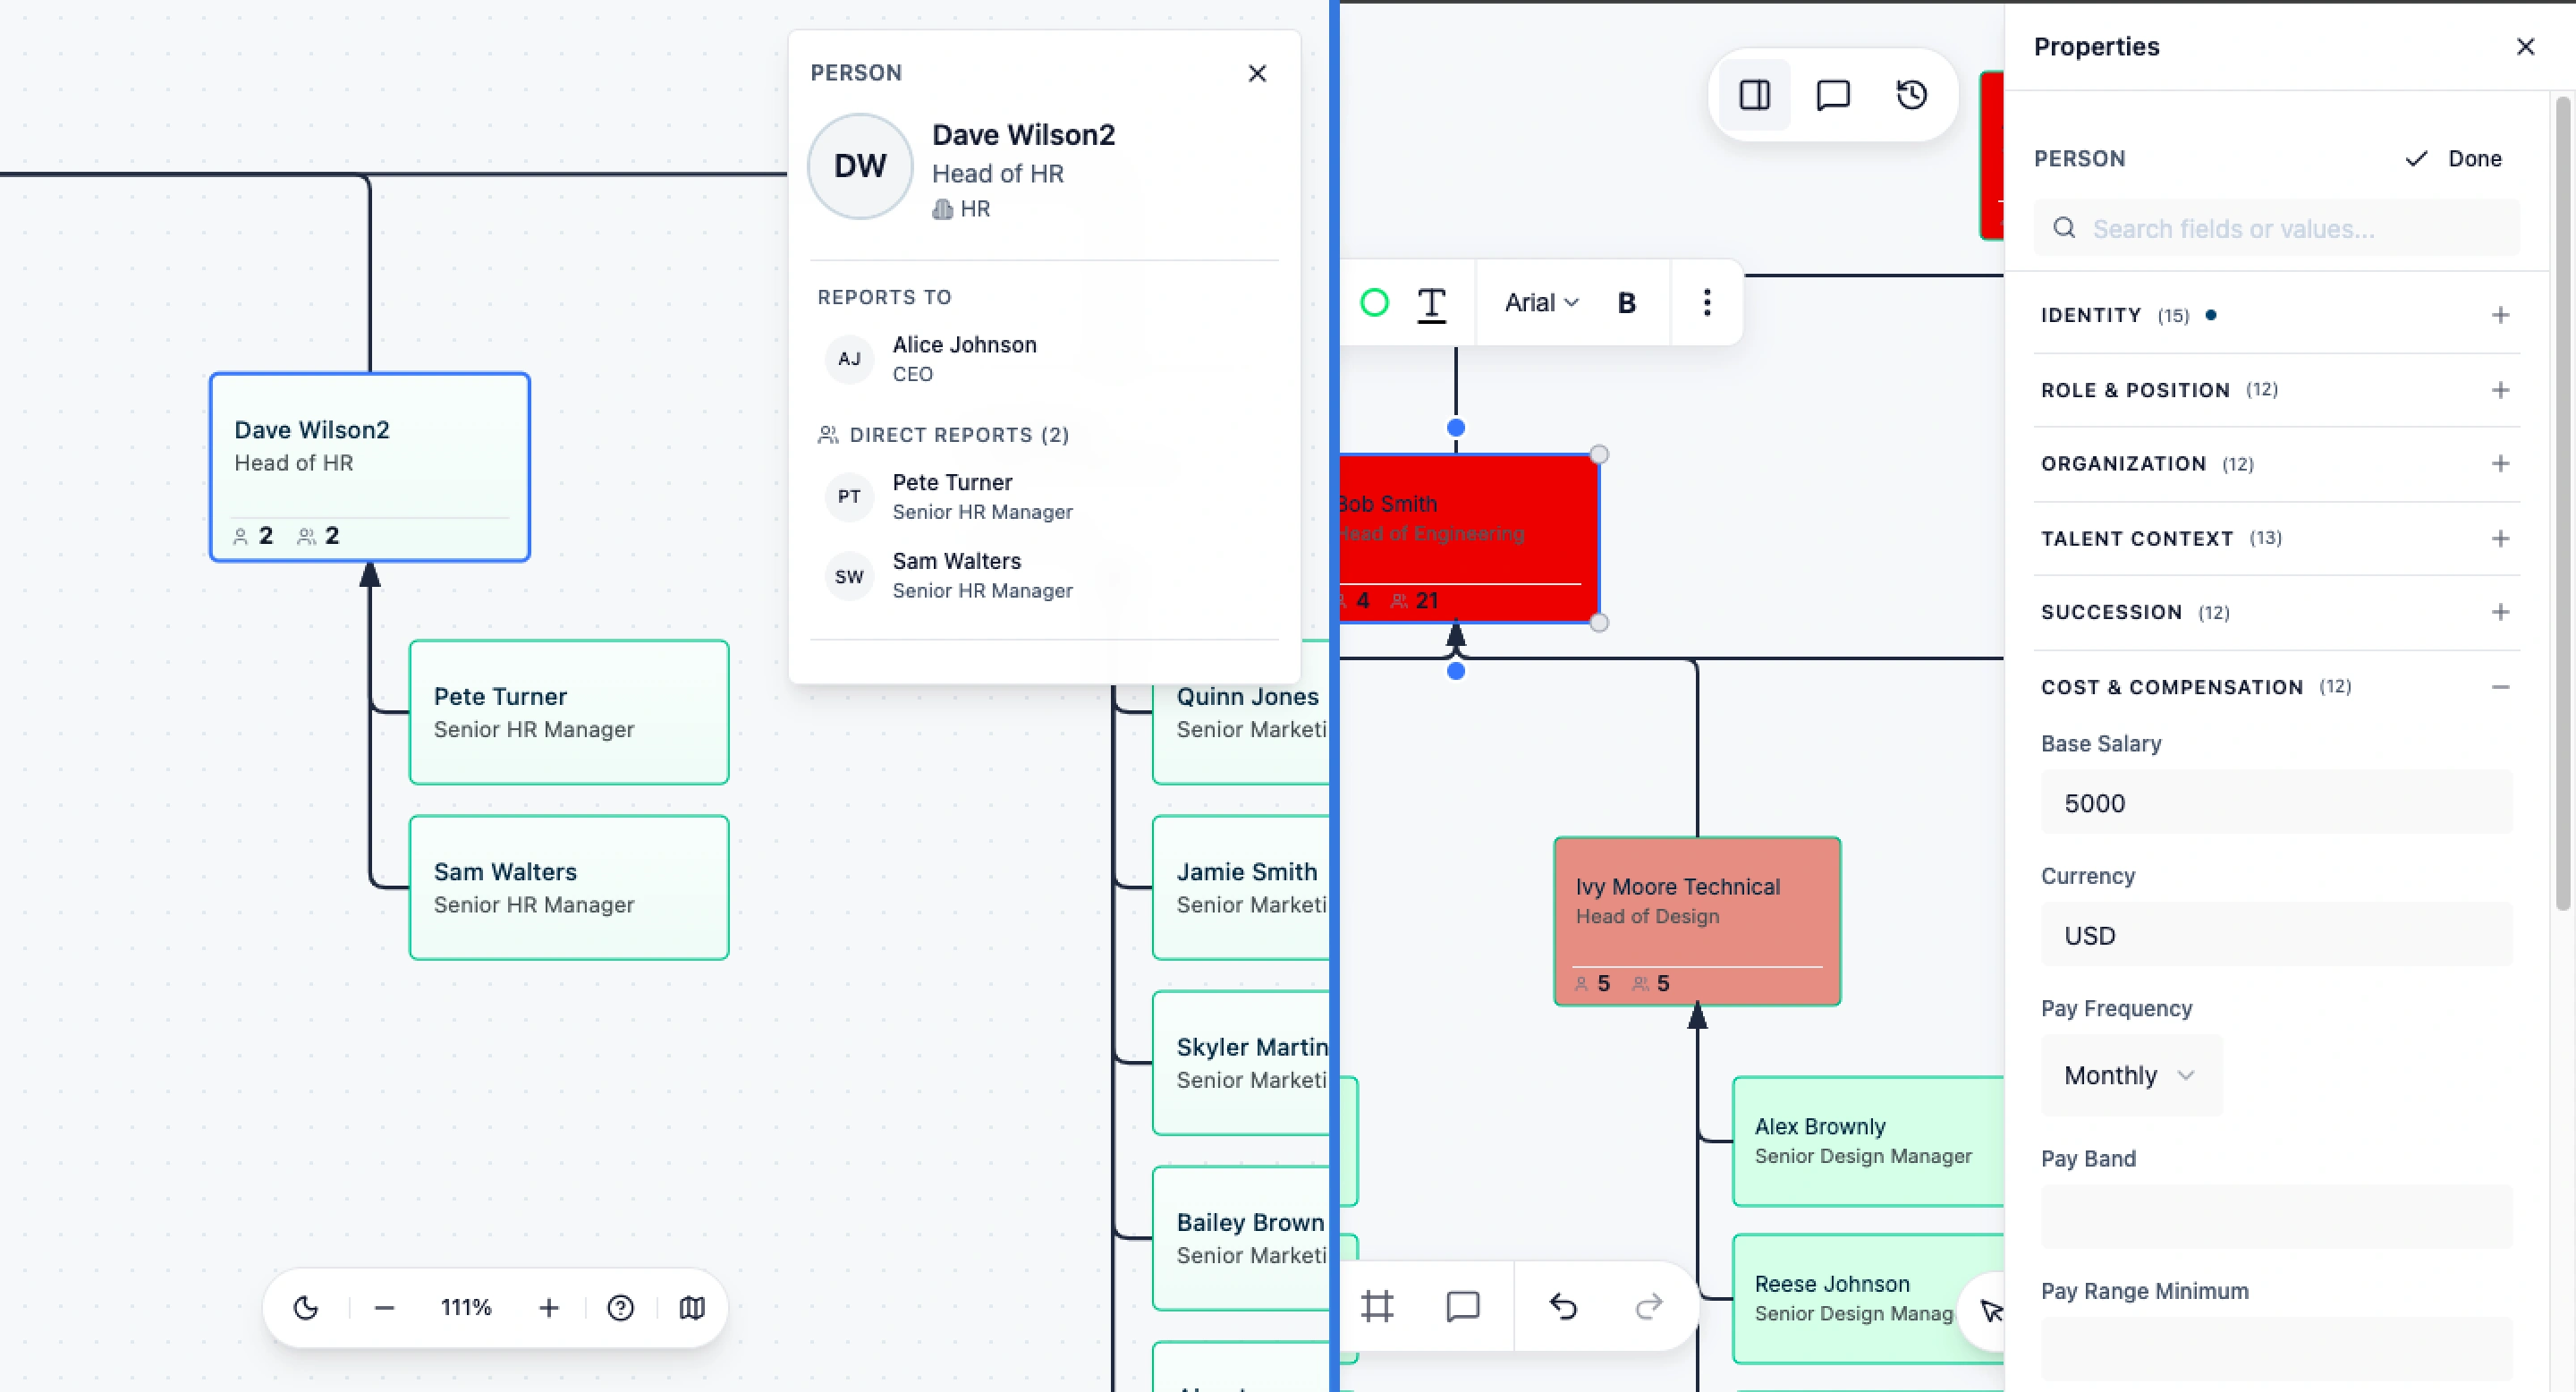
Why this matters in practice: Separate copies for employees, managers, HR, and compensation reviewers can become difficult to maintain. Each role change may require several updates. Atlas applies field-level access to a shared org model, so reviewers see only the data their permissions allow.
Field-level controls support restricted sharing. Your organization still needs its own data-handling and review policies. Verify each audience’s access before sharing or exporting sensitive planning information.
How to Activate Field Packs for Organizational Charts
If you want to move from a static org diagram to a live, queryable HR system, Creately’s free org chart software is built to support this workflow end‑to‑end — here’s how to activate field packs on your org chart.
Step 1: Open your org chart workspace
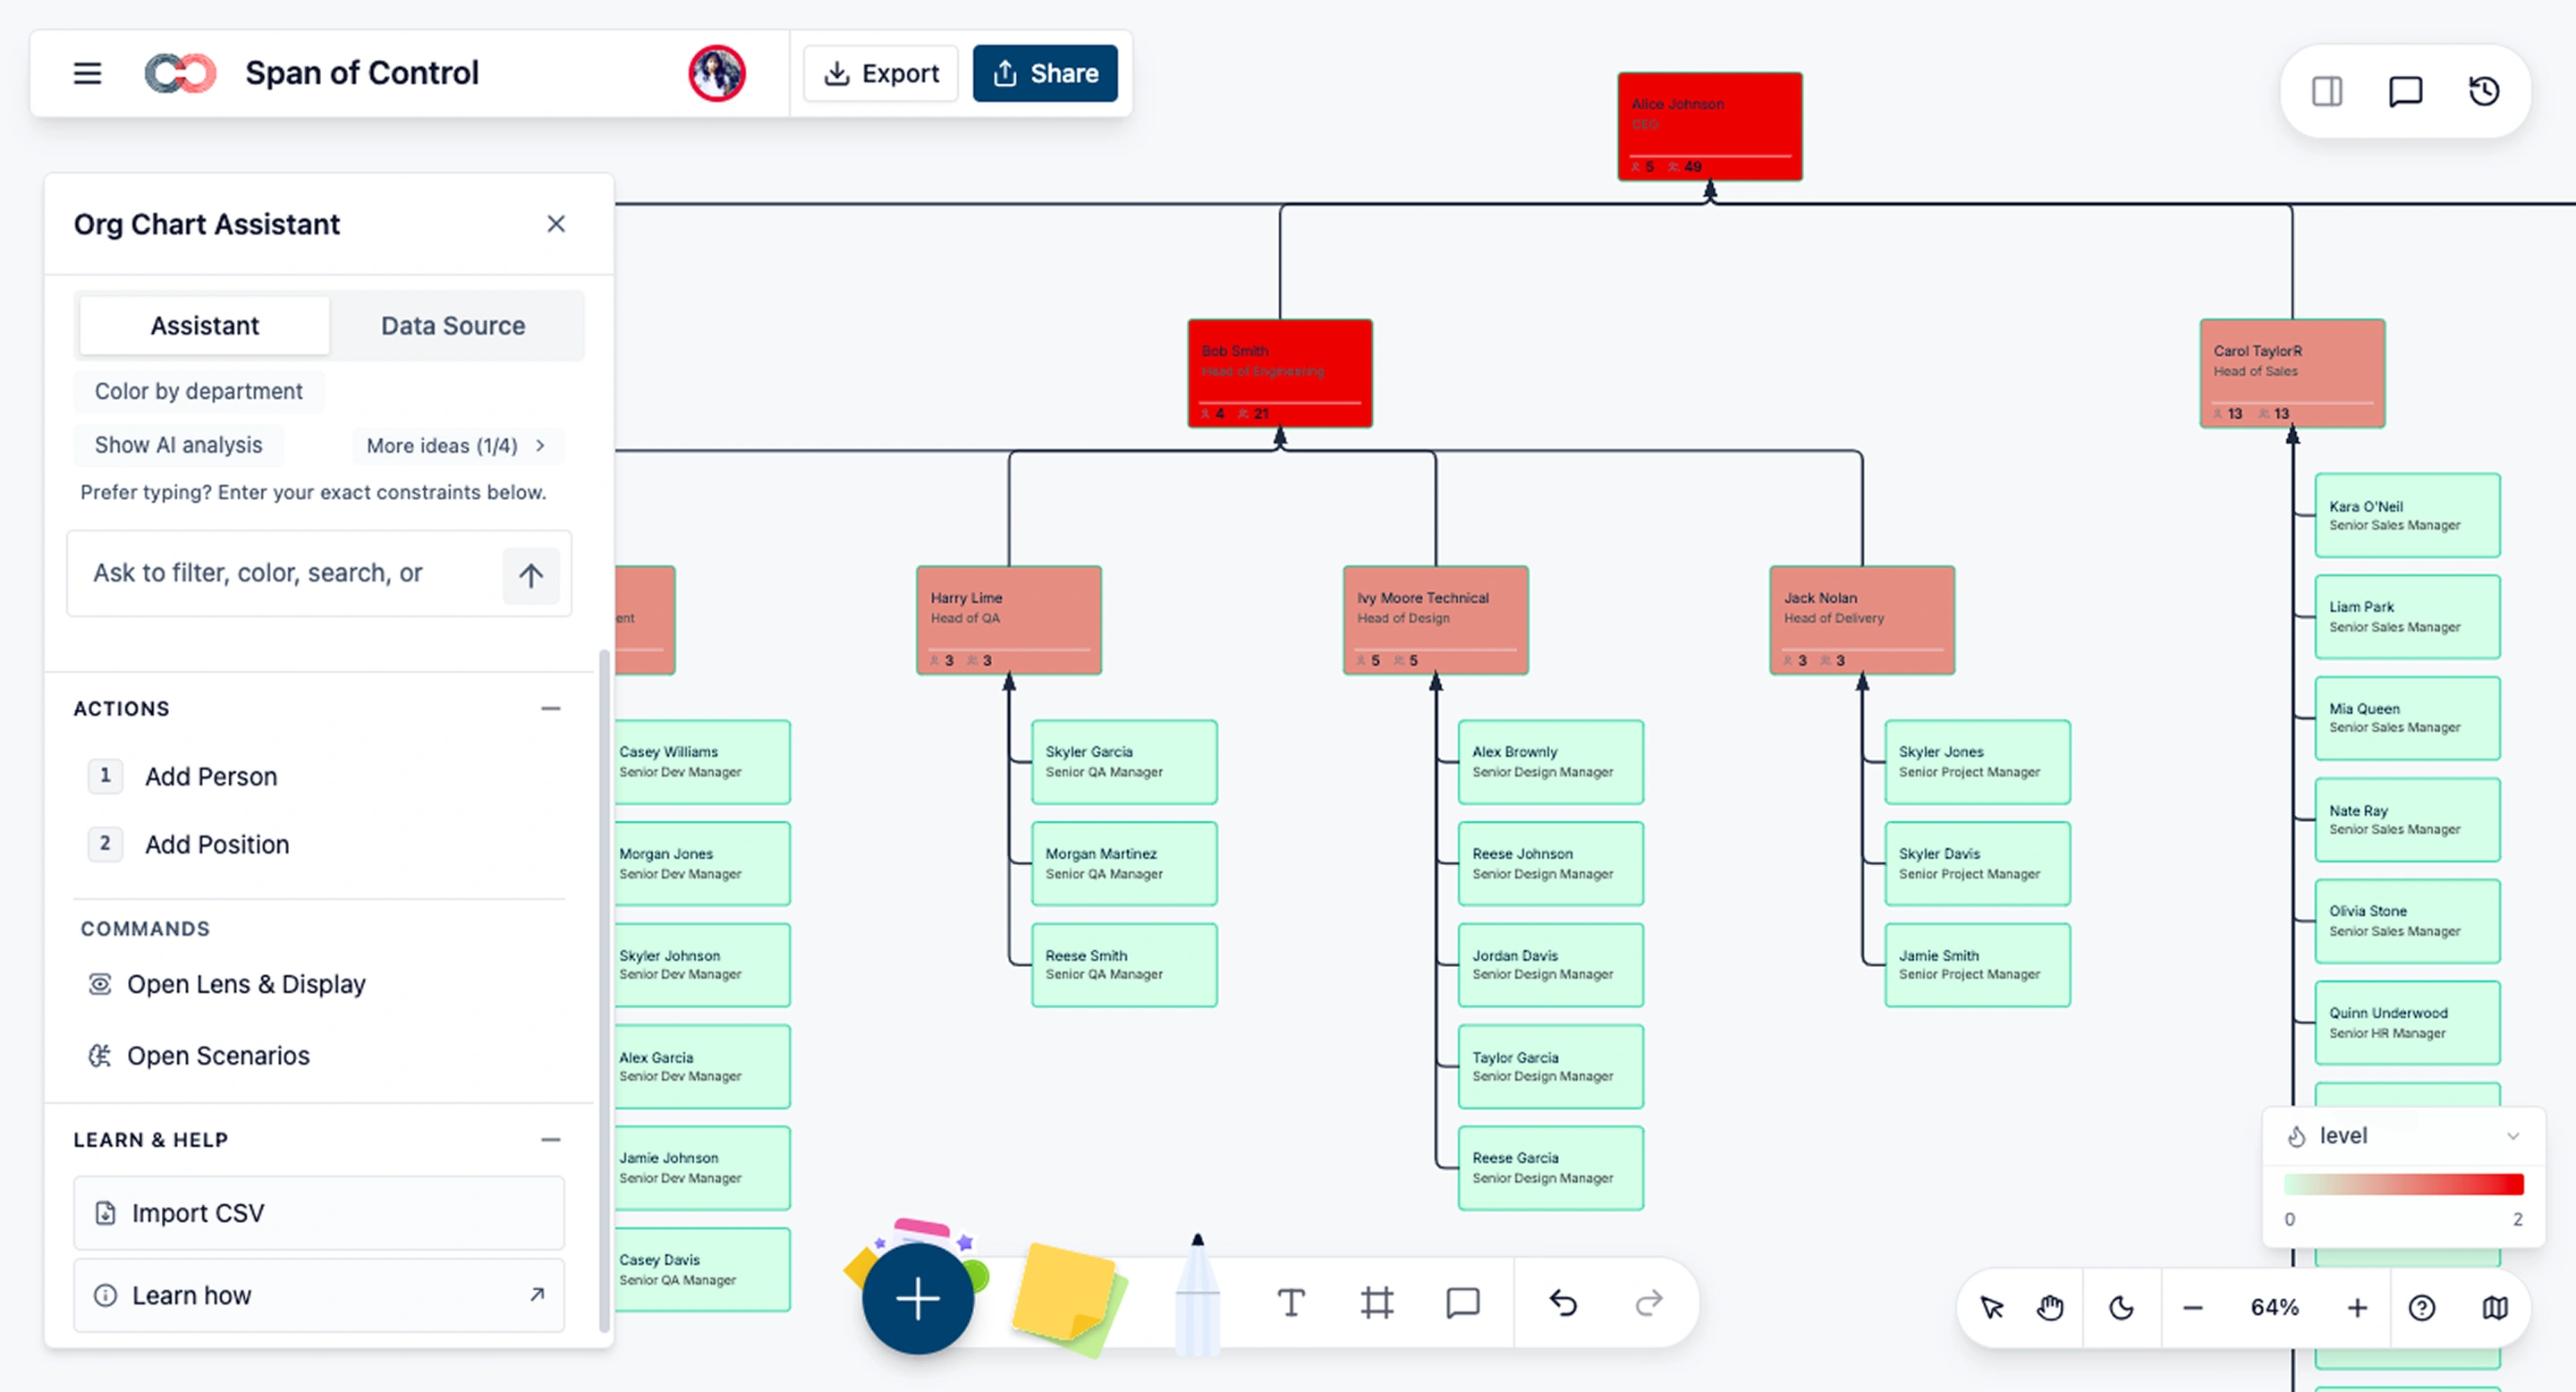
Start with an existing org chart or create a new one. Export HRIS, Excel, or Google Sheets data as CSV and review the suggested field mappings before import. Resolve validation issues before generating the org chart.
Step 2: Go to Field Pack Settings
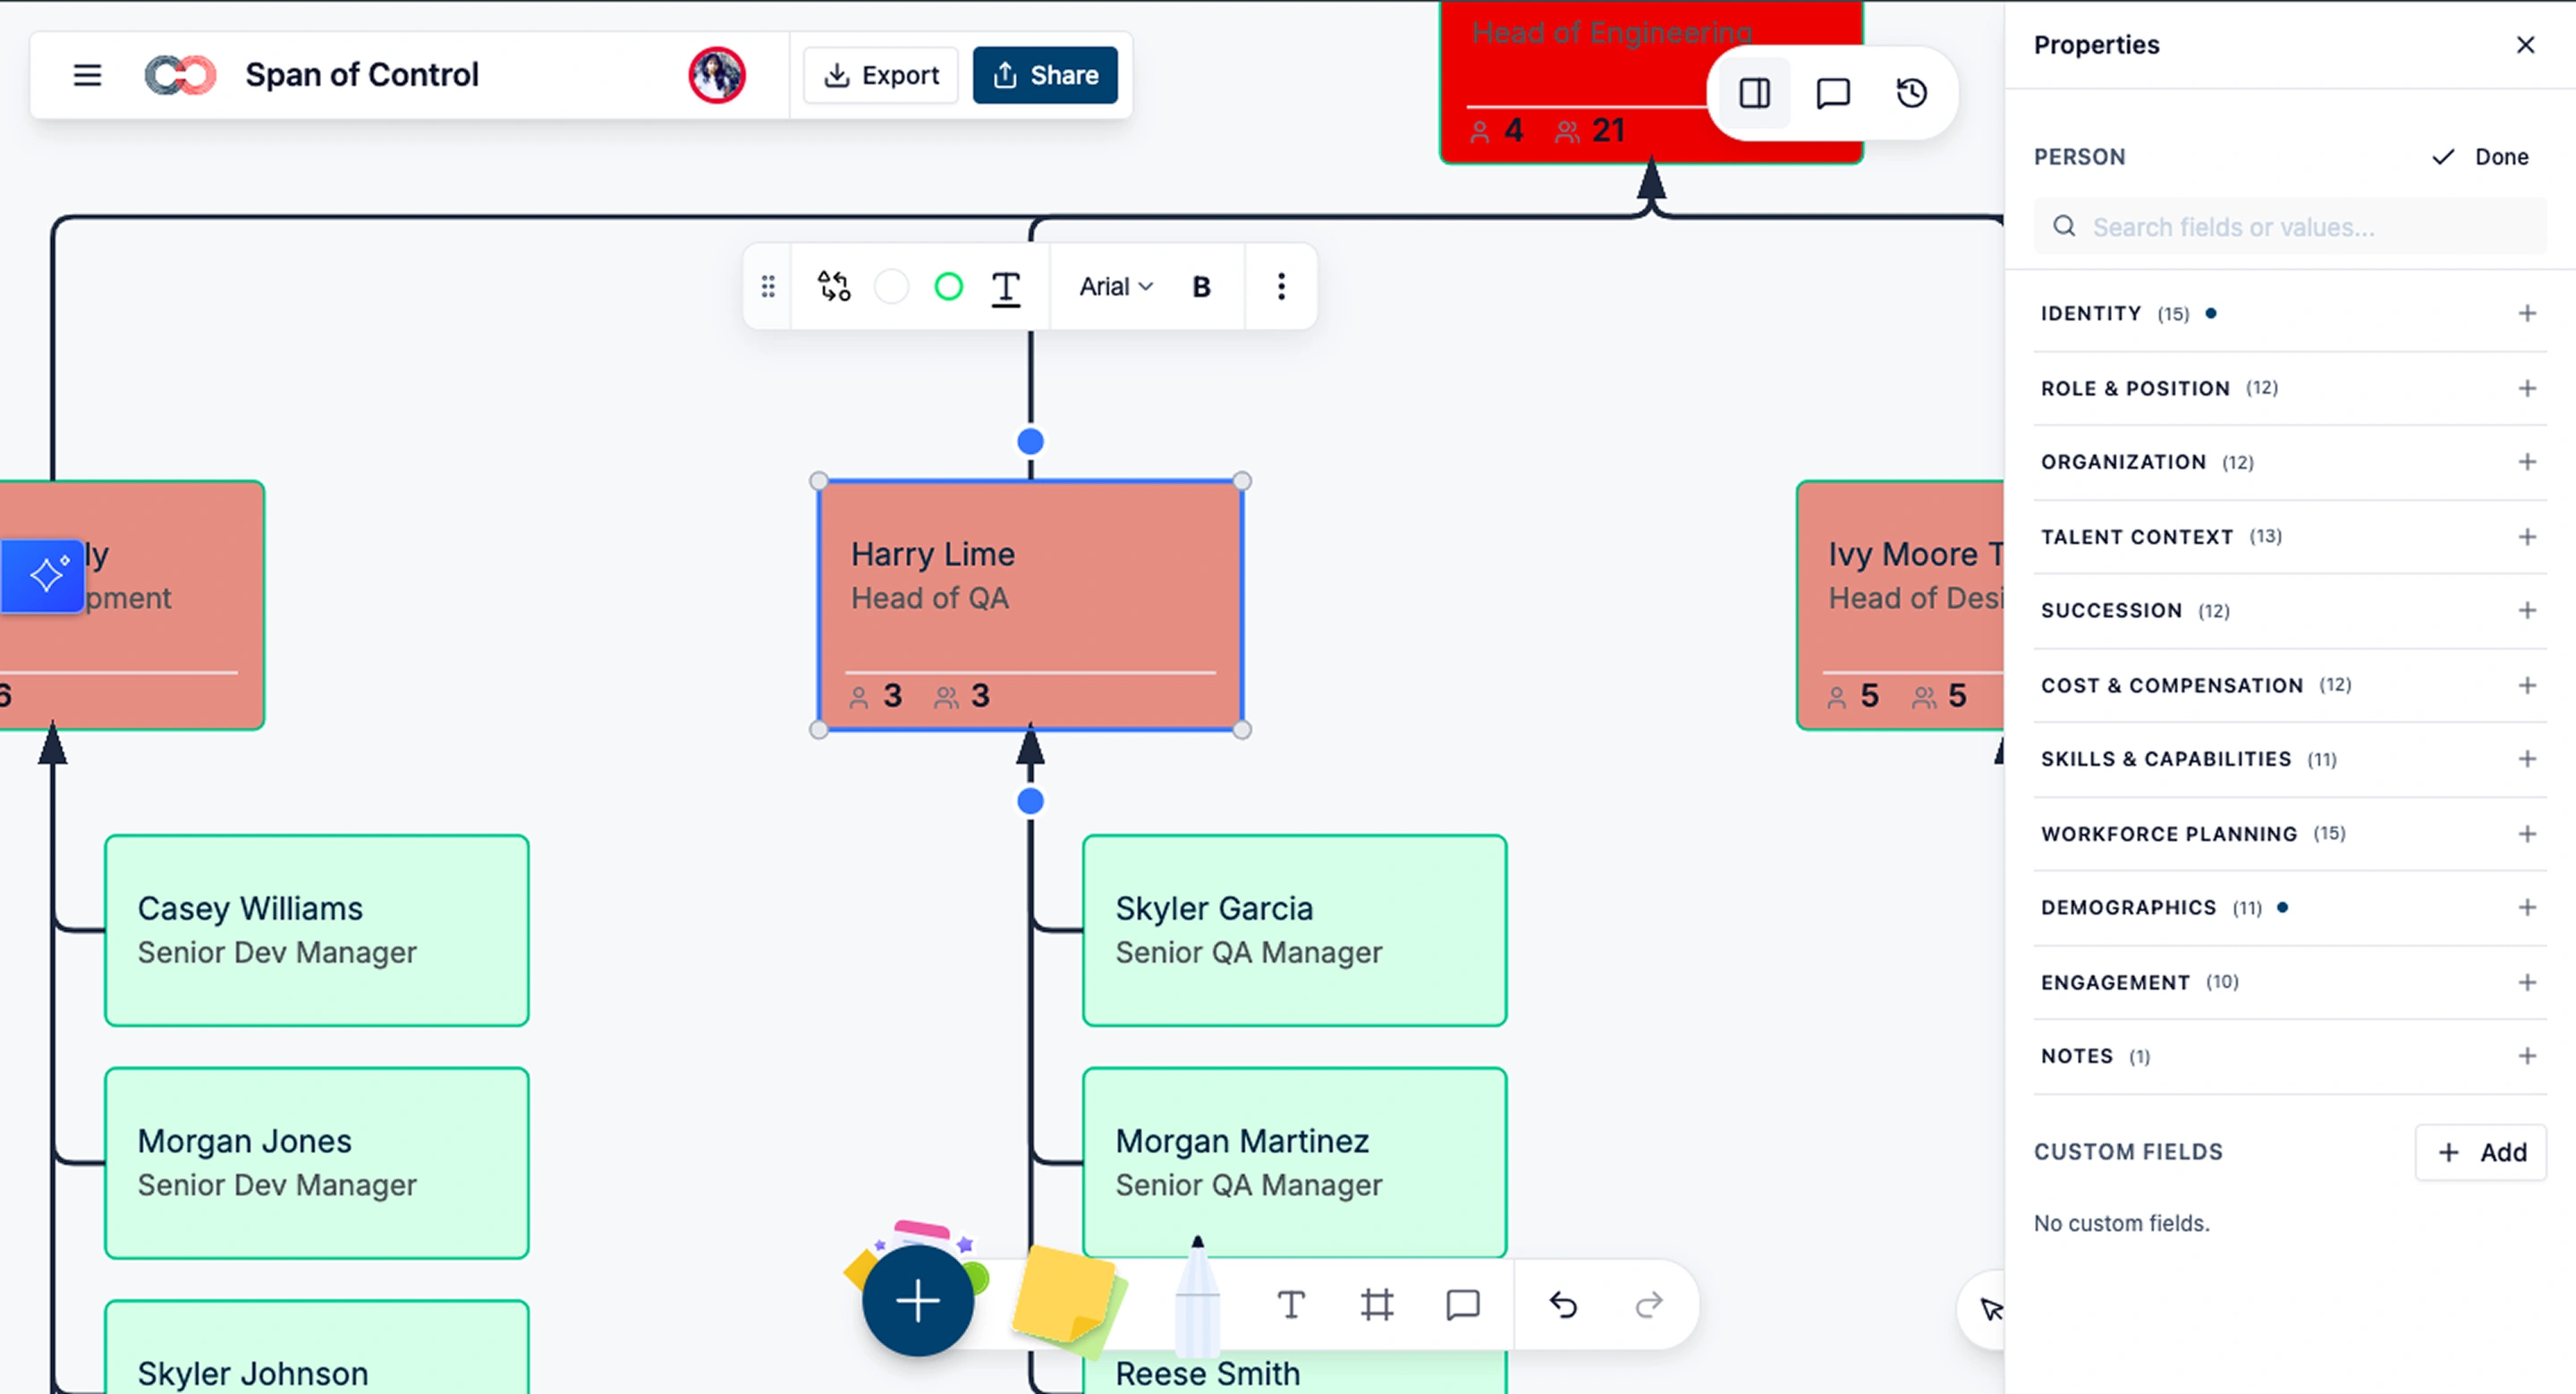
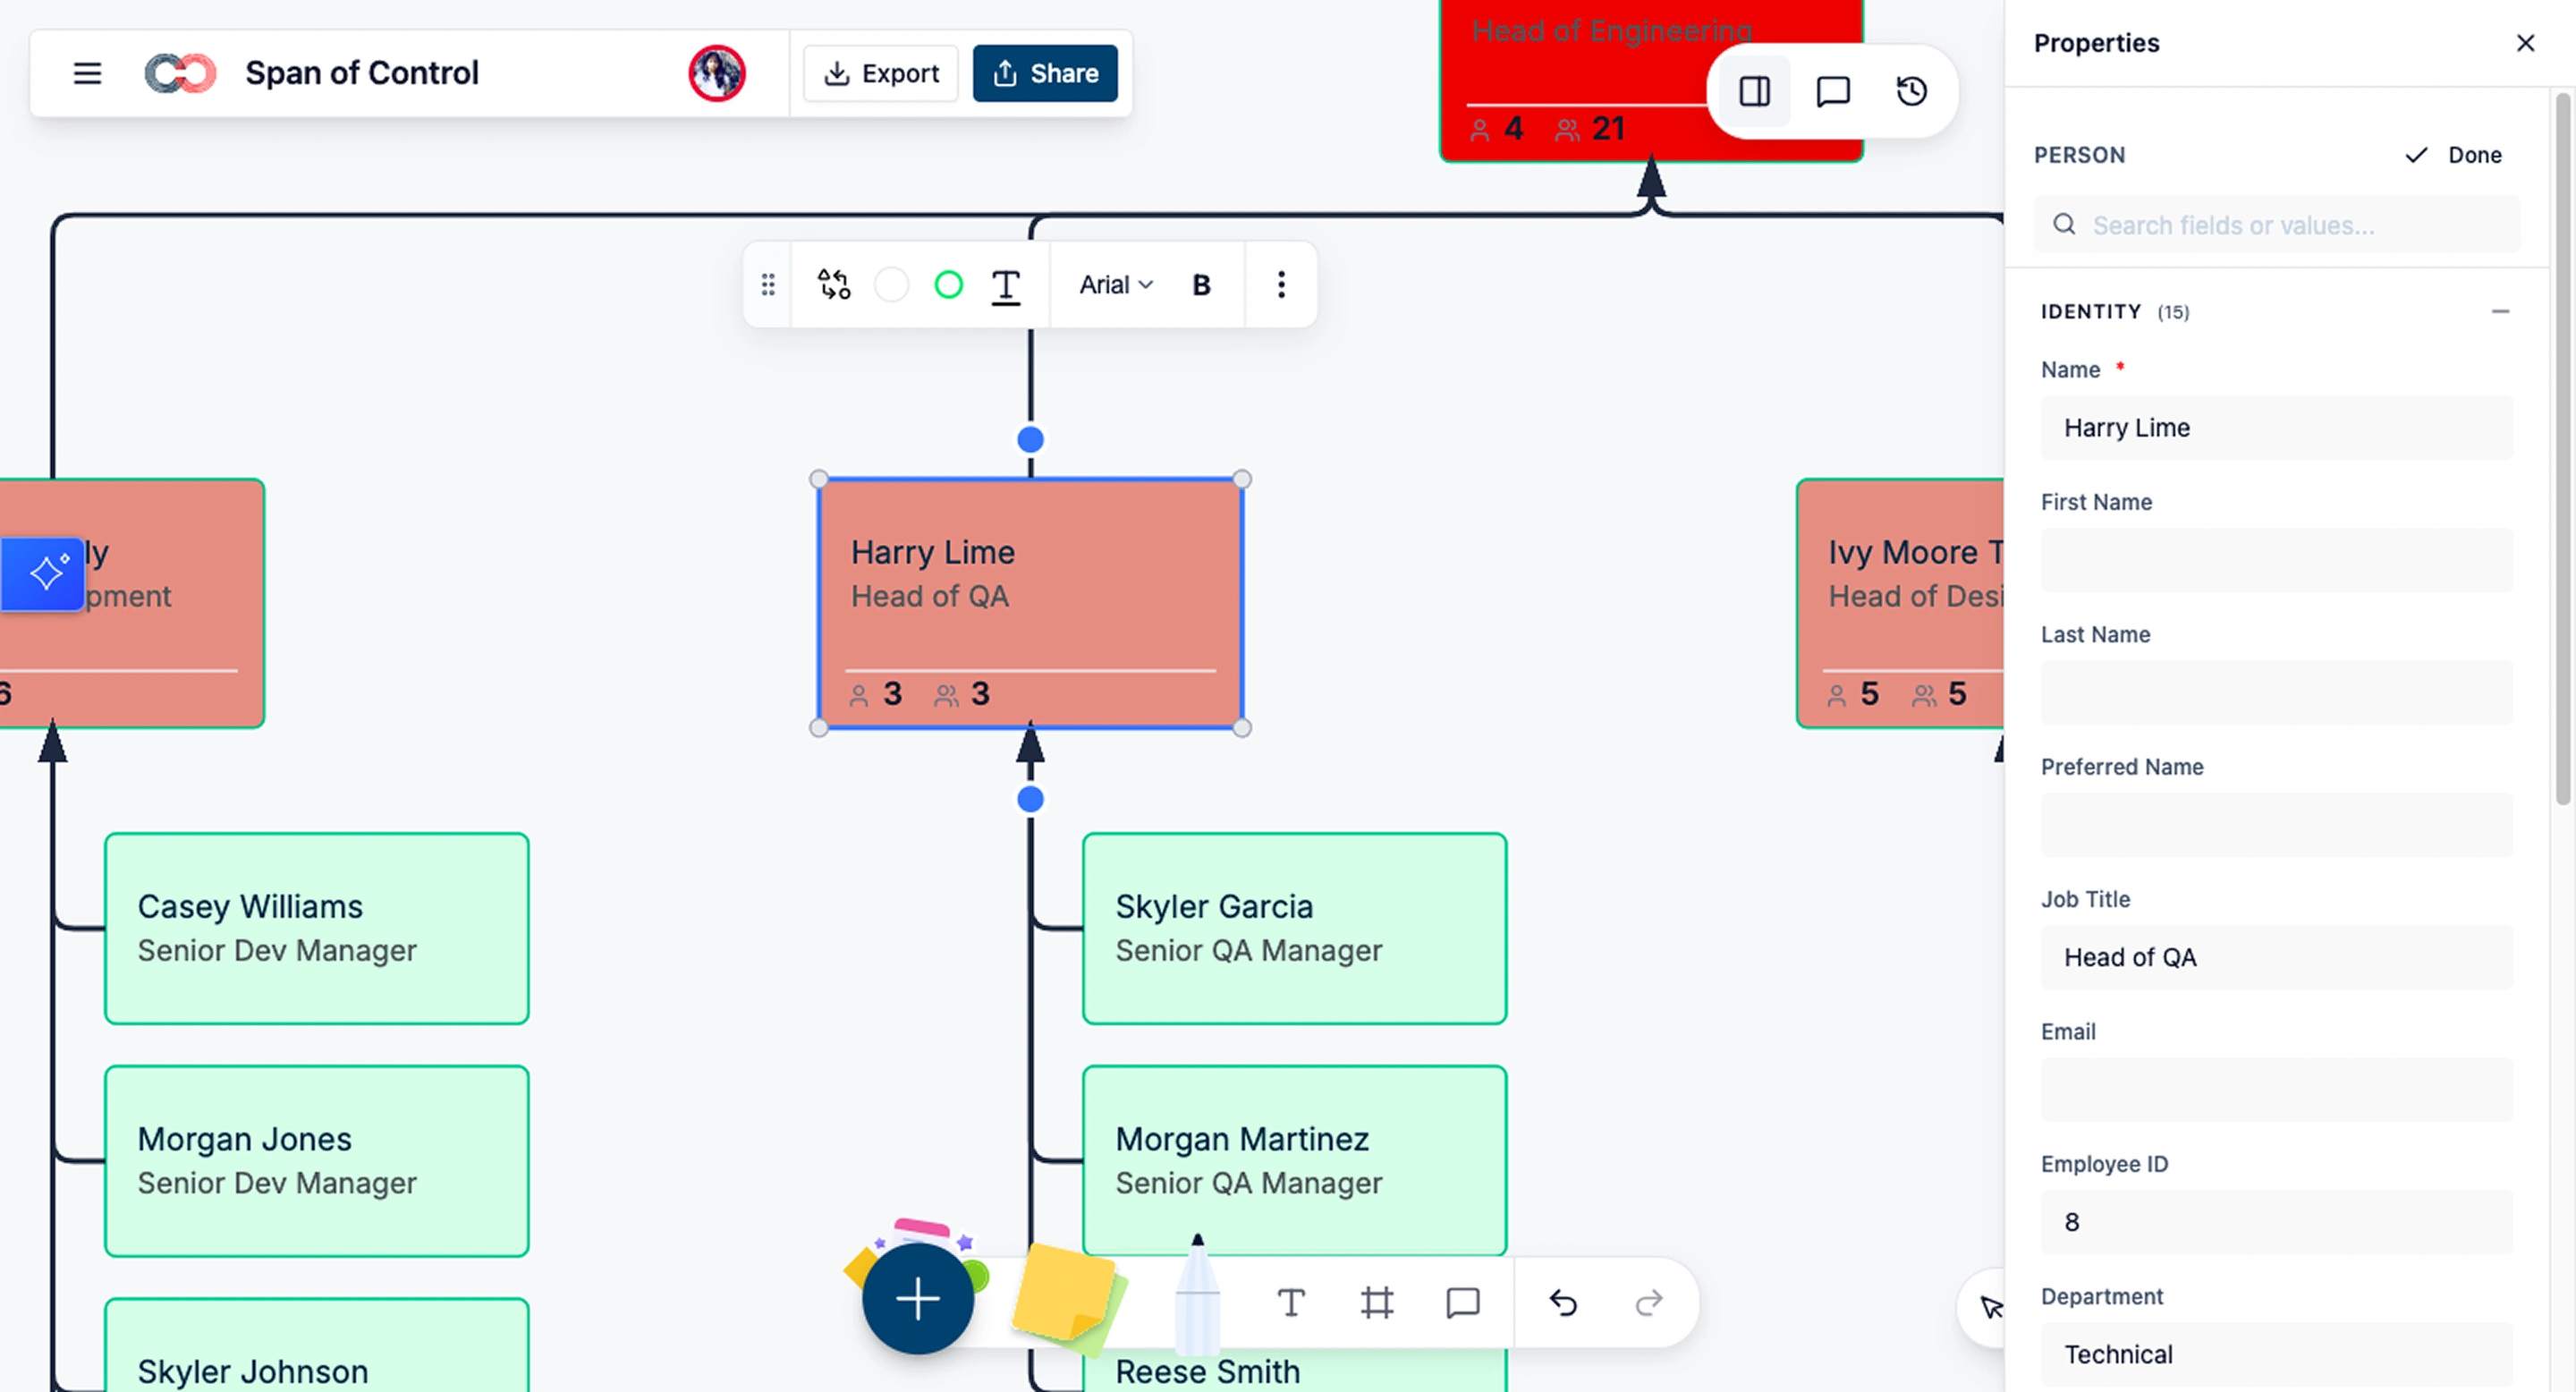
This is where field packs live. Open Field Management from the assistant panel or the “Add more fields” link in the properties panel to review each pack’s fields, sensitivity level, and supported use cases.
Step 3: Enable the packs that match your role
Start with the always-active Base, Organization, and Role packs. These give you a functional org chart with real data. Add Talent and Succession when preparing talent and succession reviews. Add Compensation when the merit cycle begins.
Step 4: Import employee data
Upload a CSV exported from your HRIS, Excel, or Google Sheets. Creately’s AI-powered column mapping reads your column headers and auto-matches them to field pack fields with confidence scores. “Employee Number” can map to Base → Employee ID. “Annual Salary” can map to Compensation → Salary. Review the suggestions, fix any mismatches, and import. The entire import is a single undoable action — Ctrl+Z reverts everything if something looks wrong.
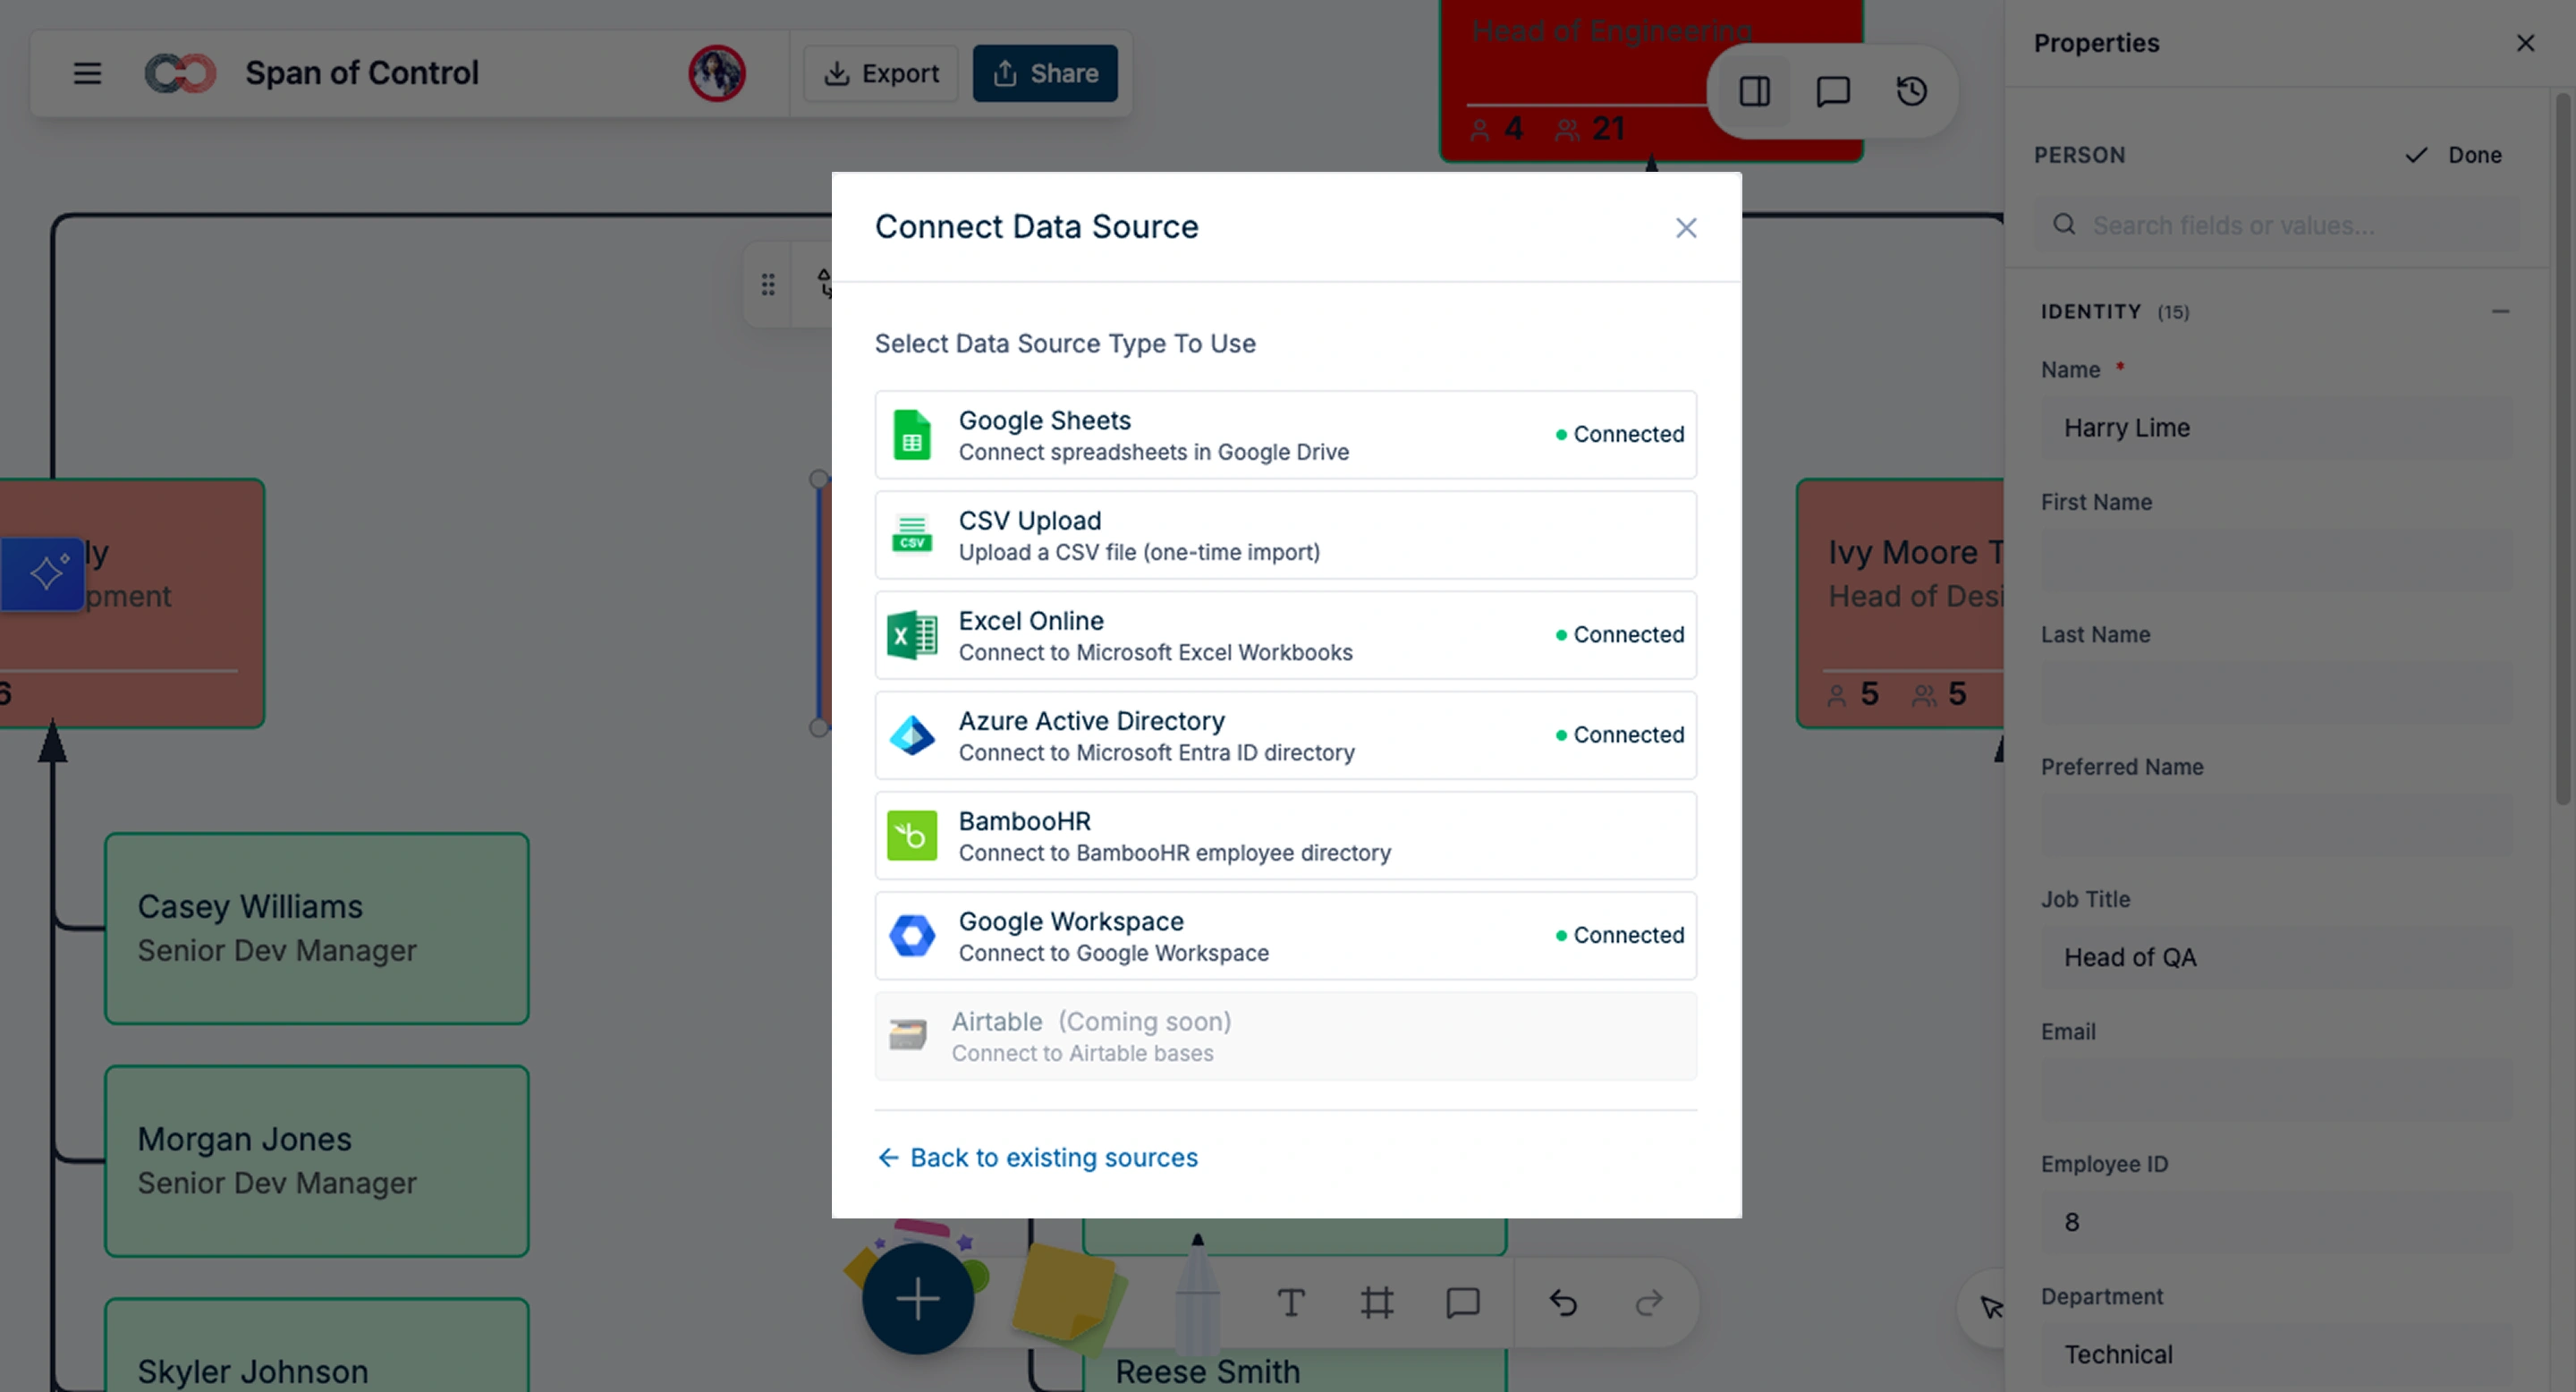
If you’re starting from a spreadsheet, see how to generate an org chart using spreadsheets for a step-by-step walkthrough.
Step 5: Set sensitivity tiers
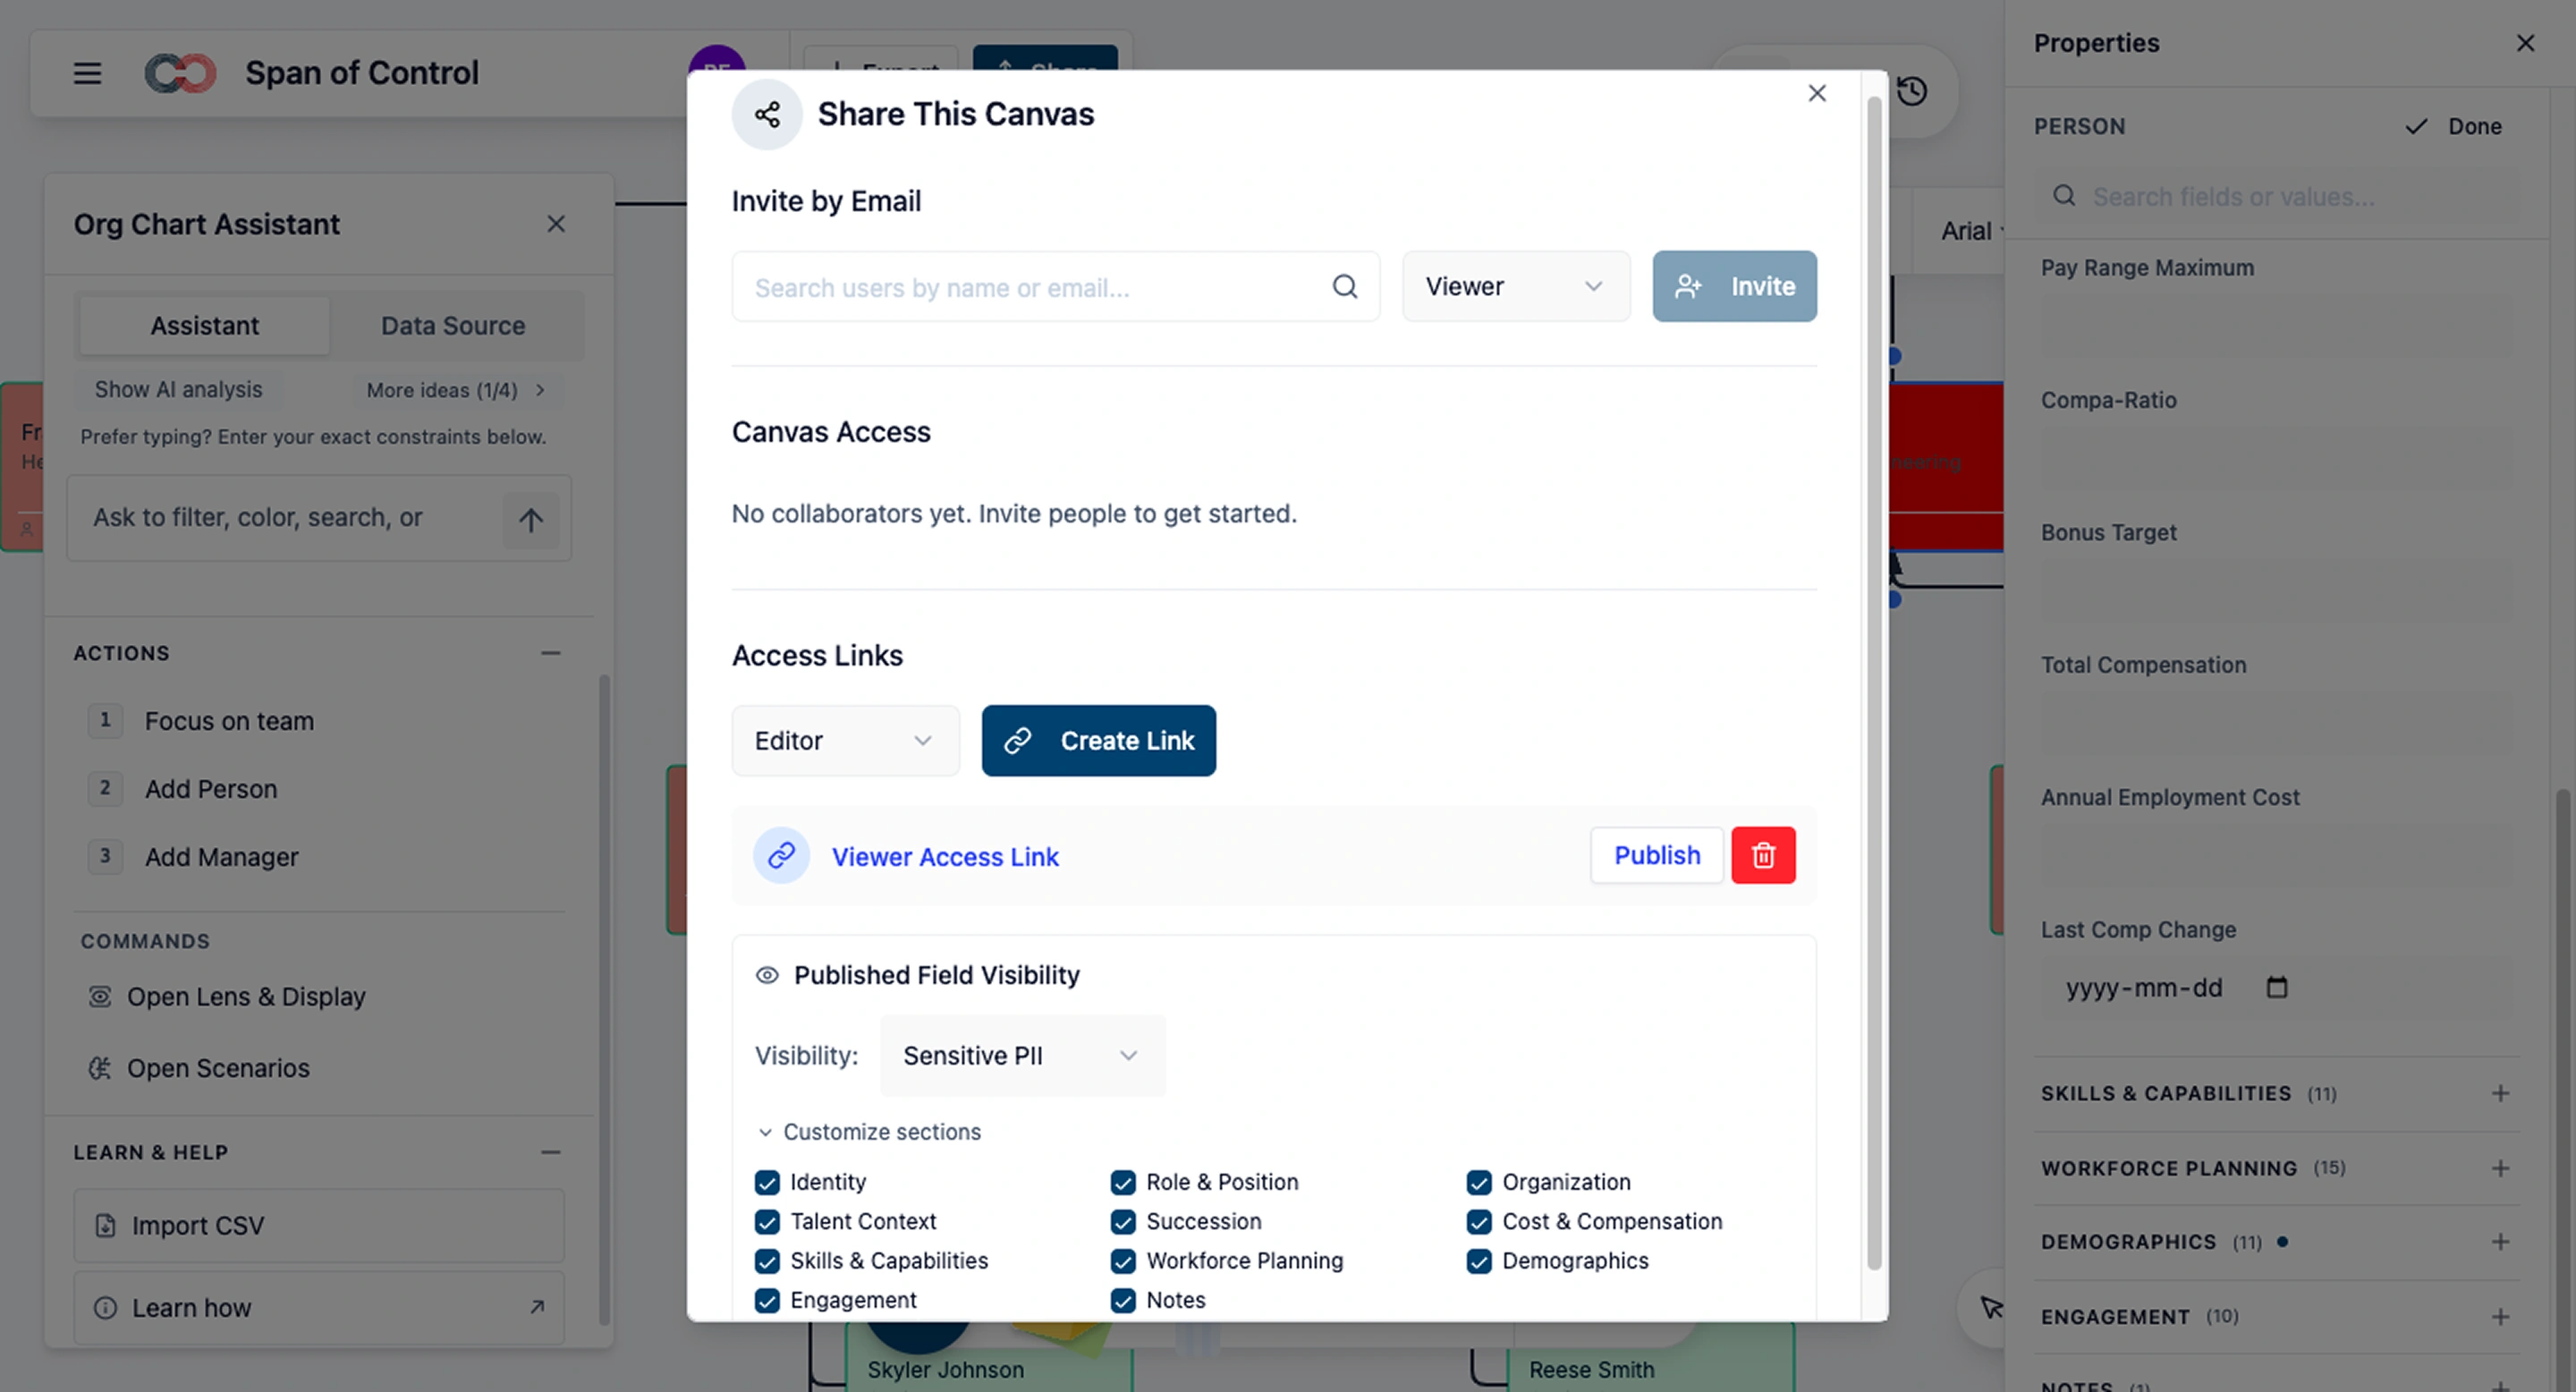
For each enabled pack, review which sensitivity tier its fields belong to. Compensation fields default to HR Confidential. Demographics default to Sensitive PII. You can adjust these, but the defaults are designed to be safe out of the box.
Step 6: Invite your team and verify
Share the workspace with a test user at each access level (employee, manager, HRBP, CHRO) and verify they see exactly the fields they should. For example, a department manager viewing the org chart sees performance ratings for their team but has no visual indication that salary or demographic fields even exist — those fields are completely invisible.
Common Workflows by Pack
HR Generalist (Base + Employment packs)
Maintain the org chart as people join, leave, and move. Onboard new hires by creating their node, importing their data, and sharing the updated chart with their manager. This is the “keep the lights on” workflow — fast, accurate, low overhead.
HRBP (+ Performance + Talent packs)
Run talent reviews using recorded performance, potential, and 9-box placement in the Talent pack, with Succession fields for role-specific readiness. Color the org chart by 9-box placement or flight risk. Walk into a conversation with a department head and say “here are your 3 highest-risk people and here’s the development gap for each one” — with the data right on the chart, not in a separate spreadsheet.
Compensation Director (+ Compensation pack)
Pay equity audits become visual. Enable the Compensation pack, heatmap by compa-ratio, and instantly see who’s above, at, or below range across the entire org. Filter by department + pay grade to isolate comparison groups. Model merit increases as scenario updates and compare total cost impact before committing.
CHRO (all packs)
Full organizational intelligence. Succession risk visualization: color positions by bench strength (no successor, weak pipeline, strong pipeline). In practice, a CHRO can instantly surface leadership gaps by filtering the org to show only roles with no successor, then reviewing bench strength before a board review or reorg discussion.
Workforce planning: use Position, Workforce, Department, and permitted Compensation fields to model future headcount and cost assumptions. Before approving a hiring plan, finance and HR can add unfilled position objects with target salaries and start dates, then compare total headcount cost across multiple scenarios.
DEI dashboards: Demographics pack with Sensitive PII access for aggregate‑only leadership reporting.
For a deeper walkthrough, see our succession planning and workforce planning guides.
Finance VP (+ Workforce Planning + Department packs)
Headcount budgets by department, location, and band. Model reorg cost impact with scenario planning. Contractor conversion analysis: filter by worker type + contract end date to see which contractors need conversion decisions this quarter.
Field Packs vs Custom Fields in Other Tools
| Dimension | Creately Field Packs | Custom Fields (ChartHop, OrgVue, etc.) |
|---|---|---|
| Governance | Curated packs with consistent naming, types, and sensitivity tiers | Verify naming conventions, validation, and ownership of custom fields |
| Progressive disclosure | Enable packs per role; fields invisible until activated | Test which fields each user can see and how visibility is configured |
| Sensitivity model | 6-tier model built into the architecture; fields vanish for unauthorized users | Test restricted-field visibility with representative user accounts |
| Maintenance cost | Review built-in packs together and maintain custom fields as needed | Compare administration effort for your field set and review cycle |
| Import mapping | Reviewed AI-assisted column mapping from CSV exports of spreadsheets or HRIS data | Request a demonstration using your own column names and data |
The fundamental difference: field packs are opinionated. They encode best practices about which fields belong together, what data types they should use, and who should see them. Custom fields capture organization-specific details alongside the built-in packs. For teams scaling past 100 people, the governance advantage of packs compounds quickly.
Free Org Chart Templates to Get Started
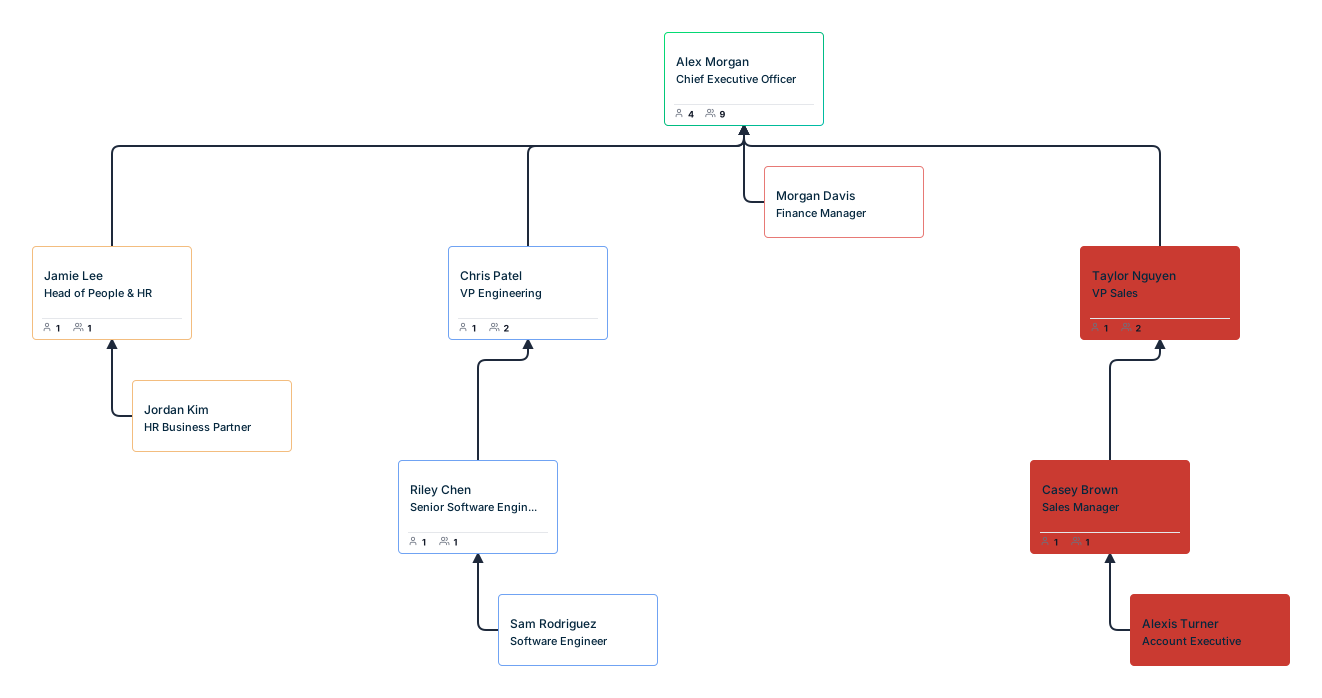


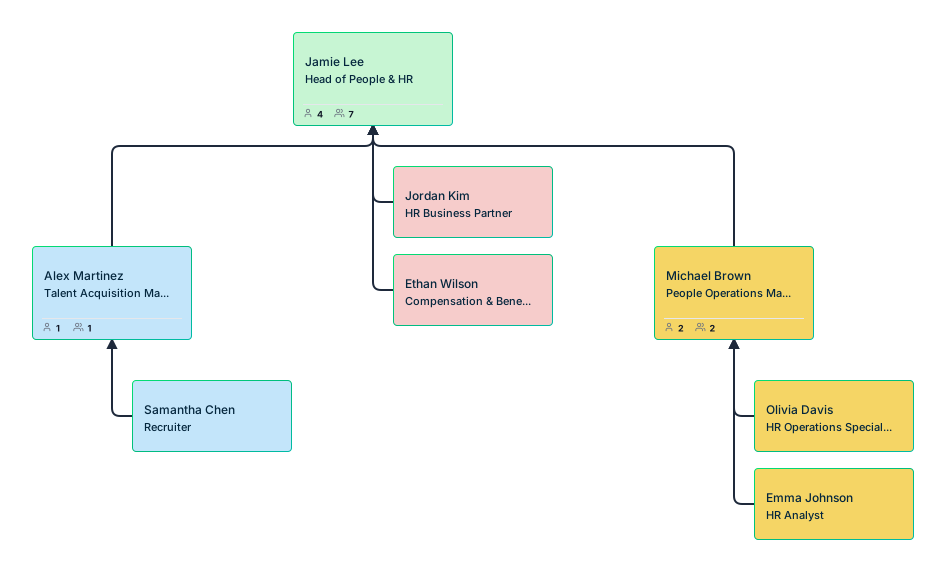
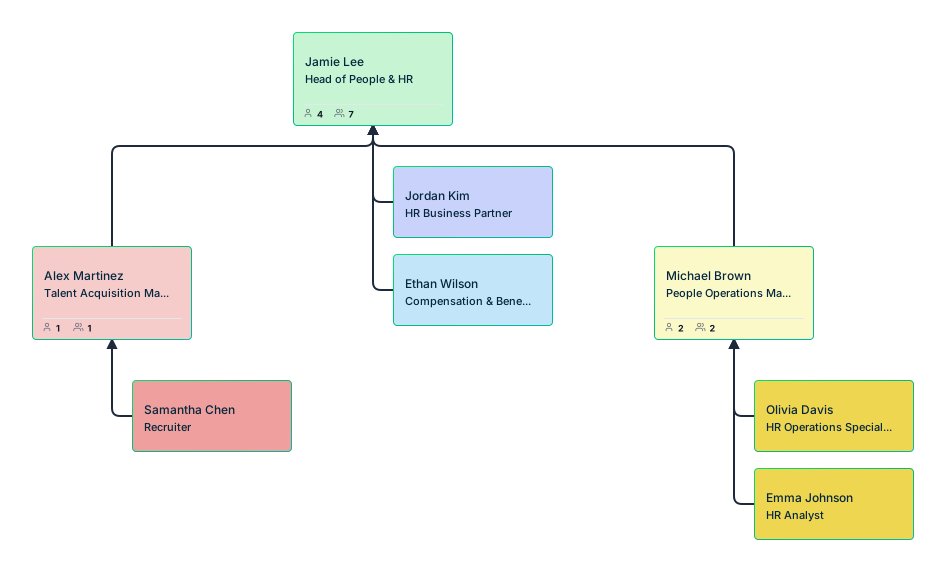
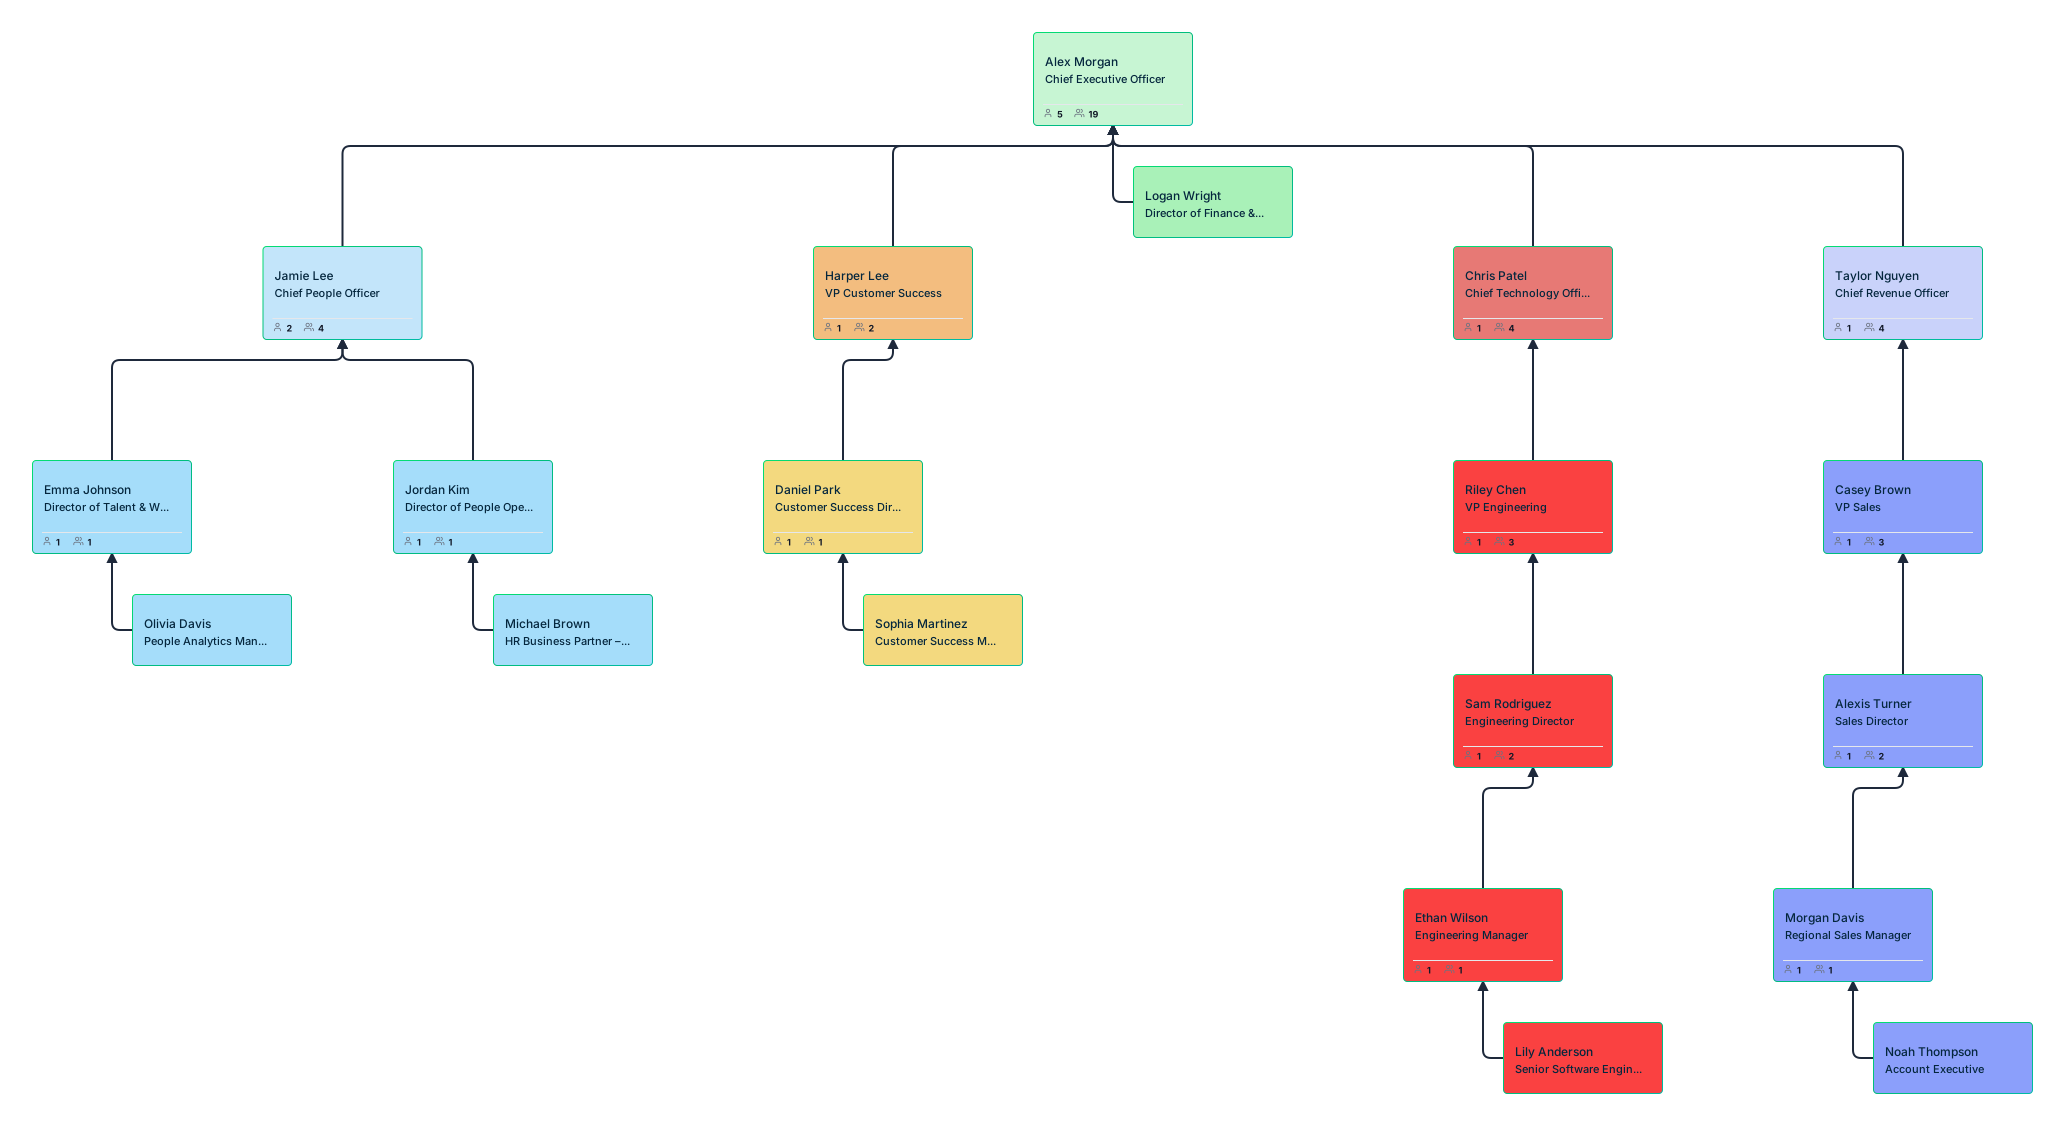
Helpful Resources for Making Org Charts
Explore rules for drawing organizational charts and org chart best practices to make your org chart more meaningful and useful.
Easily make organizational charts to visualize the reporting structure of your organization for effective HR planning and management with org chart maker.
Learn simple steps to create an org chart that fits your business, along with tips and tools to make it easy to build and update.