Learning how to make a pedigree chart involves understanding family relationships, standardized genetic symbols, and inheritance patterns rather than simply drawing a diagram. Pedigree charts are used in genetics, healthcare, and education to visually represent how traits and conditions are passed through generations. This guide explains the core concepts behind pedigree charts, focusing on structure, interpretation, and genetic logic so readers can accurately analyze and understand them.
What Is a Pedigree Chart?
A pedigree chart is a visual representation that maps the inheritance of traits or genetic conditions through generations within a family. It employs standardized symbols and lines to depict individuals and their biological relationships, making it an essential tool in genetics for tracking the occurrence and appearance of specific phenotypes.
What Does a Pedigree Chart Represent?
Pedigree charts essentially represent a family’s genealogy, highlighting the occurrence and inheritance of specific traits or genetic conditions across generations. Pedigree charts are effective tools to analyze patterns of inheritance.


Primary Components of a Pedigree Chart
Symbols: The standard symbols used include squares for males, circles for females, shaded symbols for affected individuals, and half-shaded symbols for carriers. Understanding these pedigree chart symbols is crucial for accurate interpretation.
Genders and Relationships: Males are represented by squares and females by circles. Marriage is indicated by a horizontal line connecting a male and female symbol, while vertical lines descend from the couple to their offspring, arranged from oldest to youngest.
Generations: Labeled to indicate different generations within the family.
Trait and Conditions: Different shading patterns represent various genetic conditions. For instance, a solid symbol might indicate an individual affected by a specific disorder, while a half-shaded symbol denotes a carrier.
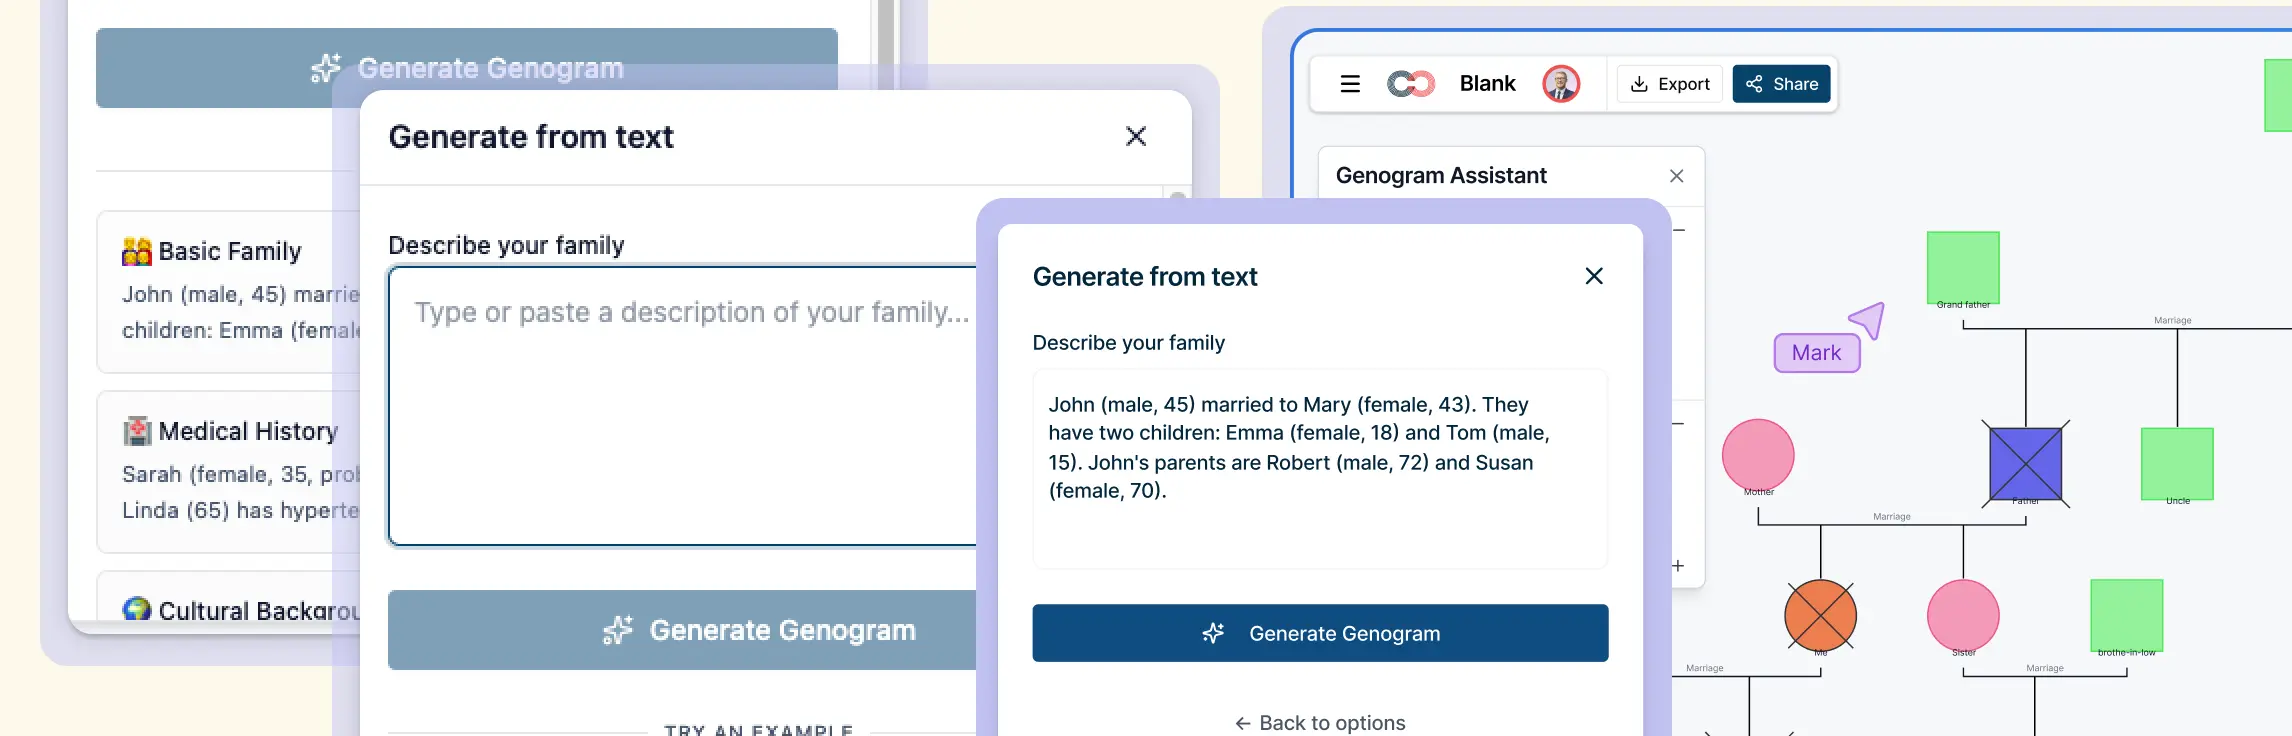
Pedigree Chart vs. Genogram
Here are the key differences between pedigree charts and genograms.
| Feature | Pedigree Chart | Genogram |
| Main Focus | Genetic Inheritance | Social relationships and behavioral patterns |
| Symbols | Standardized (squares, circles) | Varied (lines, shapes, annotations) |
| Use Case | Genetic research | Healthcare and psychotherapy |
Pedigree Chart Symbols
Pedigree charts use precise symbols to denote different family members, their relationships, and health conditions.
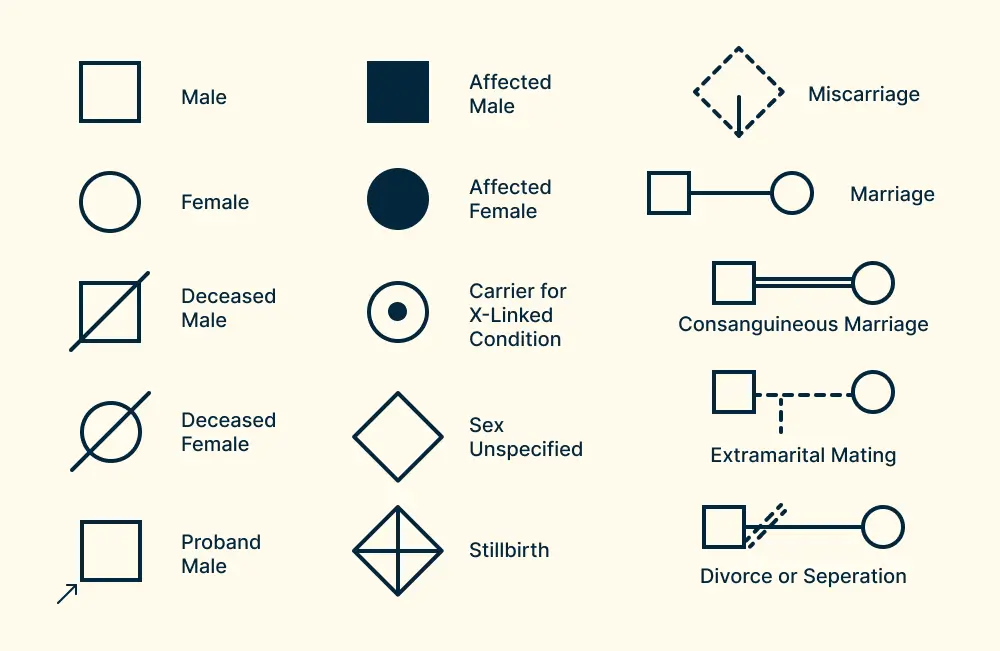
Pedigree Key
A pedigree key explains the standardized symbols and notations used in a pedigree chart so readers can correctly interpret family relationships and inheritance patterns. Because pedigree charts rely on visual conventions, the key serves as a reference that ensures consistency and prevents misinterpretation.
| Standard Symbols | Genders, Relationships, and Conditions |
|---|---|
| Circles represent females; squares represent males. | Double horizontal lines indicate consanguineous relationships (e.g., between cousins). |
| Horizontal lines between symbols indicate marriages or partnerships (male typically on the left). | Adopted individuals are shown with brackets around their symbols. Dashed lines indicate adopted into the family, solid lines for adopted out. |
| Vertical lines from partnerships represent offspring. A horizontal sibling line above connects children from oldest to youngest. | Pregnancies: Use a diamond for unknown gender, a circle or square for known gender, and a triangle for pregnancies not carried to term. |
| Shading shows medical conditions: solid = affected, half-shaded = carrier. Use quadrants or cross-hatching if multiple disorders are present. | Add the individual’s current age or age at death below the symbol, along with the cause of death if available. |
| Arrows at the lower left corner of a symbol mark the proband (the person the pedigree chart is initiated from). |
Understanding the pedigree key is essential when learning how to construct a pedigree chart for genetic analysis, as it allows students, clinicians, and researchers to read the chart accurately and recognize inheritance patterns without ambiguity.
How to Make a Pedigree Chart for Genetic Analysis
Step 1. Gather Family and Trait Information
Identify relevant family members and the specific traits or conditions being studied. This includes biological relationships, known diagnoses, and observable inheritance patterns across generations.
Step 2. Define the Scope and Generations
Determine how many generations will be represented and which individuals are relevant to the analysis. Establishing scope ensures the pedigree remains clear and meaningful for interpretation.
Step 3. Arrange Individuals and Biological Relationships
Organize individuals according to standard pedigree structure, placing parents, offspring, and siblings in their correct generational positions to accurately reflect lineage and relationships.
Step 4. Apply Pedigree Symbols and Genetic Traits
Use standardized pedigree symbols to represent gender, affected status, carrier status, and unknown information. Apply trait markers consistently so inheritance patterns can be interpreted correctly.
Step 5. Review Inheritance Patterns for Accuracy
Analyze the completed structure to confirm that the arrangement and symbols accurately reflect expected inheritance patterns, such as dominant, recessive, or X‑linked transmission.
How to Explain a Pedigree Chart
Techniques for Interpretation
Reading a pedigree chart requires a thorough understanding of its symbols and structure. Begin by identifying the standard symbols used to represent individuals and relationships. Analyzing whether these symbols are shaded, half-shaded, or clear will reveal important details about the individuals’ health statuses and carrier statuses.
Key Patterns in Pedigree Charts
To identify key patterns, you must evaluate if traits are dominant, recessive, autosomal, or sex-linked. Dominant traits will appear in every generation. Recessive traits may skip generations, appearing only if an individual inherits two recessive alleles.
Autosomal Traits: Affect both males and females equally.
Sex-linked Traits: More commonly affect males due to the presence of a single X chromosome.
Common Symbols
Common pedigree chart symbols help interpret complex genetic information. Key symbols include:
- Unshaded Symbols: Unaffected individuals.
- Shaded Symbols: Individuals expressing the trait.
- Half-Shaded Symbols: Carriers of a trait without expressing it, commonly seen in autosomal recessive conditions.
Pedigree Chart Examples
To further illustrate the utility of family pedigree chart examples, let’s consider some real-world scenarios.
Case Study of Hemophilia: An X-linked recessive disorder showing primarily in males with female carriers, highlighting the importance of pedigree charts in genetic counseling.
Cystic Fibrosis Inheritance: An autosomal recessive disorder with pedigree charts displaying carrier parents and affected offspring, crucial for understanding risk calculations in genetic inheritance.
Types of Pedigree Charts for Genetic Disorders
Y-linked Disorders
Y-linked disorders are genetic conditions associated with the Y chromosome, primarily affecting males. These disorders can include conditions like male infertility and some forms of hearing impairment. Y-linked disorders are passed from father to son, making their inheritance straightforward to track on a pedigree chart.

Mitochondrial Disorders
Mitochondrial disorders are caused by mutations in the DNA of mitochondria, the energy-producing organelles within cells. These disorders often affect energy-hungry organs like the brain, muscles, and heart. Unlike other genetic disorders, mitochondrial conditions are inherited maternally, as children receive their mitochondria exclusively from their mother. Pedigree charts reflect this unique inheritance pattern, highlighting affected individuals in maternal lines.

Autosomal Recessive Disorders
Autosomal recessive disorders require two copies of the mutated gene to express the condition. Common examples include cystic fibrosis and sickle cell anemia. These disorders can skip generations if both parents are carriers. Pedigree charts display this by showing affected individuals typically only when both parents carry the recessive allele.

Autosomal Dominant Disorders
Autosomal dominant disorders are caused by mutations in genes on the autosomes and require only one copy of the mutated gene to express the disease. Huntington’s disease and Marfan syndrome are examples. In pedigree charts, these disorders do not skip generations, and affected individuals have at least one affected parent.

X-linked Recessive Disorders
X-linked recessive disorders are caused by mutations in genes on the X chromosome. These disorders, including hemophilia and Duchenne muscular dystrophy, primarily affect males, as they have only one X chromosome. Female carriers can pass the mutation to their sons, who will express the disorder. Pedigree charts use specific symbols to denote carriers and affected individuals.

X-linked Dominant Disorders
X-linked dominant disorders are also related to genes on the X chromosome but require only one copy of the mutated gene to express the condition. Examples include Rett syndrome and some forms of osteoporosis. Both males and females can be affected, but males often exhibit more severe symptoms. Pedigree charts for these disorders reflect both affected parents and children.

Pedigree Chart Examples
To further illustrate the utility of pedigree charts, let’s consider some real-world scenarios.
Case Study of Hemophilia: An X-linked recessive disorder showing primarily in males with female carriers, highlighting the importance of pedigree charts in genetic counseling.
Cystic Fibrosis Inheritance: An autosomal recessive disorder with pedigree charts displaying carrier parents and affected offspring, crucial for understanding risk calculations in genetic inheritance.
Common Mistakes When Making a Pedigree Chart
When learning how to create a pedigree chart, errors often occur due to misunderstanding symbols, relationships, or inheritance logic rather than poor diagram layout. Recognizing these common mistakes helps ensure the pedigree accurately represents genetic information and can be interpreted correctly.
Mislabeling or Inconsistent Use of Symbols
Using non‑standard or inconsistent symbols can make pedigree chart diagrams difficult to interpret. Pedigree charts rely on widely accepted conventions, so deviations may lead to confusion or incorrect conclusions about inheritance patterns.
Skipping or Compressing Generations
Omitting generations or combining them into a single level can distort how traits appear to pass through a family. Even when information is limited, clearly indicating missing or unknown individuals preserves the integrity of the pedigree structure.
Incorrect Representation of Carriers
Carriers are sometimes left unmarked or incorrectly shaded, especially in recessive or X‑linked conditions. This can obscure how a trait is transmitted and lead to incorrect assumptions about risk in future generations.
Misinterpreting Dominant and Recessive Traits
Assuming a trait is dominant or recessive without examining how it appears across generations is a common mistake. Accurate interpretation requires analyzing whether traits skip generations, appear in every generation, or arise from unaffected parents.
Ignoring Consanguinity or Complex Relationships
Failing to represent consanguineous relationships, multiple partnerships, or adoption can significantly affect genetic interpretation. Pedigree charts should clearly reflect these relationships using accepted notation to avoid misleading conclusions.
Once you’re confident in interpreting pedigree structures and symbols, you can bring these concepts to life visually. Creately’s Pedigree Chart Software makes it easy to create clear, accurate pedigree charts using ready‑made examples and intuitive diagramming features—so you can focus on analysis and insight rather than manual formatting. Try Creately to turn your pedigree chart knowledge into well‑structured, professional diagrams.