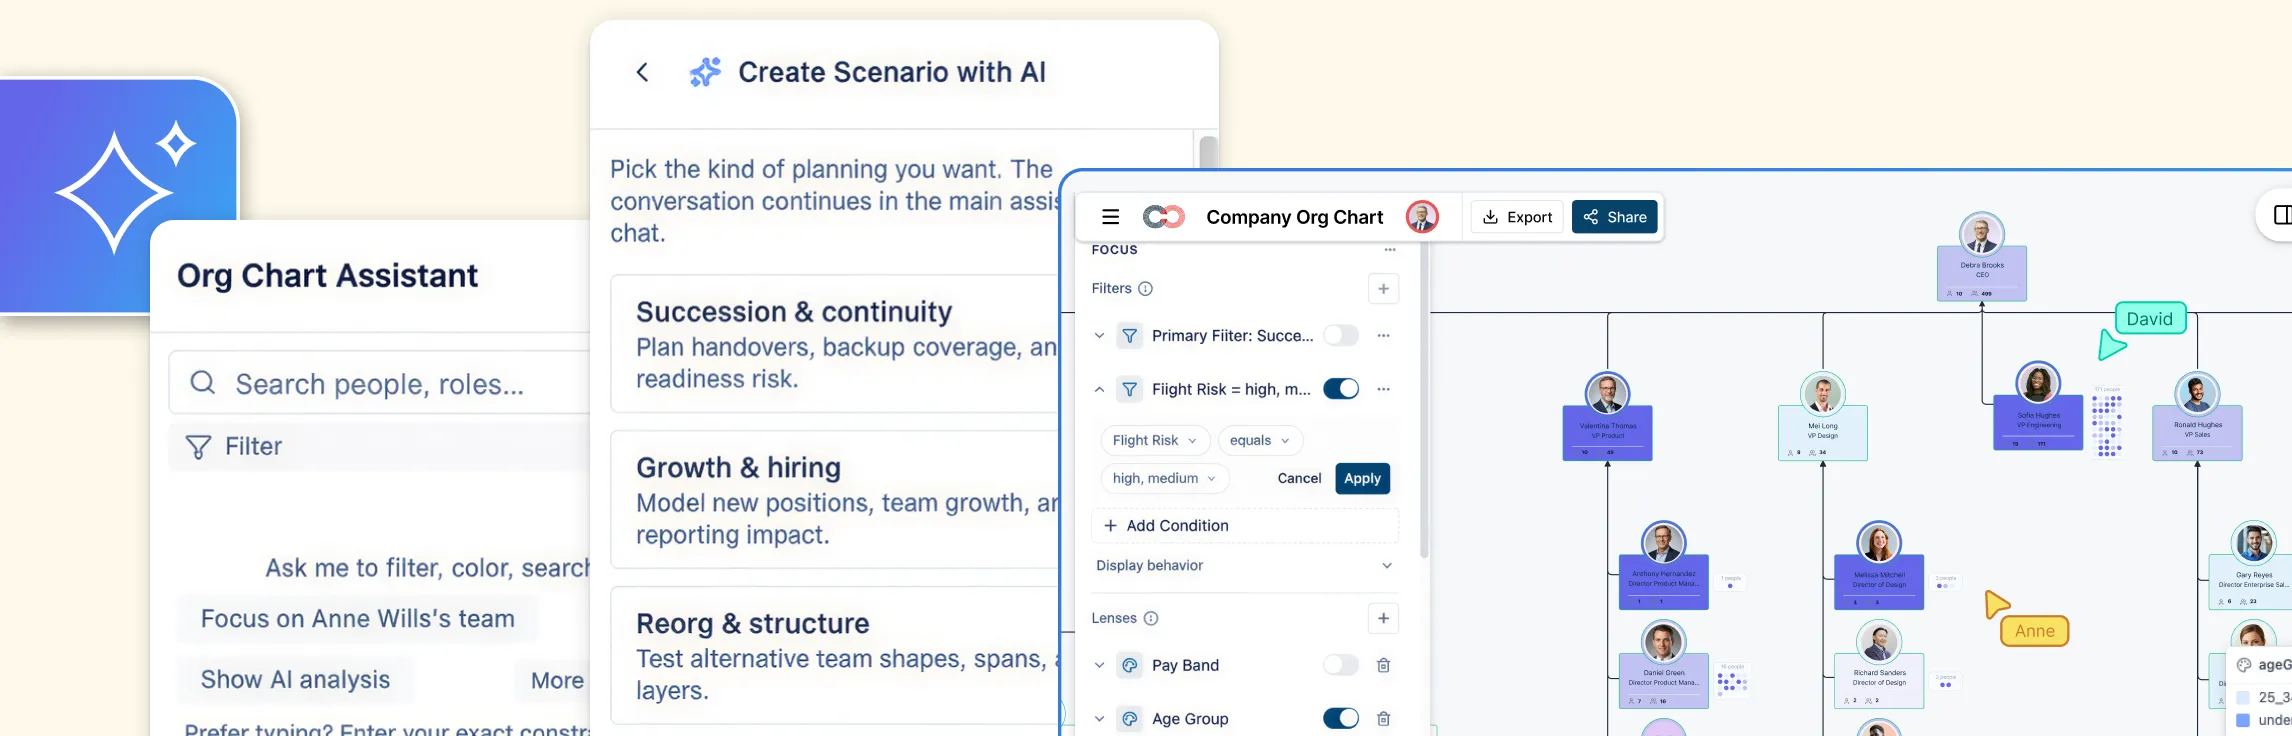
A span of control is the number of direct reports assigned to one manager. Span of control analysis uses this count, a simple formula, and workload context to identify management capacity issues. Use this guide to calculate span of control, compare wide and narrow spans, and decide when an org structure needs review.
Creately Atlas provides a span-of-control view based on recorded reporting relationships. This guide covers the calculation, context for setting targets, and a repeatable six-step review workflow.
For an assistant-led starting point, explore AI-driven organizational insights in Creately Atlas and how to verify the reporting data behind a finding.
What Is Span of Control?
The span of control formula is simple: Span = number of direct reports for a given manager. For aggregate analysis: Average span = total direct reports ÷ number of managers.
Count only formal direct reports. Track dotted-line and matrix relationships separately — they add management complexity but shouldn’t inflate the core count. Part-time and fractional FTE roles need adjustment too; a manager with 8 reports where 4 are half-time has a very different workload than one with 8 full-time ICs.
Review these measures alongside the raw number:
- Per-manager counts paired with workload context
- Mean and median span by function (not org-wide averages, which hide everything)
- Percentile distribution (10th/90th) to spot outliers fast
- A heatmap overlay on your org chart for instant visual diagnosis
A common pitfall: teams rely on static org chart boxes without workload context. A manager with 6 direct reports across 3 timezones and 4 active projects has a very different job than one with 6 co-located reports on a single product. The number is the same; the management burden is not.
Why Span of Control Matters for Organizational Health
Span of control is a lever that directly affects three things: manager bandwidth, employee development, and decision speed. Getting it wrong produces predictable symptoms.
| When spans are too wide | When spans are too narrow |
|---|---|
|
|
The “right” span depends on context: work complexity, team maturity, geographic distribution, and whether the manager role is primarily coaching, coordinating, or executing. Ask how the current structure supports the work — connect span metrics to outcome KPIs (retention rates, engagement scores, OKR delivery velocity) and let the data tell you where the problems are.
Span of Control Benchmarks by Role Type
Span targets depend on managerial work rather than a universal ratio. McKinsey’s managerial-archetype framework considers work complexity, standardization, and the manager’s own workload. Use the considerations below to set and test local targets.
| Role Type | Target-setting consideration | Notes |
|---|---|---|
| Knowledge work (product, engineering, design, finance) | Allow time for coaching and complex decisions | Complex, collaborative work where coaching time matters. Validate coaching capacity with team feedback. |
| Operational / frontline (customer service, manufacturing, nursing) | Assess task standardization and supervision needs | Standardized tasks and shift coverage allow wider spans. Clinical and safety-critical teams require a separate workload assessment. |
| Specialized / matrix leads | Varies | Fewer direct reports but broader dotted-line influence. Treat matrix load as a complexity multiplier. |
| Tech startups (< 50 people) | Account for founders’ individual responsibilities | Founders and leads often have wide spans by necessity; review responsibilities as the team grows. |
| Regulated industries (banking, healthcare, government) | Check safety and regulatory requirements | Compliance and safety requirements constrain feasible spans regardless of manager capability. |
How to benchmark your org: Start with your actual reporting line data, not an external average. Export reporting structures from your HRIS, calculate the median and quartiles by function or manager type, and compare them against business context such as work complexity, team maturity, and compliance needs. The goal is to set span ranges by managerial archetype, such as supervisor, coach, or facilitator, rather than forcing one number across the whole company.
Wide vs Narrow Span of Control: Key Tradeoffs
Choosing between wide and narrow spans is a tradeoff between management cost, coaching capacity, employee autonomy, and decision speed. Here’s how to think about it:
Wide span of control (15+ direct reports):
- Lower management headcount and lower salary overhead
- Flatter structure with fewer approval layers and faster lateral communication
- More autonomy and peer accountability across the team
- Risk: managers have less time for coaching, 1:1s, and performance support
- Risk: manager overload can lead to slower escalations, weaker review cycles, and quality issues
- Best for: routine or standardized work, experienced individual contributors, and teams with strong operating rhythms
- Common in: support, operations, and other functions where work is repeatable and oversight can be lighter
Narrow span of control (3–5 direct reports):
- More manager time for coaching, development, and regular feedback
- Closer oversight for complex work, newer teams, or employees who need more support
- Clearer career guidance and more hands-on management
- Risk: higher management cost and more organizational layers
- Risk: slower decisions, extra approvals, and greater micromanagement risk
- Best for: early-stage teams, high-ambiguity work, and functions with intensive development or quality oversight needs
- Common in: consulting, R&D, strategy, and other environments where the work is complex and manager involvement is higher
Hybrid approach: In practice, most organizations need different spans for different functions. Engineering and customer support may need different targets because coaching demands and task standardization differ. A better approach is to define manager archetypes and set span targets by role, team maturity, and work complexity instead of forcing one ratio across the whole company.
Warning signs that a span is wrong:
- Too wide: rising escalations, missed 1:1s, declining team engagement or eNPS, slower feedback cycles, managers consistently overextended
- Too narrow: decisions pass through too many layers, managers spend more time approving than enabling, review steps get duplicated, and teams feel overmanaged
How to Run a Span of Control Analysis in Creately
This workflow is repeatable and can scale from a quick audit to a deeper review with scenario planning. The goal is to move from static reporting lines in a spreadsheet to a live org chart where spans, risks, and possible fixes are easier to see and act on.
Most span analysis starts and ends in a spreadsheet. Export from HRIS, pivot table, squint at numbers, email the results. By the time leadership sees it, the data is stale and nobody can visualize what “a span of 14” actually looks like in context.
We built Creately’s span analysis to fix this. The core idea: span of control should be visible on the org chart itself, updating live as you make changes — not buried in a separate report.
Step 1: Import and clean your org data
Start by exporting your Excel, Google Sheets, or HRIS records as CSV and importing the file into Creately Atlas.
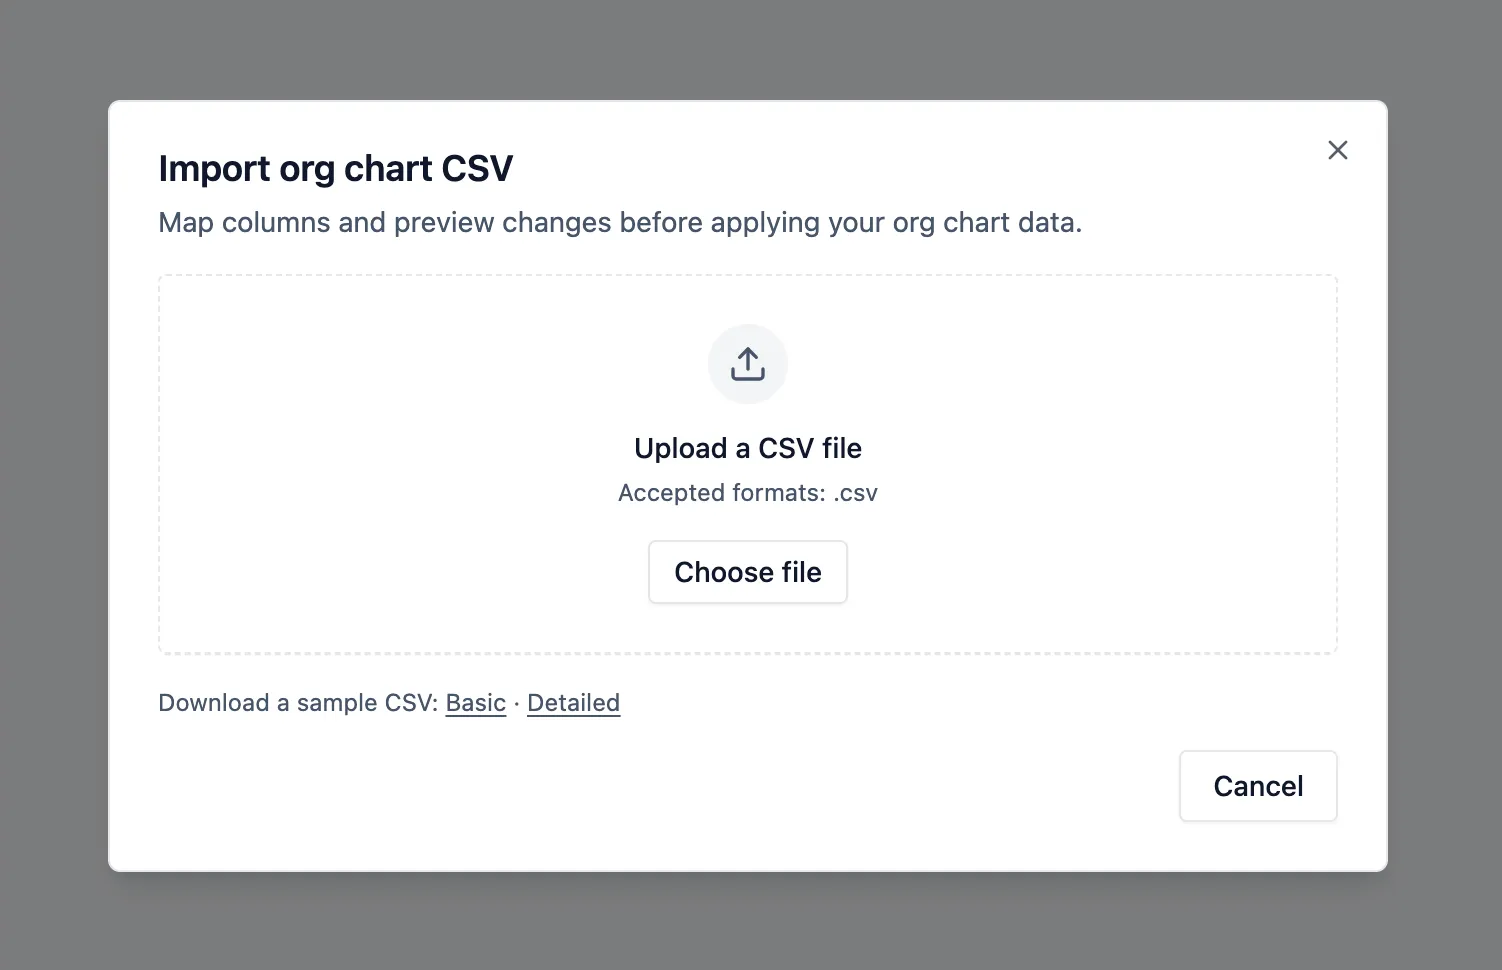
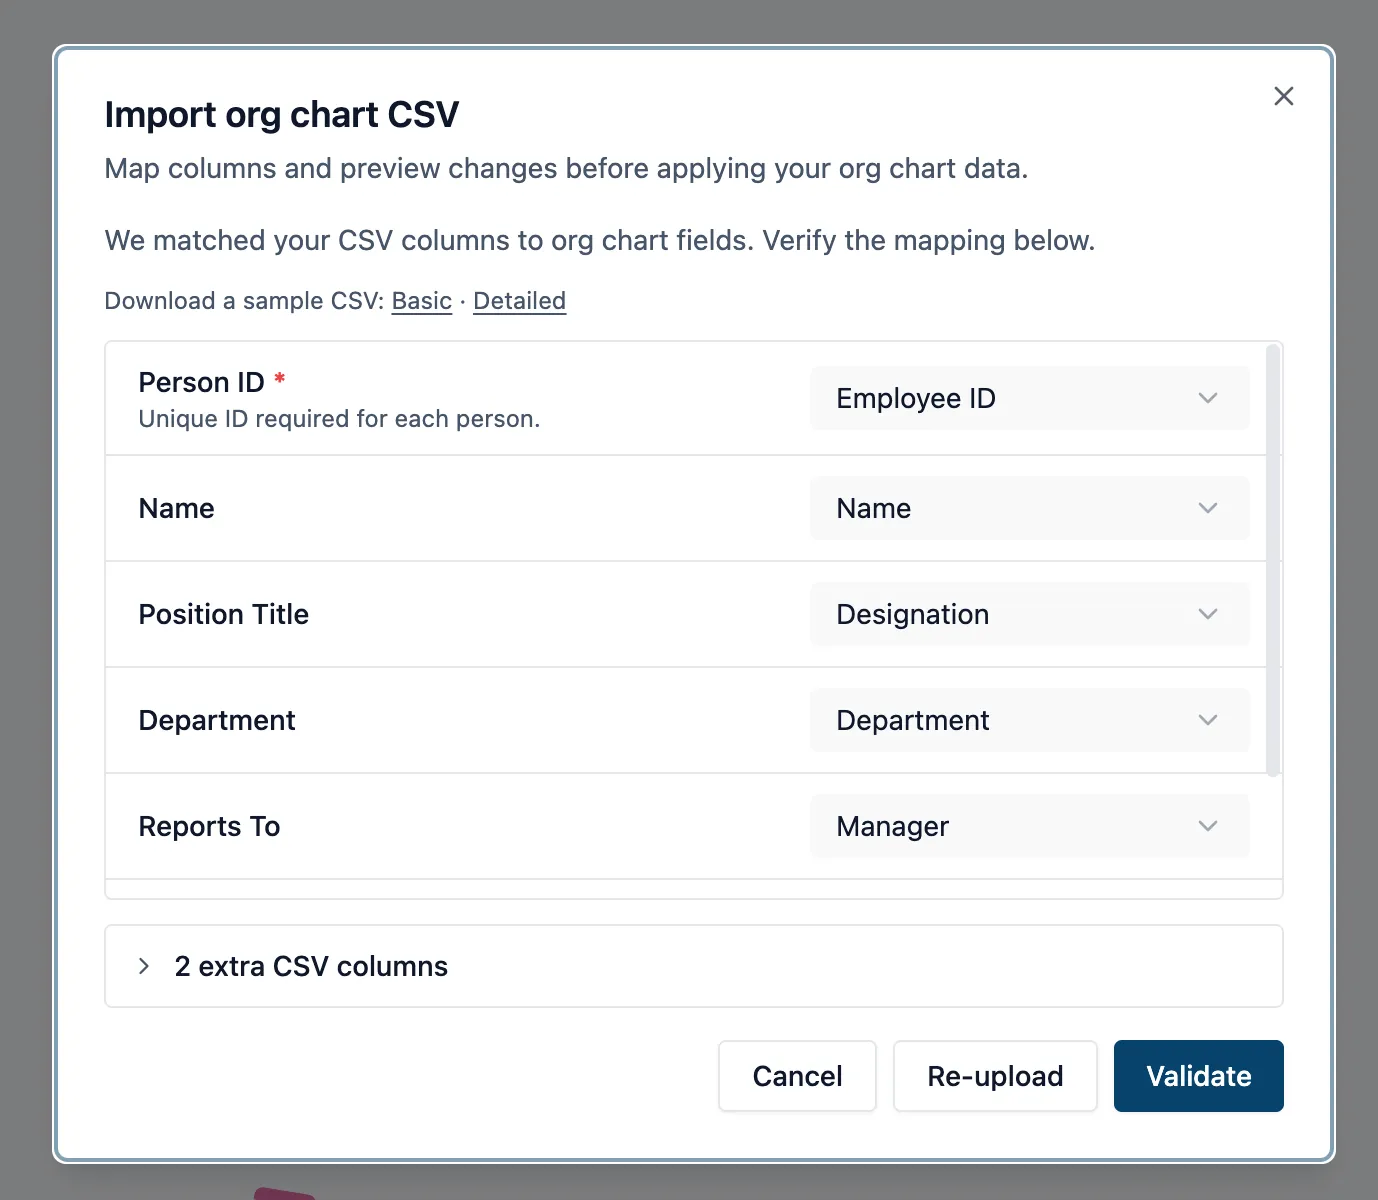
Use AI-powered column mapping to match fields such as employee ID, manager, department, and title faster, then review the structure for missing managers, broken reporting lines, or stale records before you analyze anything.
Step 2: Calculate baseline spans
Once the org chart is built, calculate direct-report counts for each manager and review the baseline by team or function. Look for outliers, especially managers whose spans are far above or below what is typical for their area. This gives you the starting point for identifying where the structure may be out of balance.
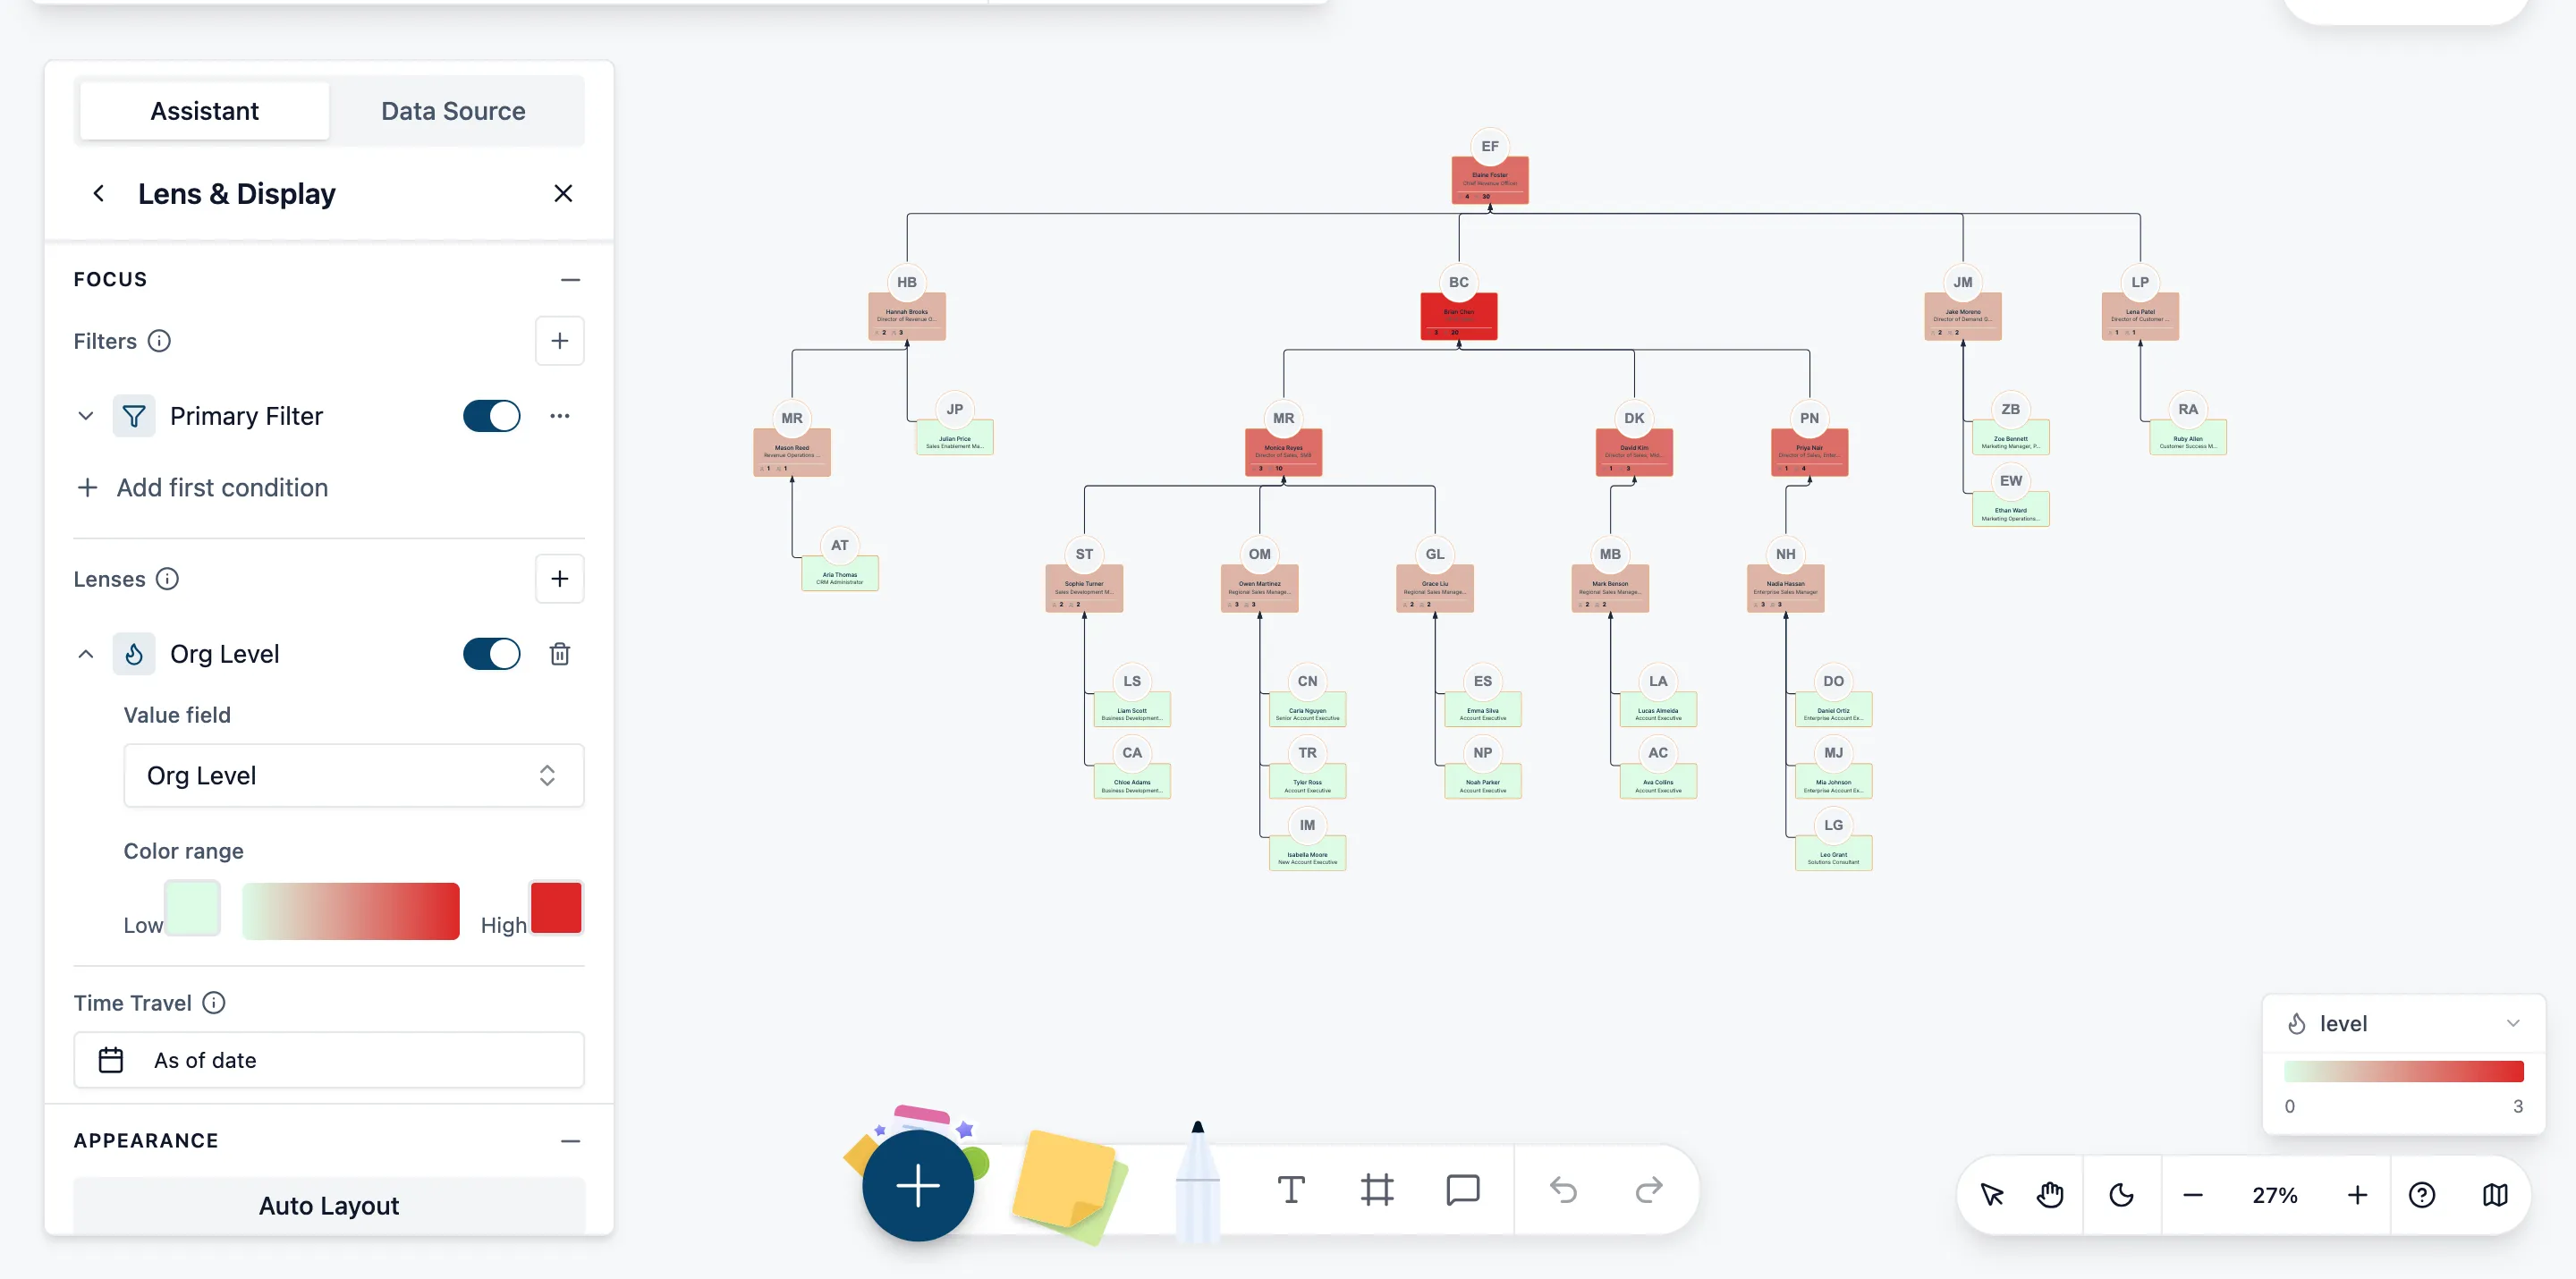
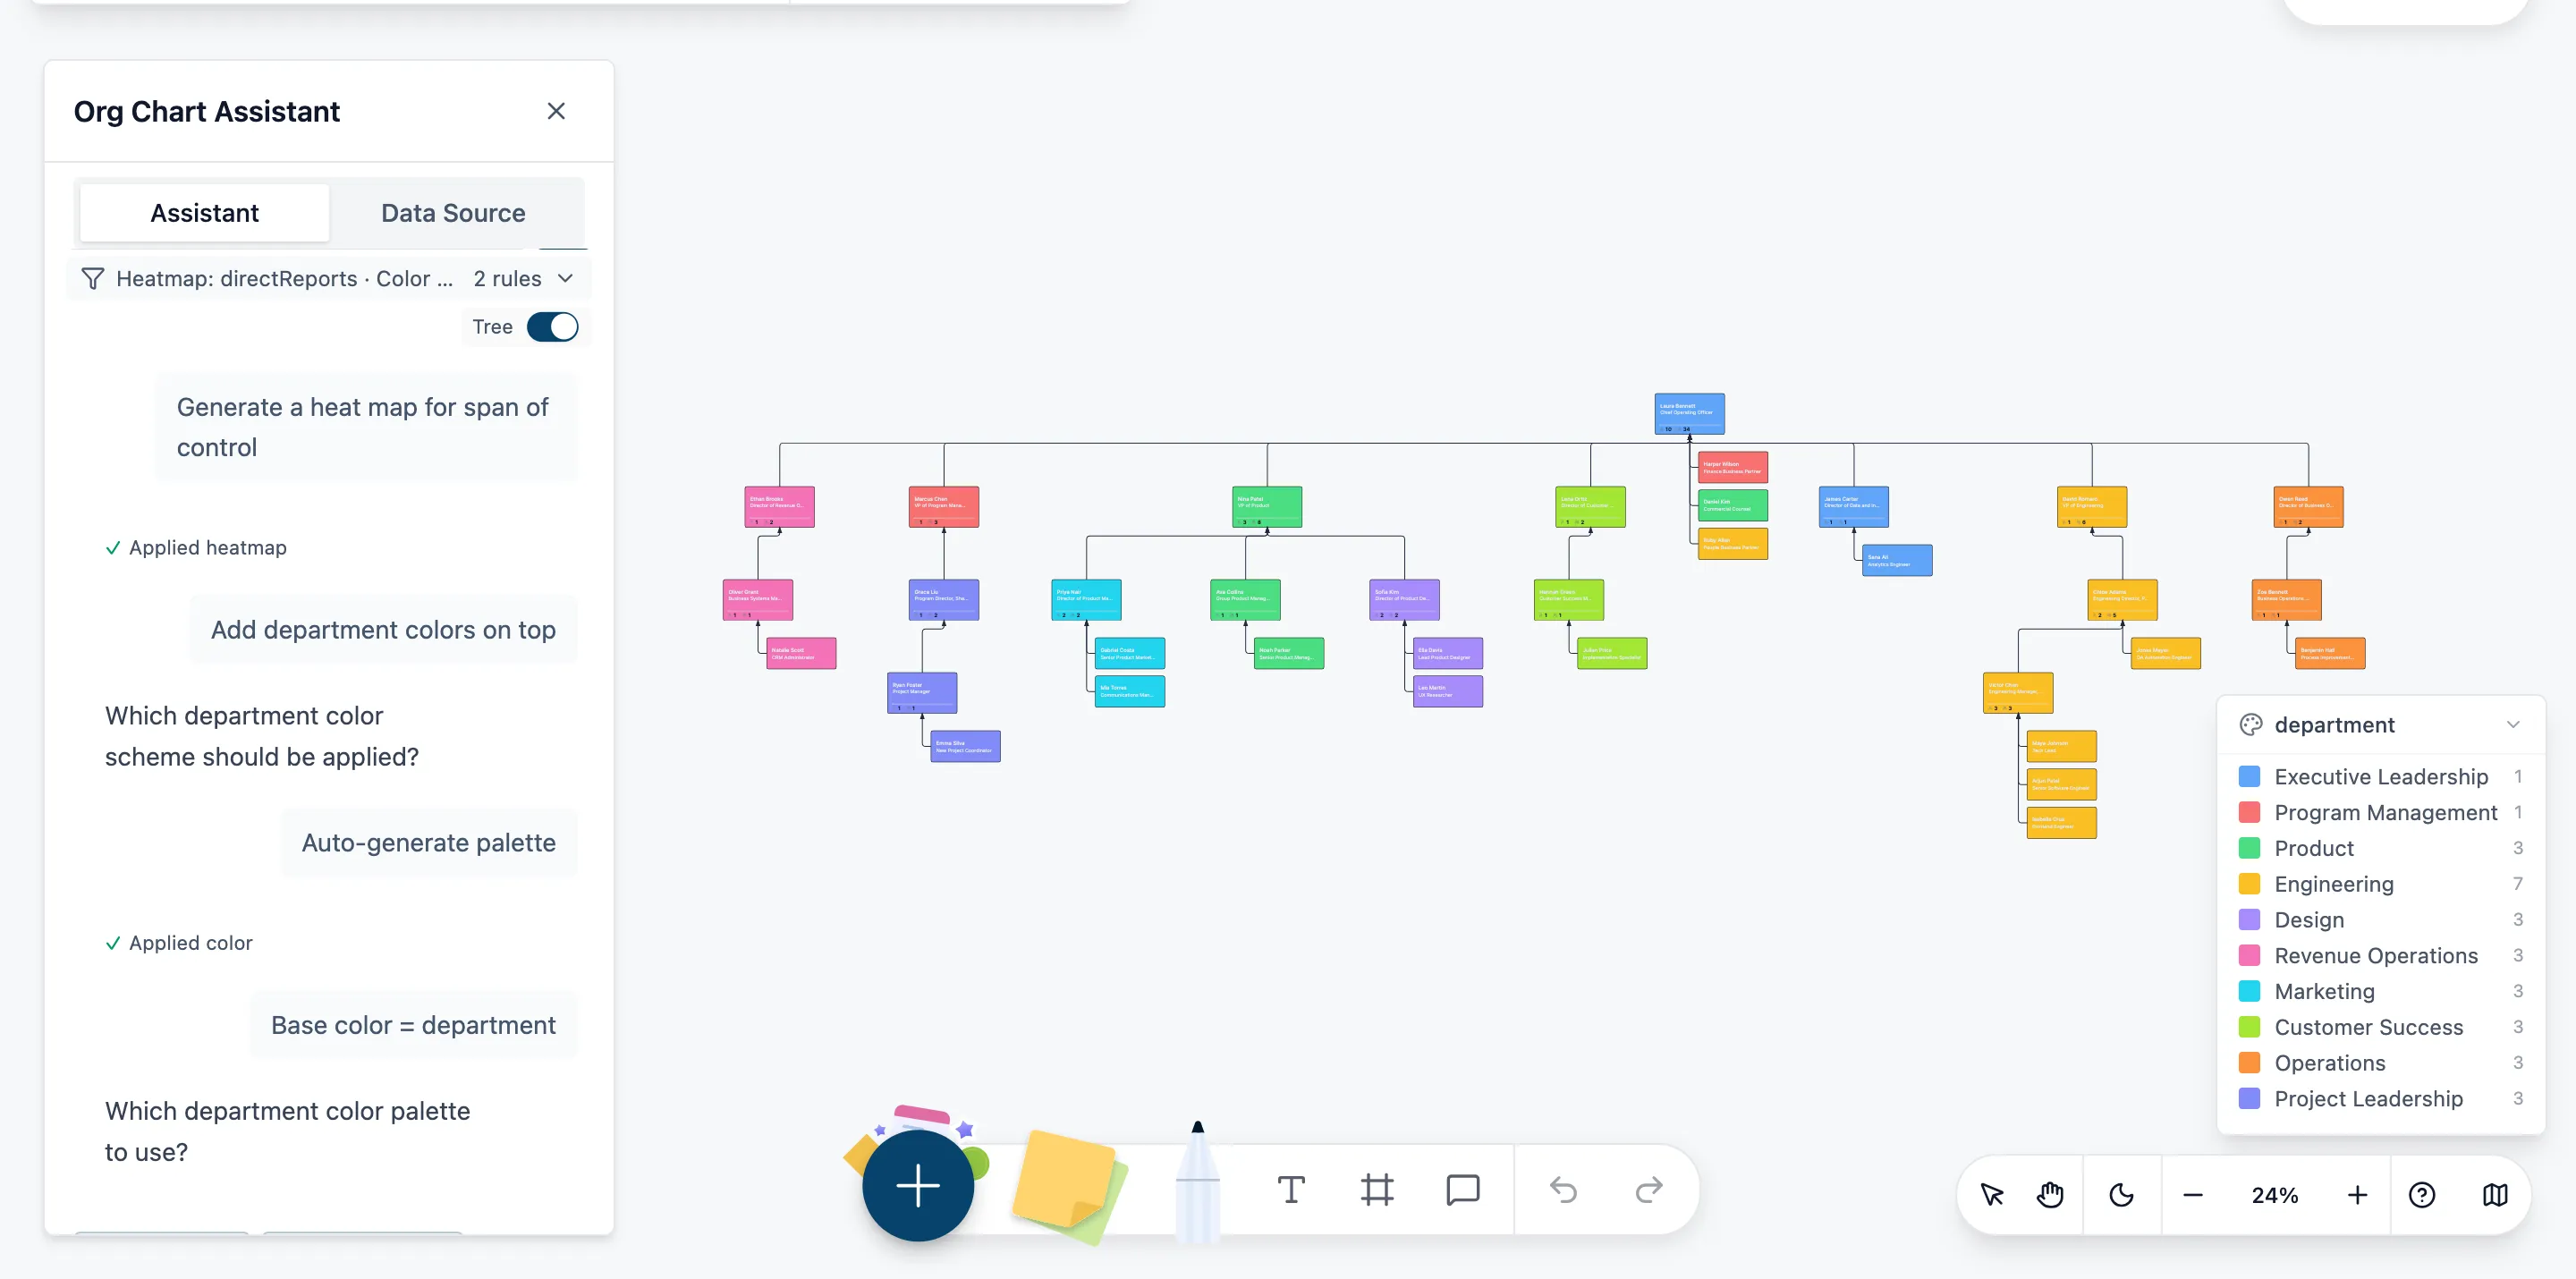
Apply the Span of Control preset to color managers by direct-report count. Read the legend alongside your team’s span targets. The visual highlights outliers for review without treating a count alone as proof of overload.
Step 3: Add context to the numbers
Raw span counts only tell part of the story. A manager with six direct reports in one stable team is in a very different position from a manager with six reports spread across multiple projects, products, or time zones. Add context such as function, work complexity, team maturity, or reporting setup so you can tell which span outliers are actually risks.
Step 4: Visualize span issues on the org chart
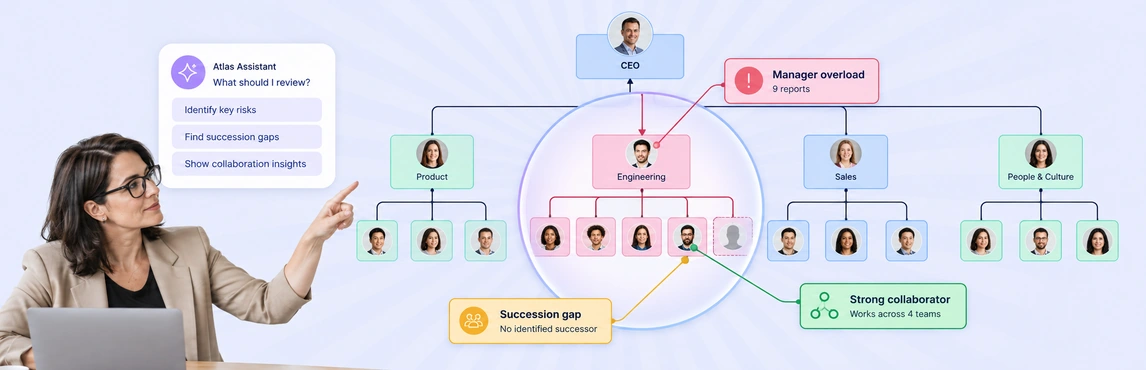
Use a span of control heatmap to color-code managers directly on the org chart. This makes overloaded, stretched, or balanced spans visible in seconds instead of burying them in a spreadsheet.
You can also use Creately’s AI assistant to ask questions such as who has the widest span in a department or which managers have more than a set number of direct reports.
Step 5: Model changes before you commit
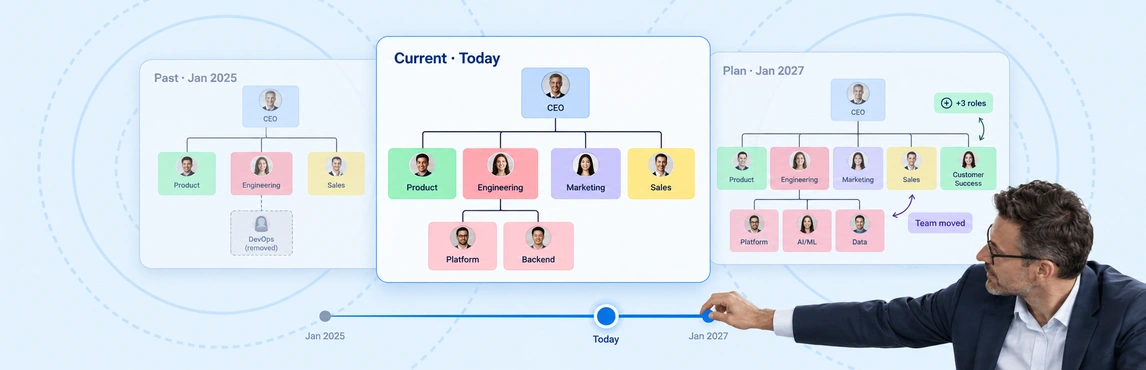
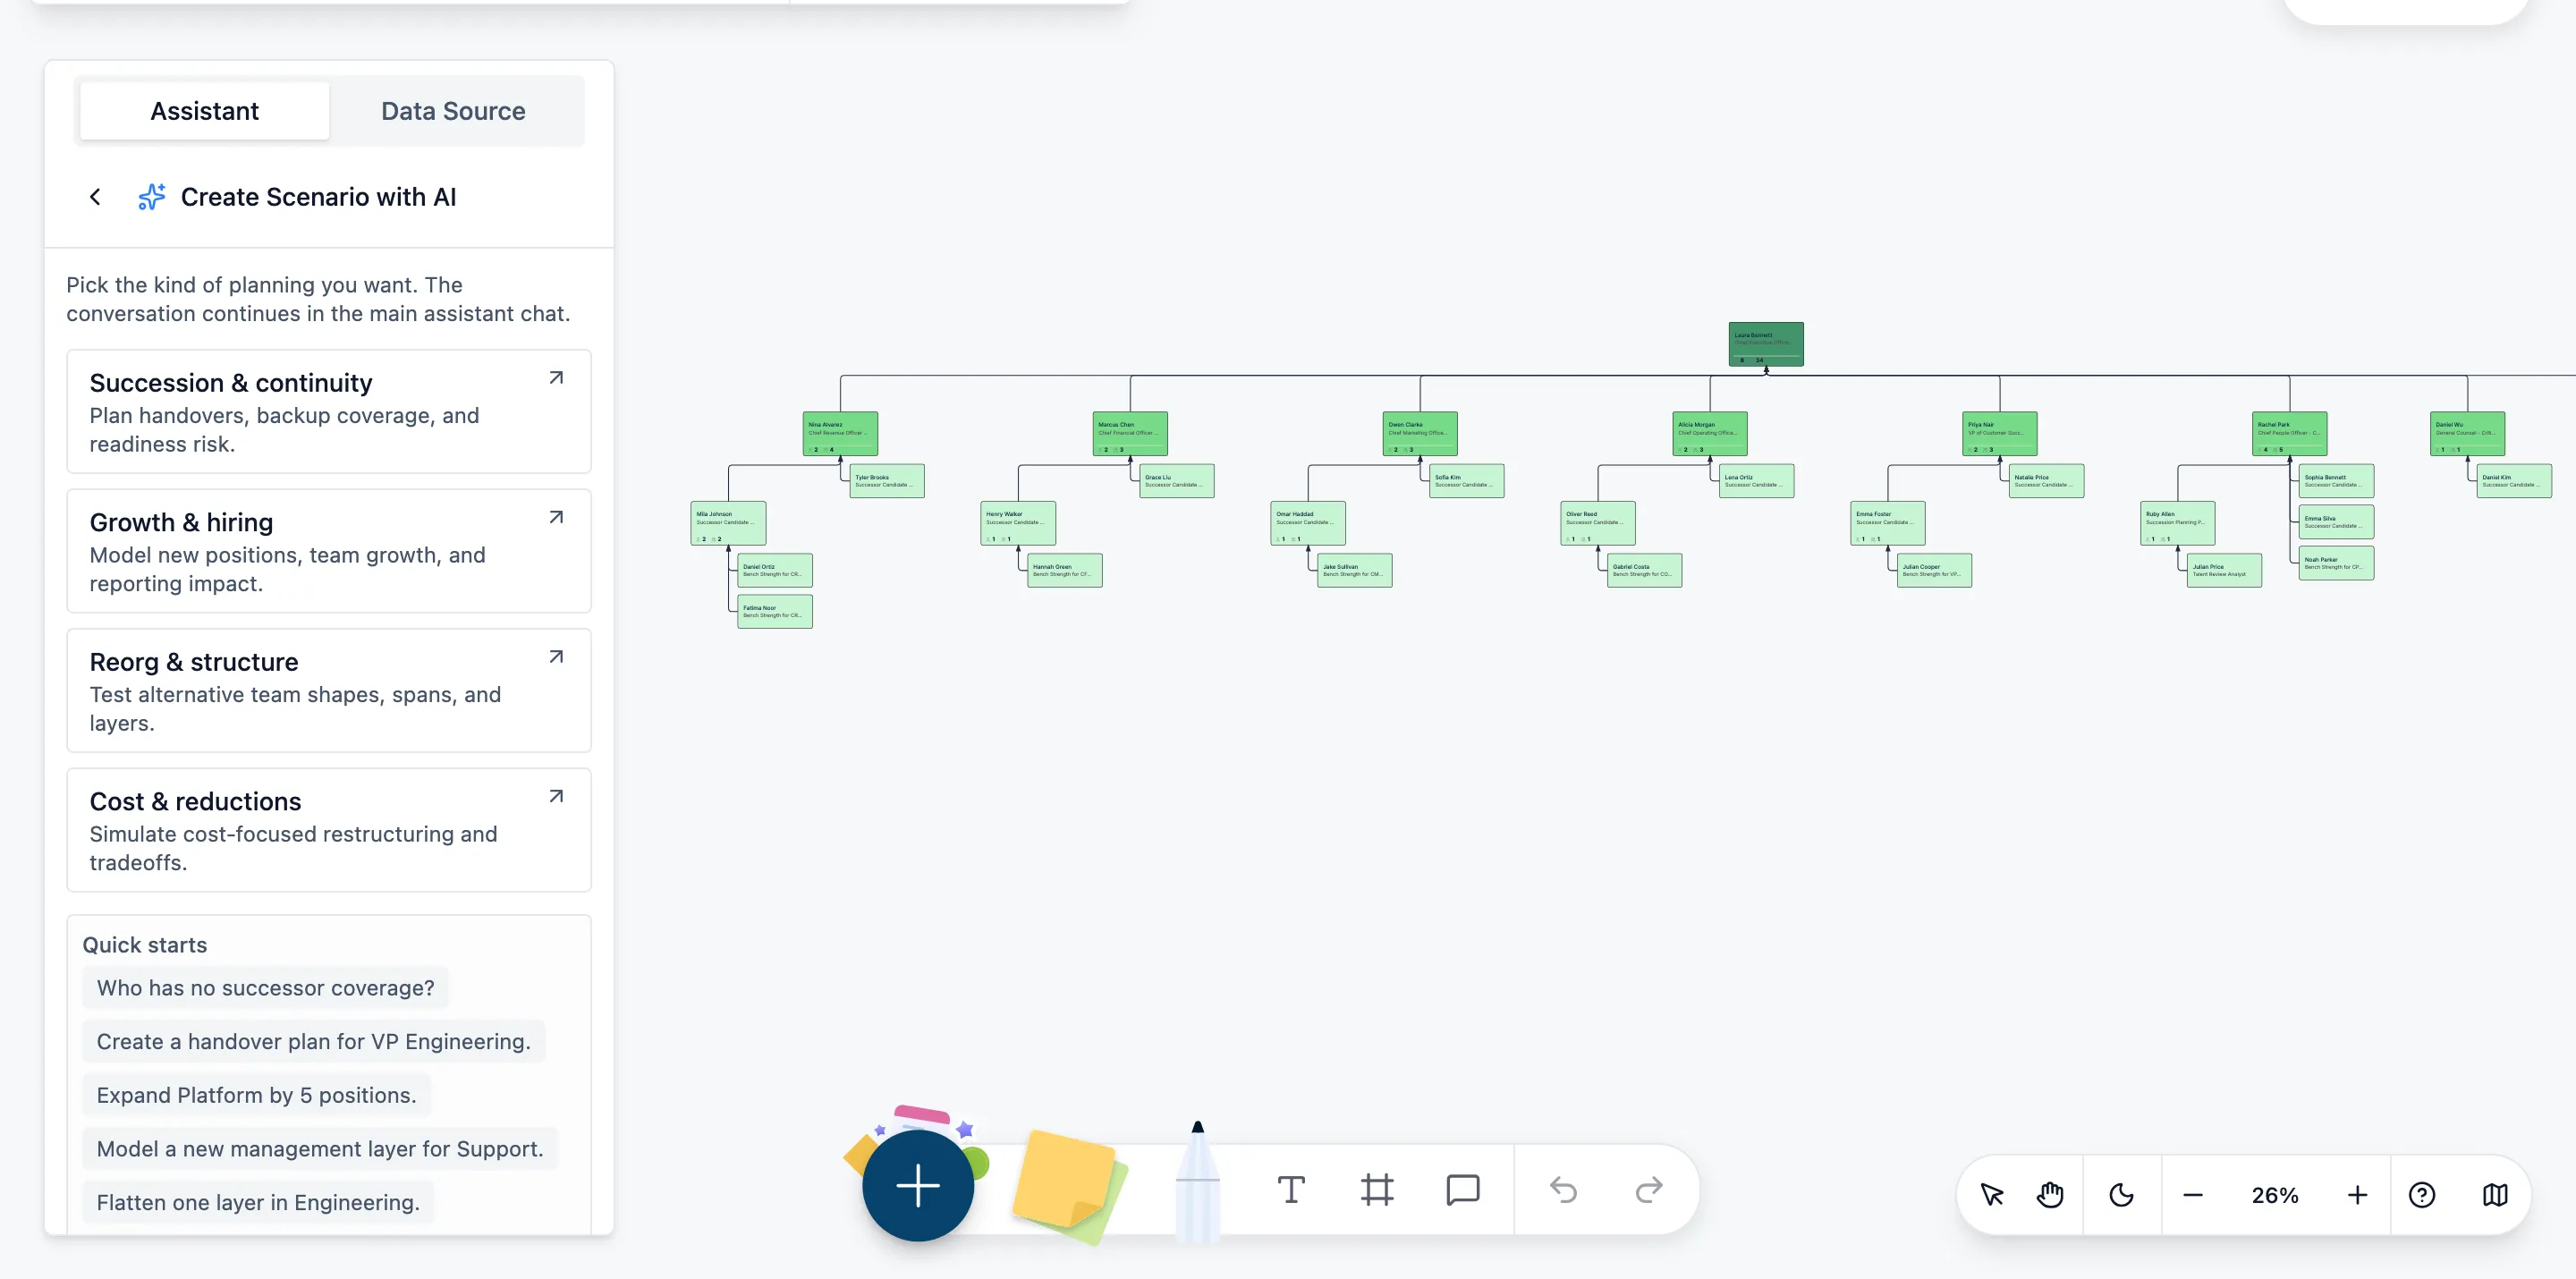
Once the biggest span issues are visible, create scenario branches to test possible fixes. You might redistribute direct reports, add a team lead, consolidate smaller teams, or shift coordination work to a senior individual contributor. As you make changes, compare direct-report counts, headcount, and reporting changes against the current org while recording your assumptions about workload and decision-making.
Step 6: Share the right view with the right people
After you identify a recommended structure, share it with the right level of visibility for each audience. Creately’s sensitivity controls help different stakeholders see what they need without maintaining separate versions of the org chart. That makes it easier to review span issues, discuss changes, and keep the analysis current over time.
Keep it practical: span of control analysis works best when it becomes part of an ongoing org review process, not a one-time spreadsheet exercise. A live org chart makes it easier to spot imbalances early, test changes visually, and keep leadership aligned on what needs to change.
Scenario Planning for Span of Control Changes
This is the part most teams skip — and it is usually the part that prevents the most rework. It is easy to identify a span problem on paper, but the real question is what happens after you change it. A scenario branch helps you test that before you commit.
Common span changes to model:
- Redistribute reports: move direct reports from an overloaded manager to another manager with more capacity
- Add an intermediate layer: introduce a team lead or manager when one span has become too wide
- Consolidate teams: combine under-loaded teams to reduce unnecessary management layers
- Shift coordination to senior ICs: reduce manager load by giving experienced individual contributors more coordination responsibility without adding formal reports
For each scenario, quantify:
- the change in manager span
- headcount and cost impact
- effect on coaching capacity
- likely impact on decision speed and team execution
Run at least two alternatives alongside a baseline “do nothing” case. This makes it easier to see whether the change actually improves span balance or just moves the problem somewhere else.
Pair each scenario with a simple transition plan: communication steps, timeline, temporary coverage or knowledge transfer, and the main risks to watch during the change.
Span of Control Examples and Use Cases
The following are illustrative organizational patterns, not documented customer results or verified company benchmarks. Use them to frame questions about your own structure.
Flat, self-managed teams
In a self-managed team, coordination and peer accountability take on responsibilities often held by a formal manager. Assess how hiring, development, escalation, and performance decisions will be handled before removing reporting layers.
Product and customer-facing teams
Product teams may need more coaching and review time, while standardized customer-facing work may support different supervisory arrangements. Set targets from the work rather than copying another company’s reported ratio.
Traditional hierarchy (banking, consulting)
A layered hierarchy can provide defined review and escalation responsibilities. Evaluate whether each layer serves a clear purpose and whether managers have time for oversight. Do not assume a specific span guarantees compliance.
Practical takeaway: Map your strategic priorities — speed, innovation, cost control, compliance — to span decisions. Then validate with scenario modeling rather than copying a competitor’s exact numbers.
5 Key Factors That Influence Span of Control
The number is never the whole story. Consider these five factors when setting a span target:
Manager capability: Stronger managers with effective delegation can sustain wider spans. Measure with time-use analytics (1:1 duration, delegation metrics) and performance outcomes.
Task complexity: Routine standardized work supports wider spans. Creative, ambiguous, high-stakes work needs narrower spans.
Geography and timezones: Distributed teams face coordination costs. Narrower spans offset asynchronous communication burdens, especially across 3+ timezones.
Culture: Autonomy-oriented cultures tolerate wider spans. Hierarchical cultures require closer spans for decision-making comfort.
Regulatory constraints: Safety-critical, regulated, and unionized environments limit feasible spans regardless of theoretical optimum. Build these constraints into any automated span calculation.
Org Chart Templates for Span of Control Analysis
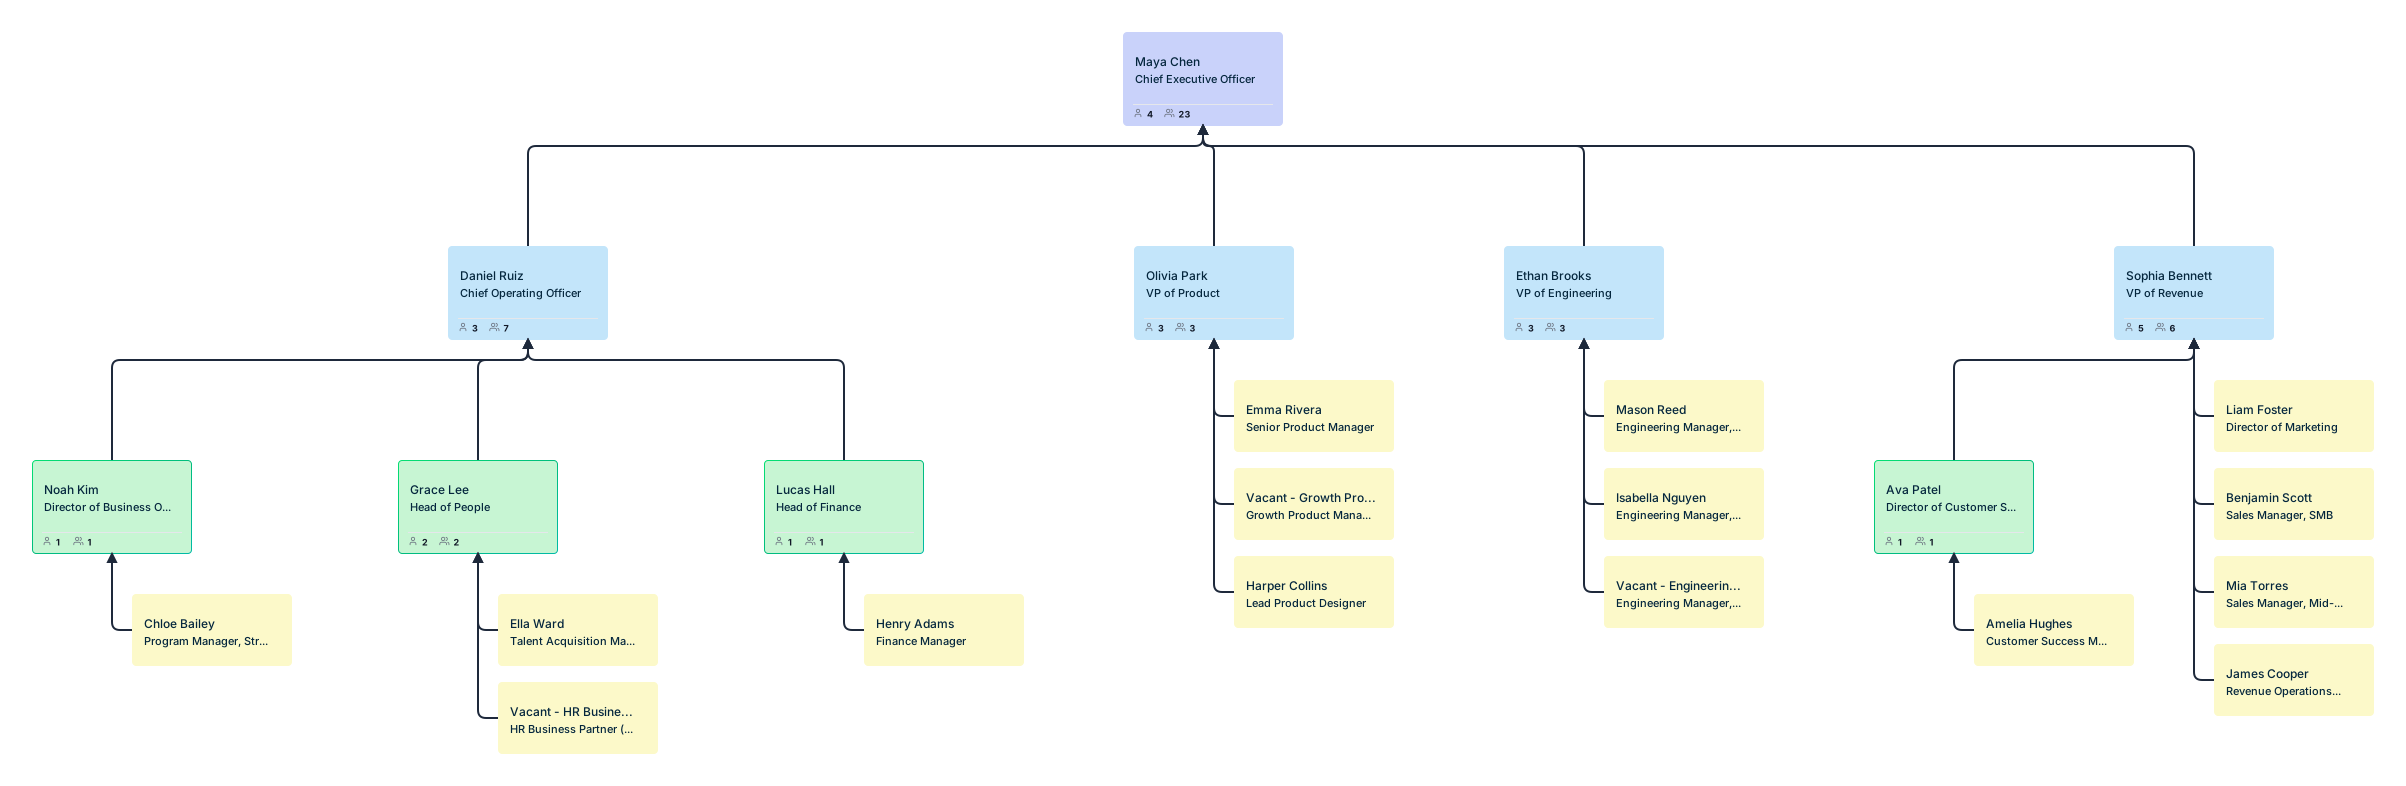
Growth-Stage Scaling Org Chart

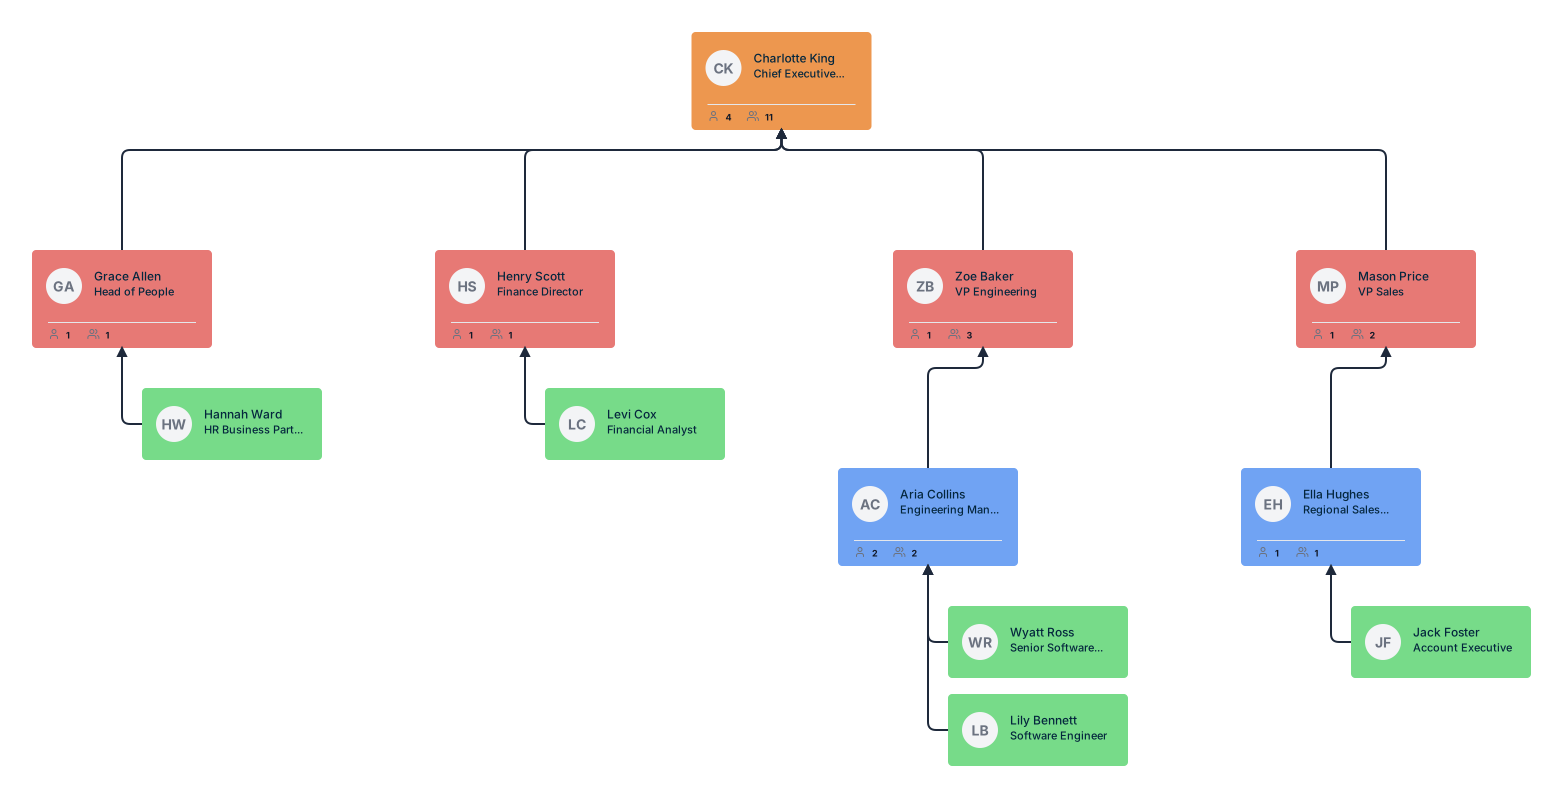
Hybrid and Remote Mixed Workforce Org Chart
Matrix Project Team Org Chart
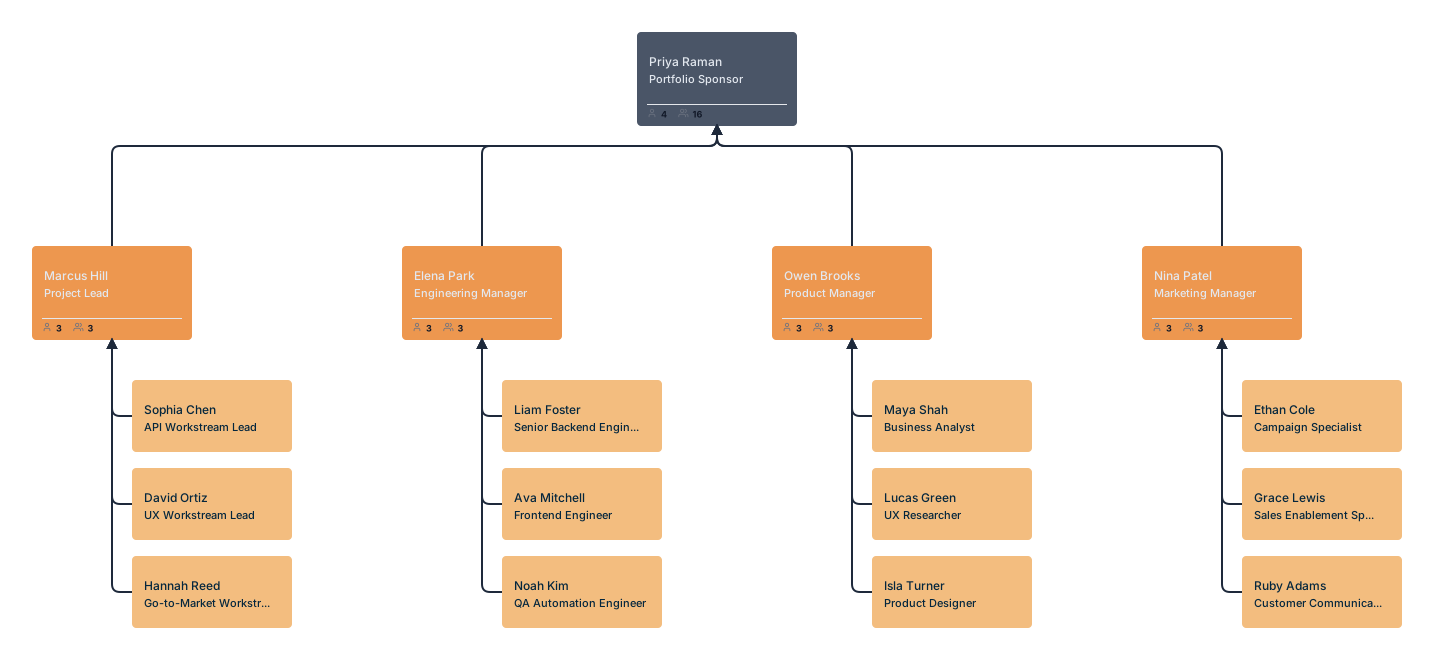
Company-Wide Employee Org Chart

Succession Planning Org Chart