This Value Stream Mapping tutorial walks you through everything you need to know to understand, create, and use value stream maps effectively. You’ll learn what value stream mapping is, the different types of value stream maps, how a value stream map is structured, and the step-by-step process for building one from scratch. The guide also covers practical tips and best practices to avoid common mistakes, along with ready-to-use value stream map templates to help you get started faster and apply VSM confidently to real-world processes.
Value Stream Mapping Definition
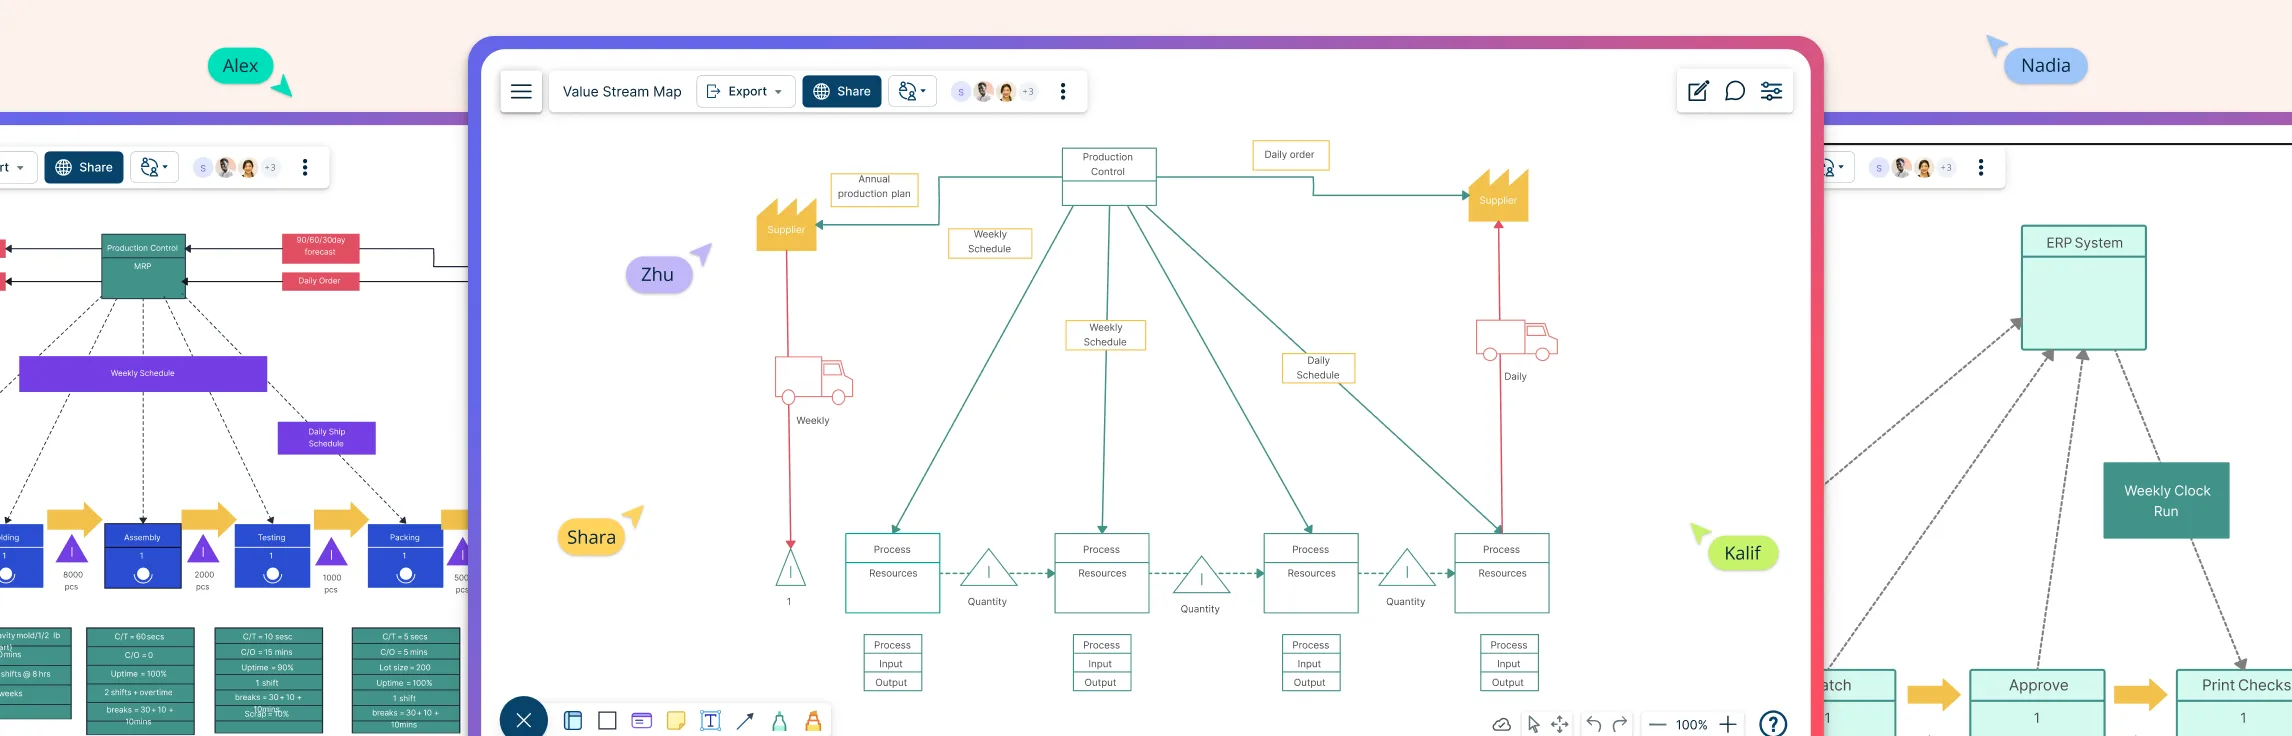
Value Stream Mapping (VSM) is a simple, visual way to understand how work really gets done from start to finish. It helps teams see how materials and information move through a process to deliver a product or service to the customer. A value stream map is the diagram created during this exercise. It lays out each step, along with timing and information flow, so it’s easier to spot delays, waste, and bottlenecks, and find practical ways to make the process faster, smoother, and more customer-focused.
Types of Value Stream Maps
There are generally two main types of value stream maps, commonly used in process improvement processes. They are the current state value stream map and the future state value stream map. These two are typically used together in a continuous improvement approach where the current state map is initially created to understand the existing process while the future state is developed as a roadmap to implement improvements and achieve the desired state.
Current State Value Stream Map (Current State VSM)
The current state VSM shows the current state or the ‘as-is’ state of the value stream process. It visualizes the existing processes including all steps, activities and information flow, inventory levels, lead times and other useful data. The current state VSM serves as the baseline for comparison with the future state map and helps to identify waste, bottlenecks and areas for improvements.
Future State Value Stream Map (Future State VSM)
The future VSM shows the desired or ‘to-be’ state after implementing the improvements. This includes the optimized process flow, reduced waste, improved cycle times, and other crucial improvements identified. The future state VSM visualizes the target state and helps to convey the vision of the desired process improvements.
Segments of a Value Stream Map
A value stream map can be divided into 3 types of segments.
Type | Explanation |
Production or process flow |
|
Information or communication flow |
|
Timelines and travel distances |
|
Steps to Create a Value Stream Map
The following value stream mapping steps break down the process into clear, manageable stages, from defining the scope and mapping the current state to designing improvements and putting them into action. This will allow you to perform a value stream analysis that’s practical, accurate, and easy to improve over time.
Step 1: Assemble Team and Define Scope
Preparation lays the groundwork for effective value stream mapping. First, assemble a cross-functional team and appoint a value stream manager to guide the effort and set clear guidelines. At this stage, define the scope and objectives of the mapping exercise, anticipate potential challenges, and select the product family to map. Since a product family shares the same process steps, each value stream map should focus on a single product family to avoid unnecessary complexity.
Tip: Use a product or service matrix to identify the families of products or services.
Step 2: Create the Current State Map
Begin by gathering data directly from the process. Walk the actual path the product or service follows and sketch a rough outline of the full value stream, including material and information flow. Start mapping from the customer end (downstream) and move upstream through each process step.
As you observe, collect key data such as:
Available work time and planned downtime.
Number of people involved.
Throughput and product variations.
Cycle time and queue time between steps.
Once the data is collected, build the map:
Place the customer and supplier at the top of the map and note their requirements.
Draw the entry and exit points of the value stream.
Add process steps from downstream to upstream and list key attributes.
Insert queue times using consistent units.
Map communication flows and indicate push or pull systems.
Add any remaining data needed to complete the view.
This sequence can be adapted to suit your organization’s value stream and level of detail.
Step 3: Create the Future State Map
Once the current state map is documented and lean metrics (which are needed to help you achieve the lean goals you have set) have been decided, the next step is to draw the future state map. While drawing the current state map you will be able to identify the areas of overproduction and of waste in the current production system. This information you gather becomes the basis of your future state map.
Step 4: Planning and Implementation
The final step focuses on creating an action plan to implement the future state map. Break the future state design into manageable segments and apply improvements one area at a time, with clear, measurable goals and defined checkpoints. Once implemented, the improved process becomes the new current state, allowing the cycle of continuous improvement to continue.
Tip: Hold an annual value stream review to monitor improvements.
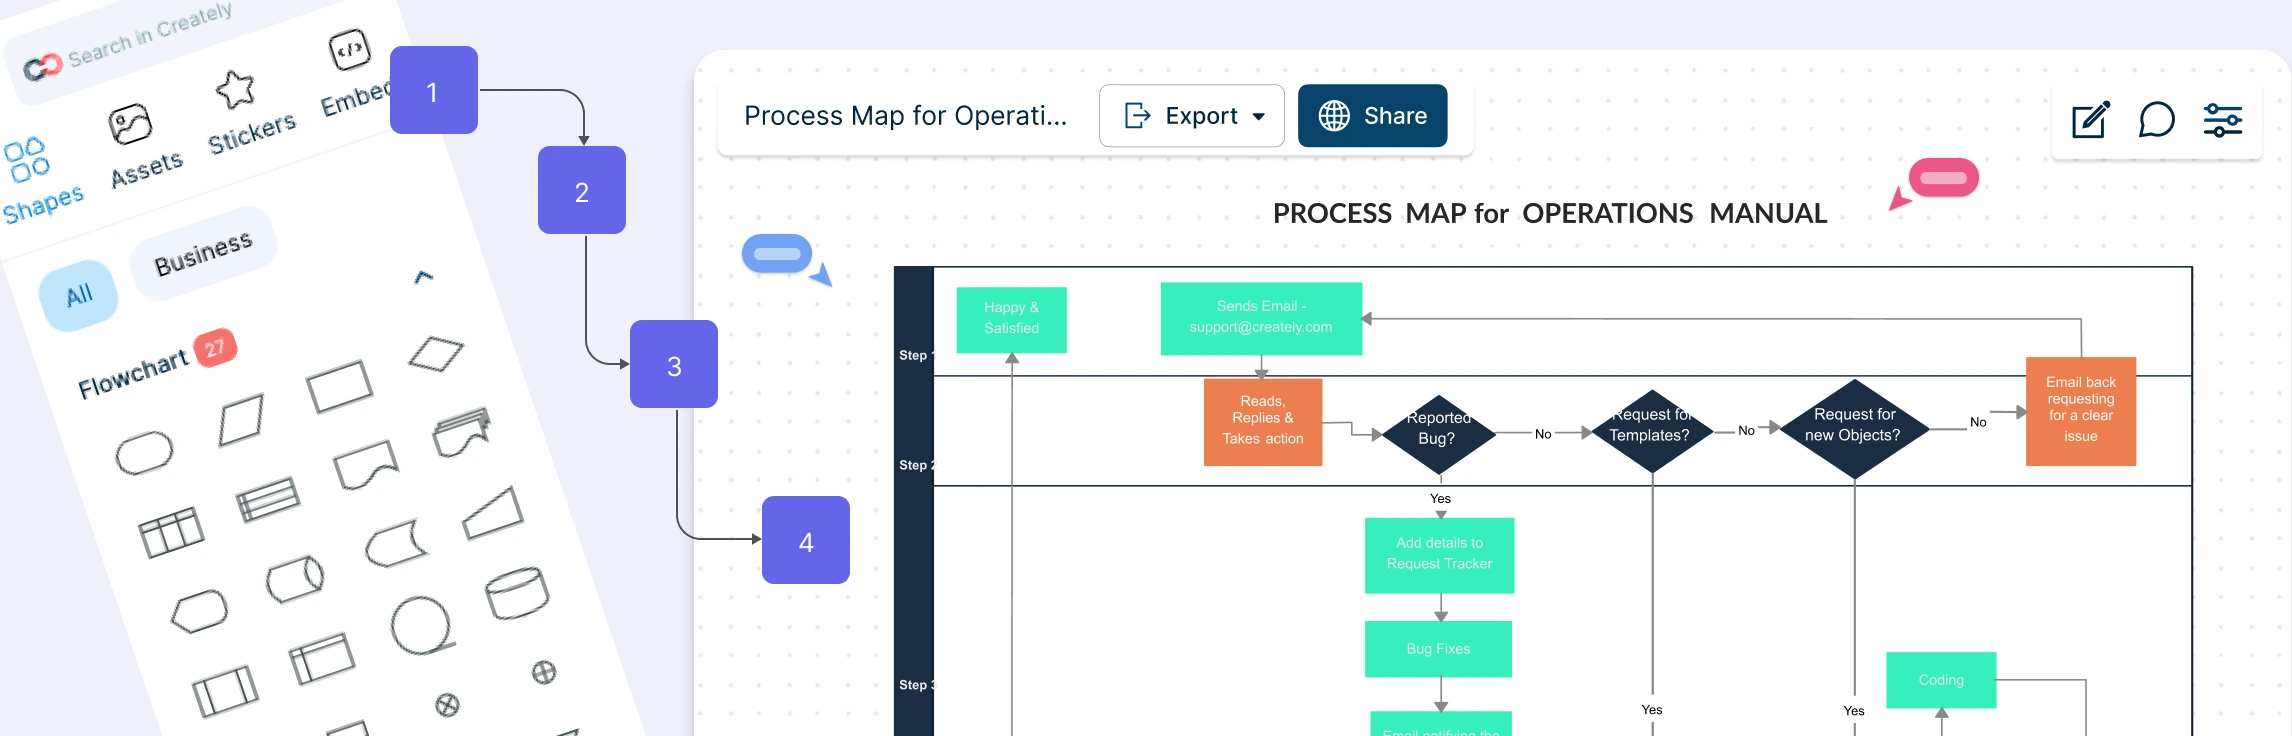
Now that you understand the value stream mapping steps, put them into action with Creately’s value stream mapping software. Build current and future state maps on an infinite canvas using standard VSM symbols, ready-made templates, and real-time collaboration.
Value Stream Mapping Tips and Best Practices
Here are some tips and best practices for creating a VSM.
Define the scope clearly: Identify the start and end points, key processes, activities, and information flows to keep the value stream map focused and relevant to improvement goals.
Involve cross-functional teams: Bring together representatives from all relevant departments to capture diverse perspectives and ensure a complete view of the value stream.
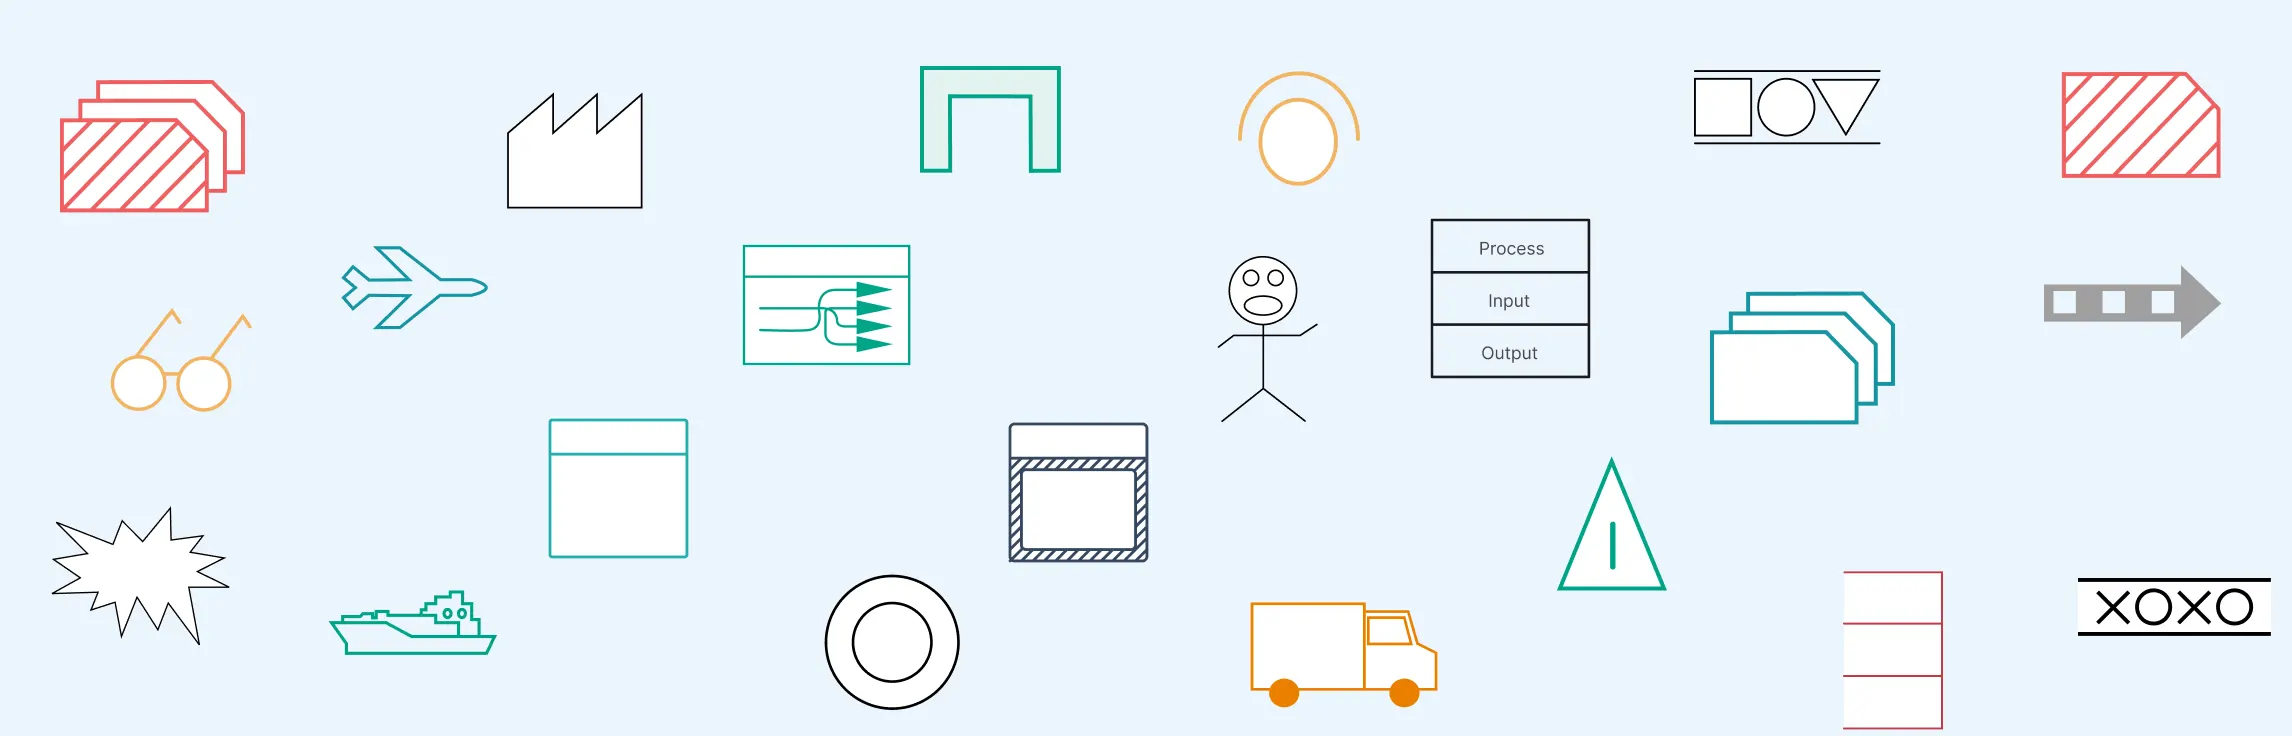
Use standard VSM symbols: Apply consistent, widely recognized value stream mapping symbols to make the map easy to read, understand, and communicate across teams.
Use six sigma value stream mapping for data-driven improvements: Six sigma value stream mapping combines value stream maps with Six Sigma principles to analyze variation, defects, and performance metrics such as cycle time, lead time, and wait time. This approach helps teams identify root causes and prioritize improvements using structured methods like DMAIC.
Collect accurate data: Measure cycle times, lead times, inventory levels, and other key metrics to reflect how the process actually performs.
Collaborate with stakeholders: Engage process owners, operators, and team members to validate insights and build shared ownership of the map.
Focus on customer value: Clearly distinguish value-adding activities from non-value-adding steps and waste to uncover improvement opportunities.
Validate against reality: Observe the real process and verify data on the floor to ensure the map reflects actual conditions.
Keep it up to date: Regularly review and update the value stream map as changes are implemented and processes improve.
Value Stream Map Templates


More Value Stream Mapping Templates
Frequently Asked Questions About VSM
How do I develop an action plan based on the value stream map findings?
Once you have identified the required improvements from the value stream map, you can develop an action plan to address the areas. Here are some tips to follow:
- The action plan should include specific tasks, timelines and responsible parties.
- Prioritize the tasks based on their potential impact and feasibility.
- Ensure the tasks are SMART.
- Assign accountability for each task.
- Regularly review progress.
How often should I update my value stream map?
What are some common misconceptions about value stream mapping?
- It is only applicable to manufacturing.
- A one-time activity rather than a continuous process.
- Only useful for cost reduction.
- Complex and difficult to implement.
How can I effectively engage my team in the VSM process?
- Clearly communicate the purpose and benefits of the process.
- Involve team members in data collection and analysis.
- Encourage them to provide feedback and input.
- Empower the team members to identify improvement opportunities.
- Provide training and support on value stream mapping principles and tools.
Can VSM be applied in non-manufacturing or service industries?
What are the benefits of value stream mapping?
What are common value stream mapping mistakes to avoid?
Resources
Dinis-Carvalho, Jose, et al. “Waste Identification Diagram and Value Stream Mapping.” International Journal of Lean Six Sigma, vol. 10, no. 3, 16 Aug. 2019, pp. 767–783, https://doi.org/10.1108/ijlss-04-2017-0030.
Mojib Zahraee, Seyed, et al. “Lean Manufacturing Implementation through Value Stream Mapping: A Case Study.” Jurnal Teknologi, vol. 68, no. 3, 1 May 2014, https://doi.org/10.11113/jt.v68.2957.