If you want to know how to do a Venn diagram in Google Docs, then this guide is for you. Discover what Venn diagrams are, how to create one in Google Docs, and understand the limitations of Google Docs for making them. We also dive into a better alternative, and compare the two methods.
What is a Venn Diagram?
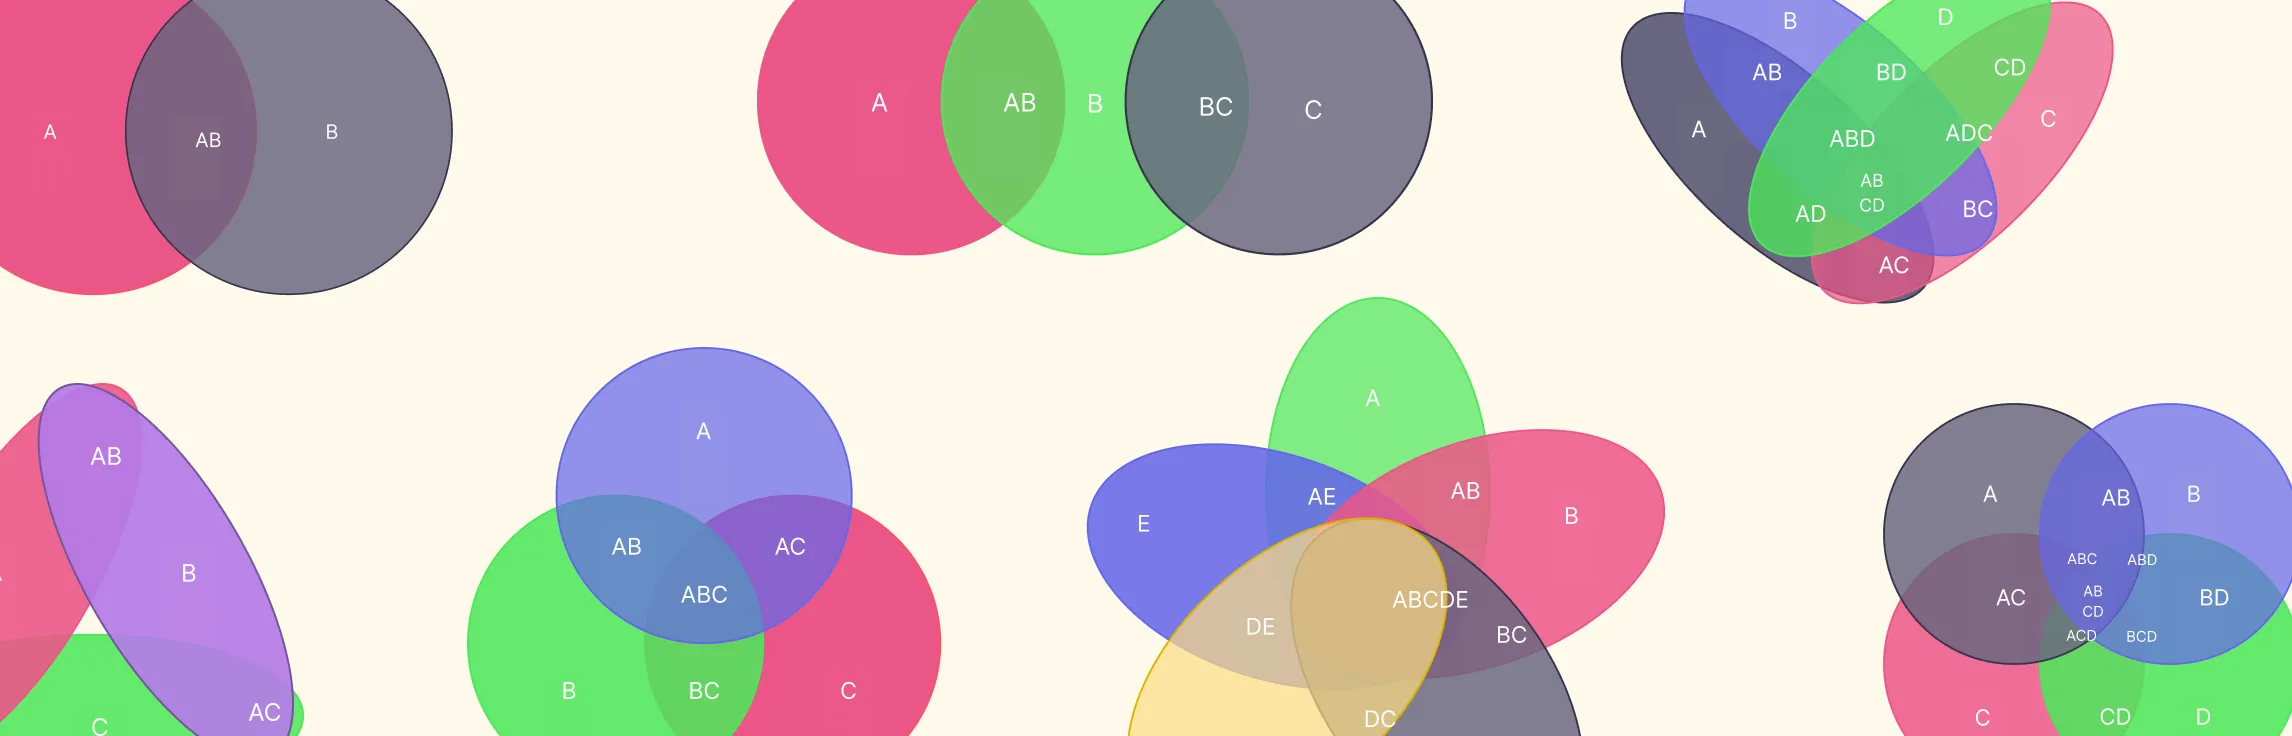
A Venn diagram is a simple visual tool that compares two or more groups by showing where they overlap and where they differ. It’s made of circles that intersect to highlight shared characteristics in the overlapping sections and unique traits in the separate areas. Commonly used in mathematics, logic, data analysis, and problem-solving, Venn diagrams make it easy to understand relationships and compare information quickly.

How to Create a Venn Diagram on Google Docs
Follow these steps to learn how to draw a Venn diagram in Google Docs.
Step 1: Insert the drawing canvas
Go to Insert → Drawing → + New to open the drawing editor. This serves as your workspace since Google Docs doesn’t include ready-made diagram templates.

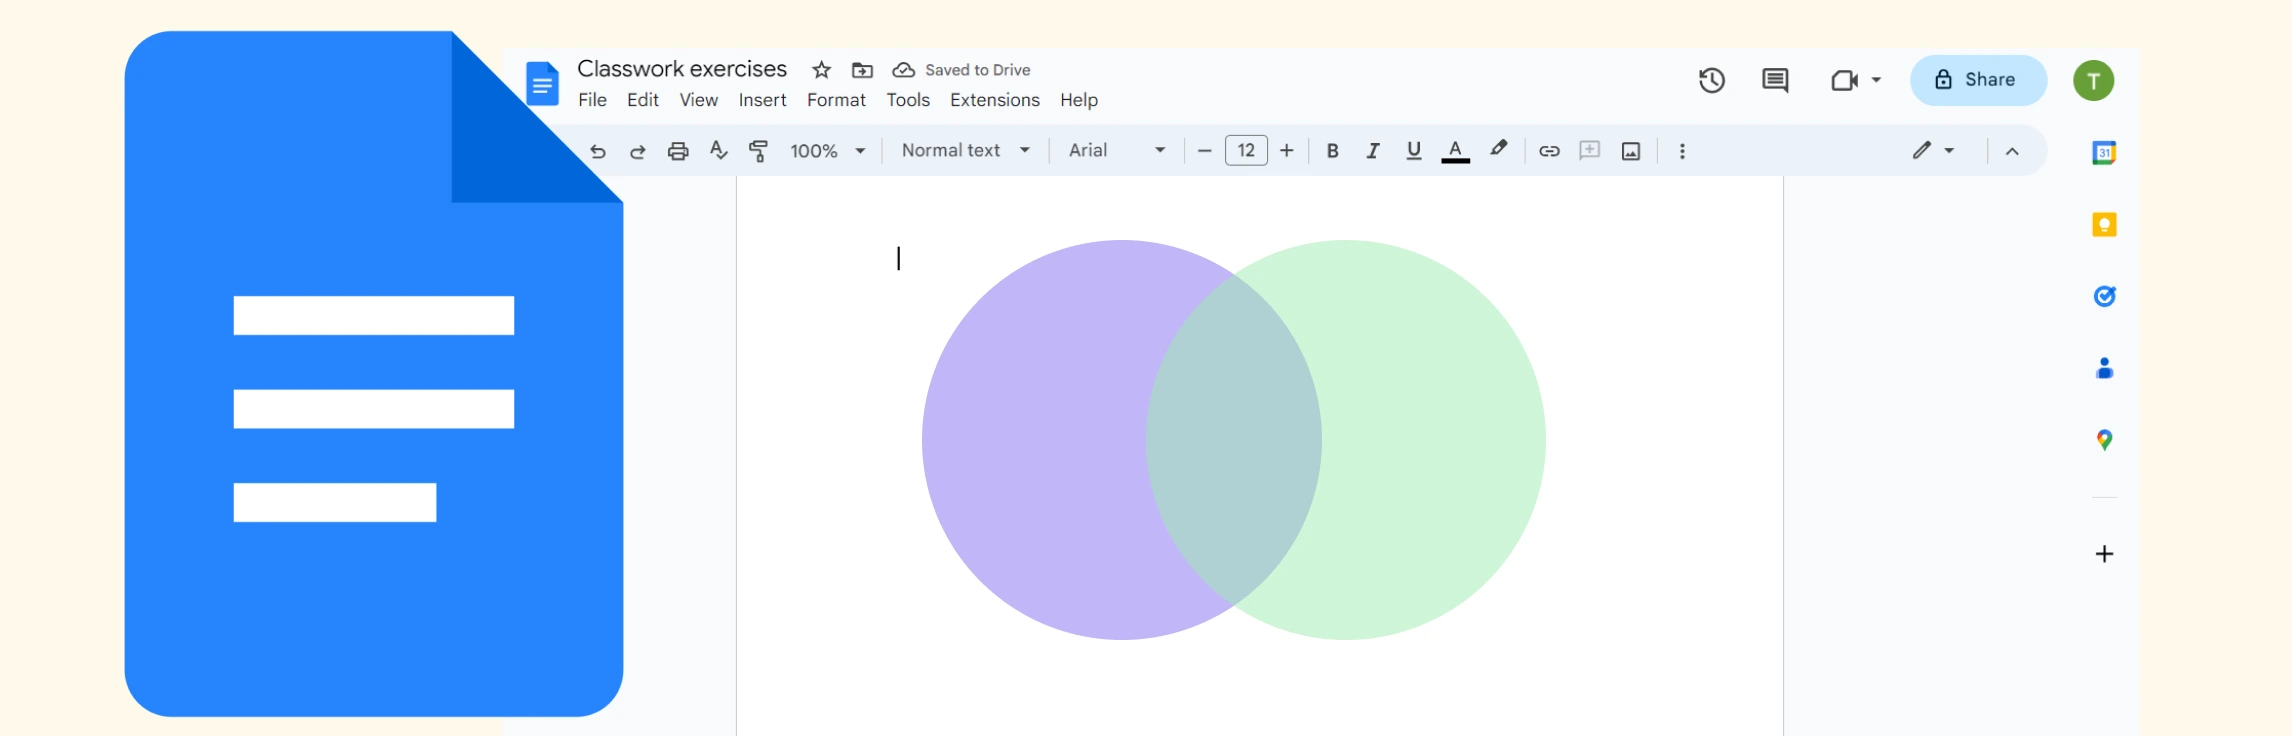
Step 2: Add the circles
Choose Shape → Shapes → Oval and draw your first circle. Duplicate it to create the second circle, then overlap them. Adjust fill transparency so the shared area is clearly visible.

Step 3: Label each group
Use the Text box tool to add labels to each circle. Positioning is manual, so small adjustments may be needed for clean alignment.

Step 4: Add comparison points
Insert additional text boxes inside the circles and their overlapping area to capture similarities and differences. Without auto-alignment, you’ll need to place each text element carefully.

Step 5: Format and insert the diagram
Customize colors, borders, and text styles, then click Save and Close to drop the diagram into your document. Editing is manual, so double-click the diagram anytime to reopen the drawing canvas.

Step 6: Share or export your diagram
Use Share to collaborate with others in real time or go to File → Download to export the document. Keep in mind that Google Docs exports the diagram as part of the page rather than as an independent graphic.

Limitations of Creating a Venn Diagram in Google Docs
Now that you know how to add a Venn diagram in Google Docs, let’s look at the limitations of this method.
No built-in Venn diagram templates: Everything must be created manually using the Drawing tool, which can feel slow for more detailed diagrams.
Basic shapes and formatting options: Circles, colors, and text styling are limited, making it harder to create polished or visually consistent diagrams.
No automatic alignment or snapping: Text boxes and shapes don’t auto-align, so placing labels and comparison points requires precise manual adjustments.
Editing requires reopening the Drawing tool: Any update means re-entering the canvas, which interrupts workflow and makes iterative changes less smooth.
Limited scalability: The Drawing canvas isn’t ideal for larger or multi-set Venn diagrams, as spacing and layout control become challenging.
Exporting isn’t diagram-specific: You can’t export the Venn diagram as a standalone graphic—only the entire document or screenshot workarounds.
These limitations can make even simple Venn diagrams time-consuming to make in Google Docs. This is why a purpose-built diagramming tool like Creately is needed to handle the layout, styling, and structure for you.
Why Creately is the Best Alternative for Making Venn Diagrams
With tools built specifically for visual diagramming, Creately’s free Venn diagram maker gives you everything you need to create clear, professional diagrams far more efficiently than Google Docs’ basic drawing canvas. Here’s what you get:
Diagramming & Design Features
Precise shape control: Resize, overlap, and position circles with accuracy that’s difficult to achieve in Google Docs.
Ready-made Venn templates: Start instantly with 2-set, 3-set, 4-set, and multi-set layouts to build a Venn diagram.
Flexible styling options: Easily customize colors, transparency, borders, and text formatting.
Consistently polished visuals: Shapes stay perfectly aligned even as you edit or expand your diagram.
Collaboration & Workflow Features
Real-time collaboration: Work seamlessly with your team using multi-cursor editing and live comments.
Rich documentation: Add notes, attach files, and link additional information directly to diagram elements.
Version history built-in: Track every change and restore previous versions whenever needed.
Ease of Use & Flexibility
Drag-and-drop simplicity: Build and update diagrams without dealing with manual alignment or formatting issues.
Infinite canvas: Expand your diagram freely with no page-size limitations.
Great for complex work: Create advanced or multi-layered Venn diagrams that are nearly impossible to manage in Google Docs.
Read our how to create Venn diagrams guide to learn how to use Creately for making these diagrams quickly and easily.
Creately Vs Google Docs Venn Diagram Features Comparison
Here’s a comparison table highlighting how Creately stacks up against the built-in drawing tools in Google Docs for creating Venn diagrams.
Feature | Google Docs | Creately |
Built-in Venn diagram templates | No – circles must be created manually using the Drawing canvas | Yes – includes ready-made 2-set, 3-set, 4-set, and multi-set templates |
Precise circle control (size, overlap, positioning) | Manual adjustments with no snapping or alignment aids | Accurate control with auto-alignment and smart guides |
Styling options for circles | Basic fill and border options; limited transparency settings | Full customization: colors, opacity, borders, themes, and more |
Label placement and alignment | No auto-alignment; all text boxes must be placed manually | Smart alignment with anchored labels that stay in place |
Multi-set or complex Venn diagrams | Difficult and time-consuming to build accurately | Supports advanced, nested, and multi-layered Venn diagrams |
Canvas space | Restricted to a small drawing canvas | Infinite canvas with unlimited room to expand diagrams |
Editing workflow | Requires reopening the Drawing tool each time, interrupting flow | Edit directly on the canvas with immediate updates |
Real-time collaboration on the diagram | Limited — collaborators cannot co-edit the drawing simultaneously | Full real-time multi-cursor editing and comments |
Exporting the Venn diagram | Export only as part of the document; standalone exports require workarounds | Export directly as PNG, SVG, PDF, or embed as needed |
Free Venn Diagram Templates to Get Started


Helpful Resources for Creating Venn Diagrams
Learn how to make Venn diagrams using Microsoft Word.
Learn how to make Venn diagrams using Microsoft Excel.
Understand the differences between Venn diagrams and Euler diagrams.
Discover all the different symbols used in Venn diagrams.