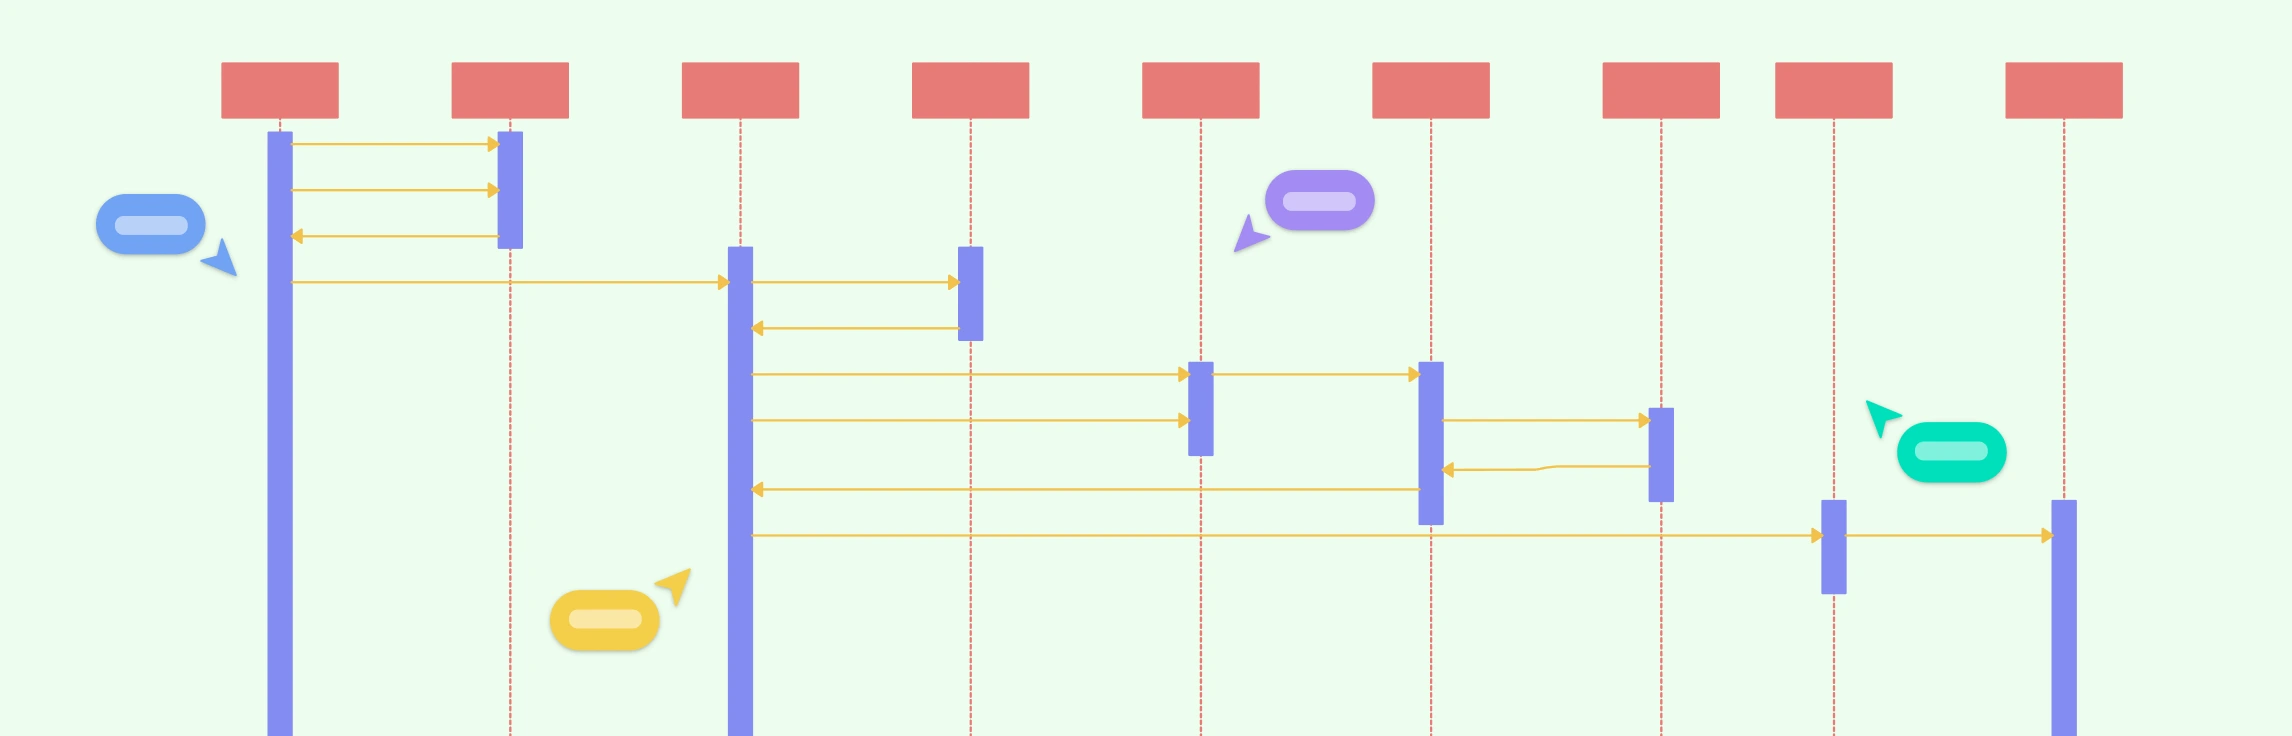
As your system designs grow more complex, your sequence diagrams can quickly become cluttered with repeated interactions and overlapping lifelines. If you’ve ever found yourself redrawing the same sequences across multiple diagrams or struggling to keep everything consistent, you’re not alone. That’s where the interaction occurrence in UML 2 comes in, a powerful tool that helps you simplify, reuse, and organize complex interactions effortlessly. In this guide, we’ll explore what an interaction occurrence is, how it works, and why it’s essential for creating scalable, easy-to-maintain UML models.
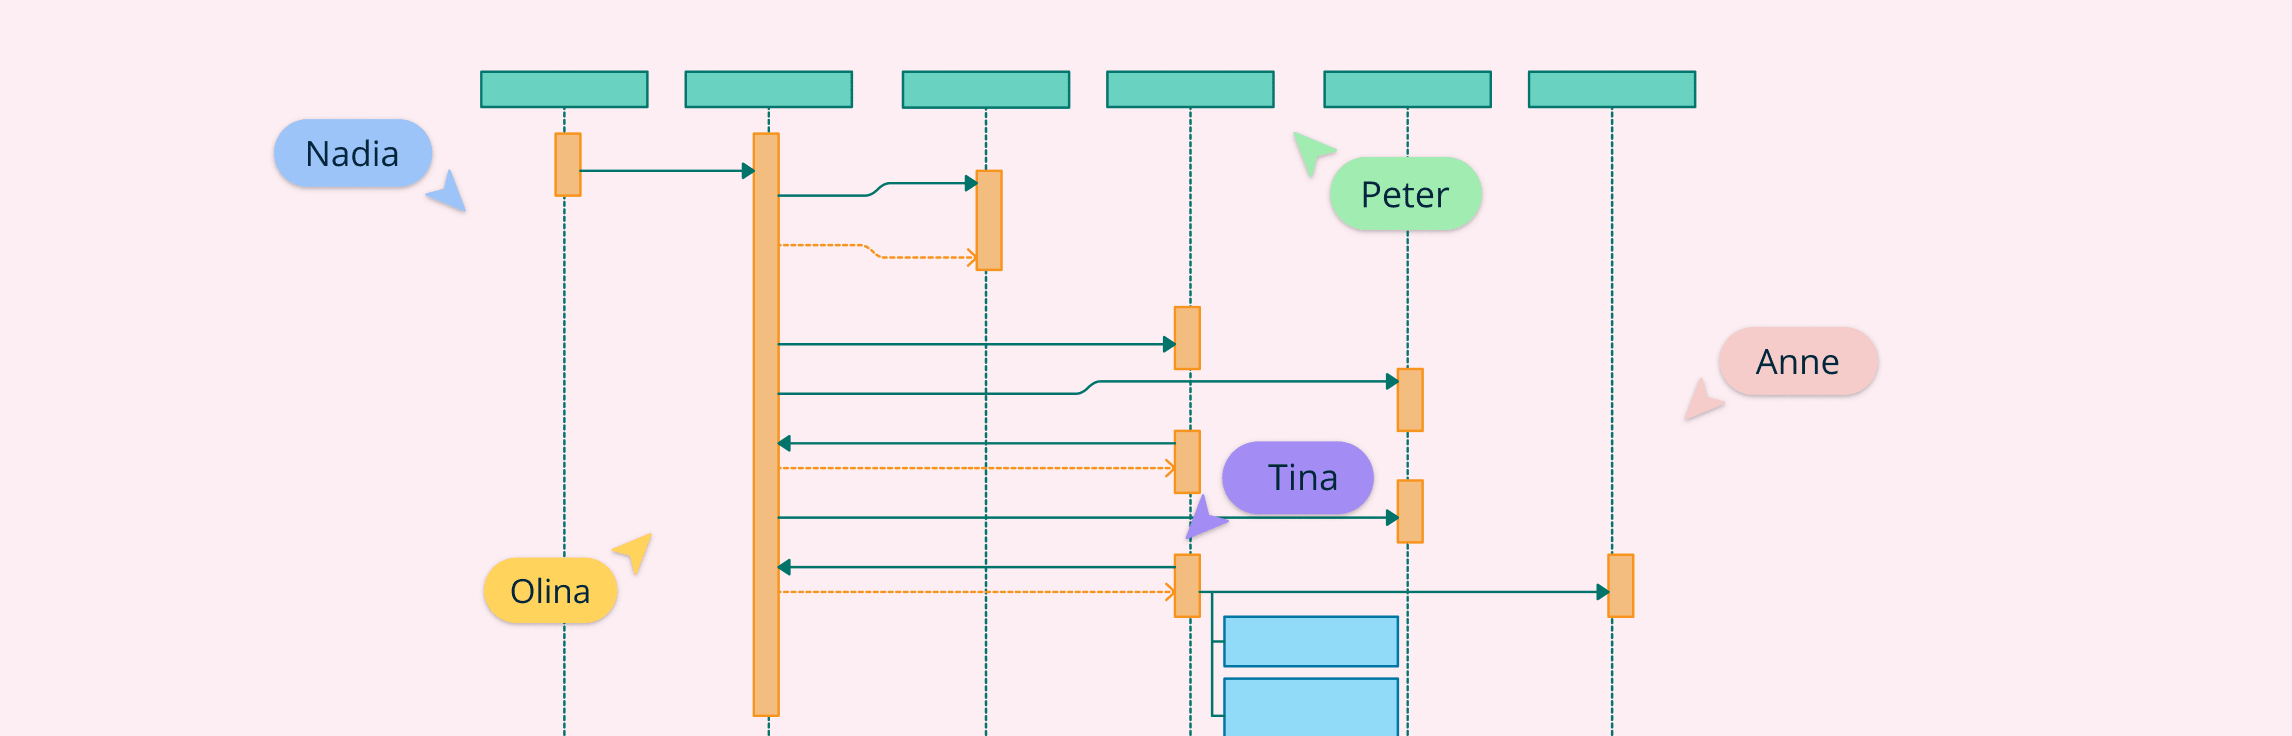
When working on complex systems, sequence diagrams can quickly turn into a tangled web of interactions, especially when multiple components or subsystems need to communicate. If you’ve ever found yourself squinting at overlapping message lines or losing track of how data moves between diagrams, you’re not alone. That’s where sequence diagram gates come in. These clever UML elements simplify message passing between diagrams, helping you keep your models clean, modular, and easy to understand. In this guide, we’ll break down what sequence diagram gates are, how they work, and how you can use them to create clearer, more efficient UML diagrams.
In today’s fast-paced digital systems, tasks rarely happen one at a time. Whether it’s an online booking system checking seat availability while processing payments, or an app updating data while sending notifications, concurrency is everywhere. Yet, many UML designers struggle to clearly represent these simultaneous operations. That’s where sequence diagram parallel tasks come in. By using the parallel combined fragment, you can model concurrent processes visually, making your system design more accurate, efficient, and easy to understand.
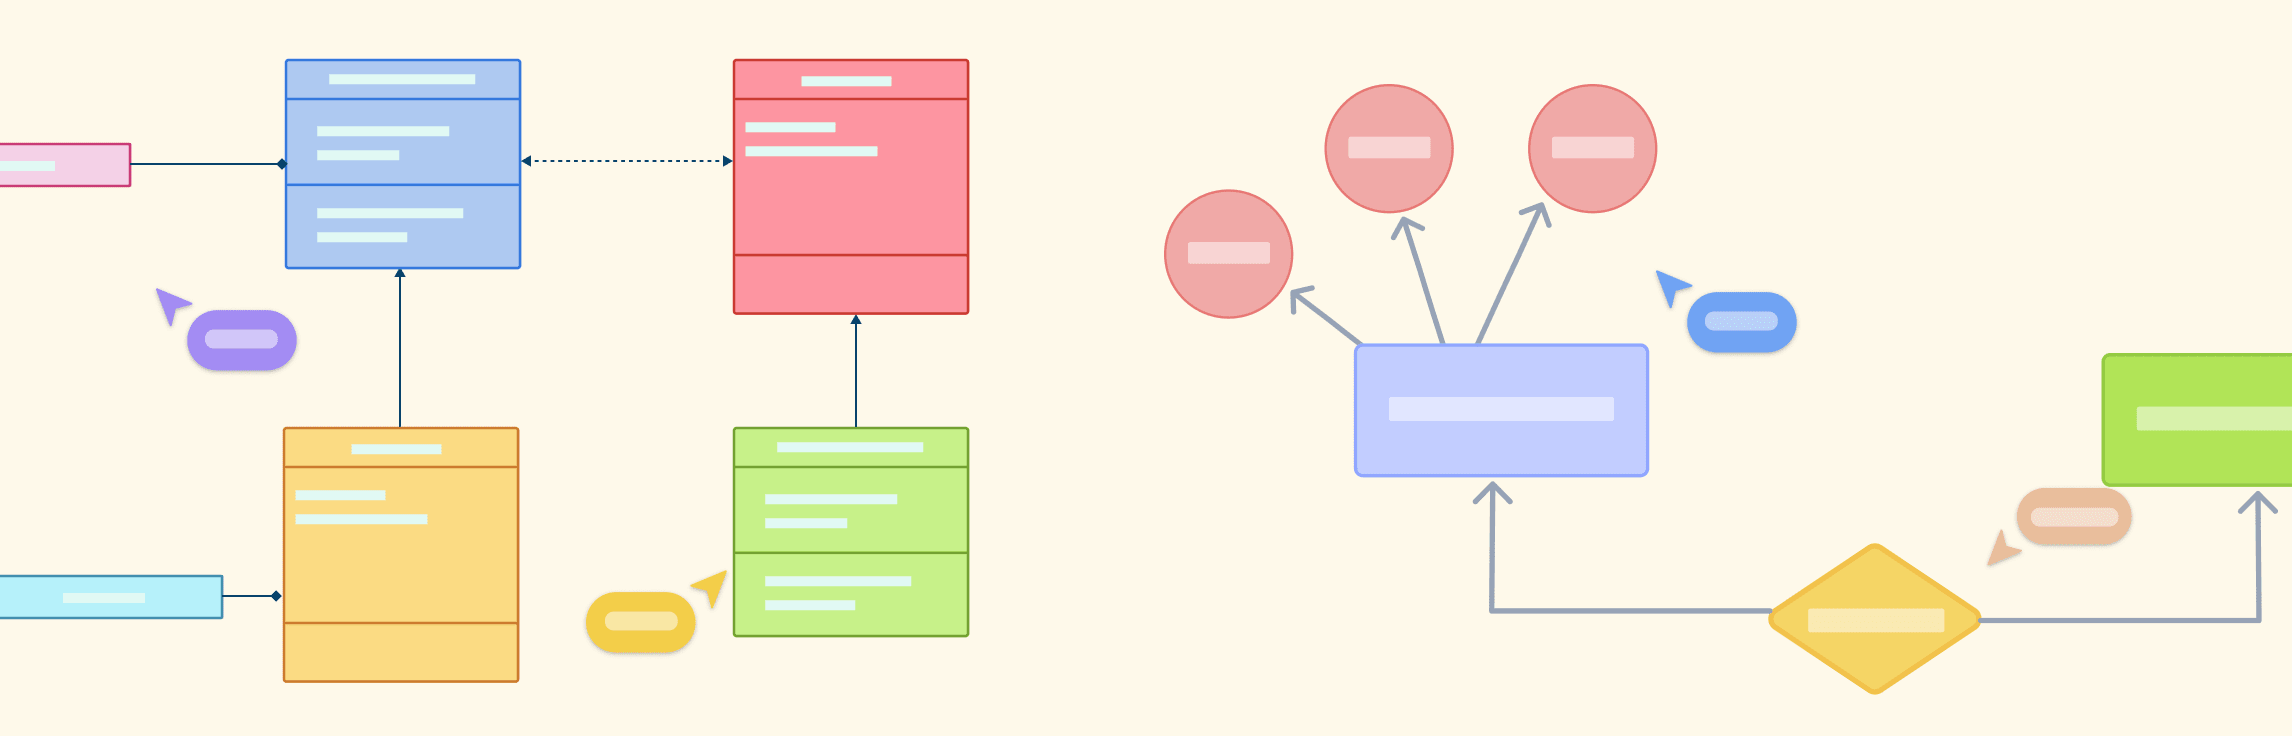
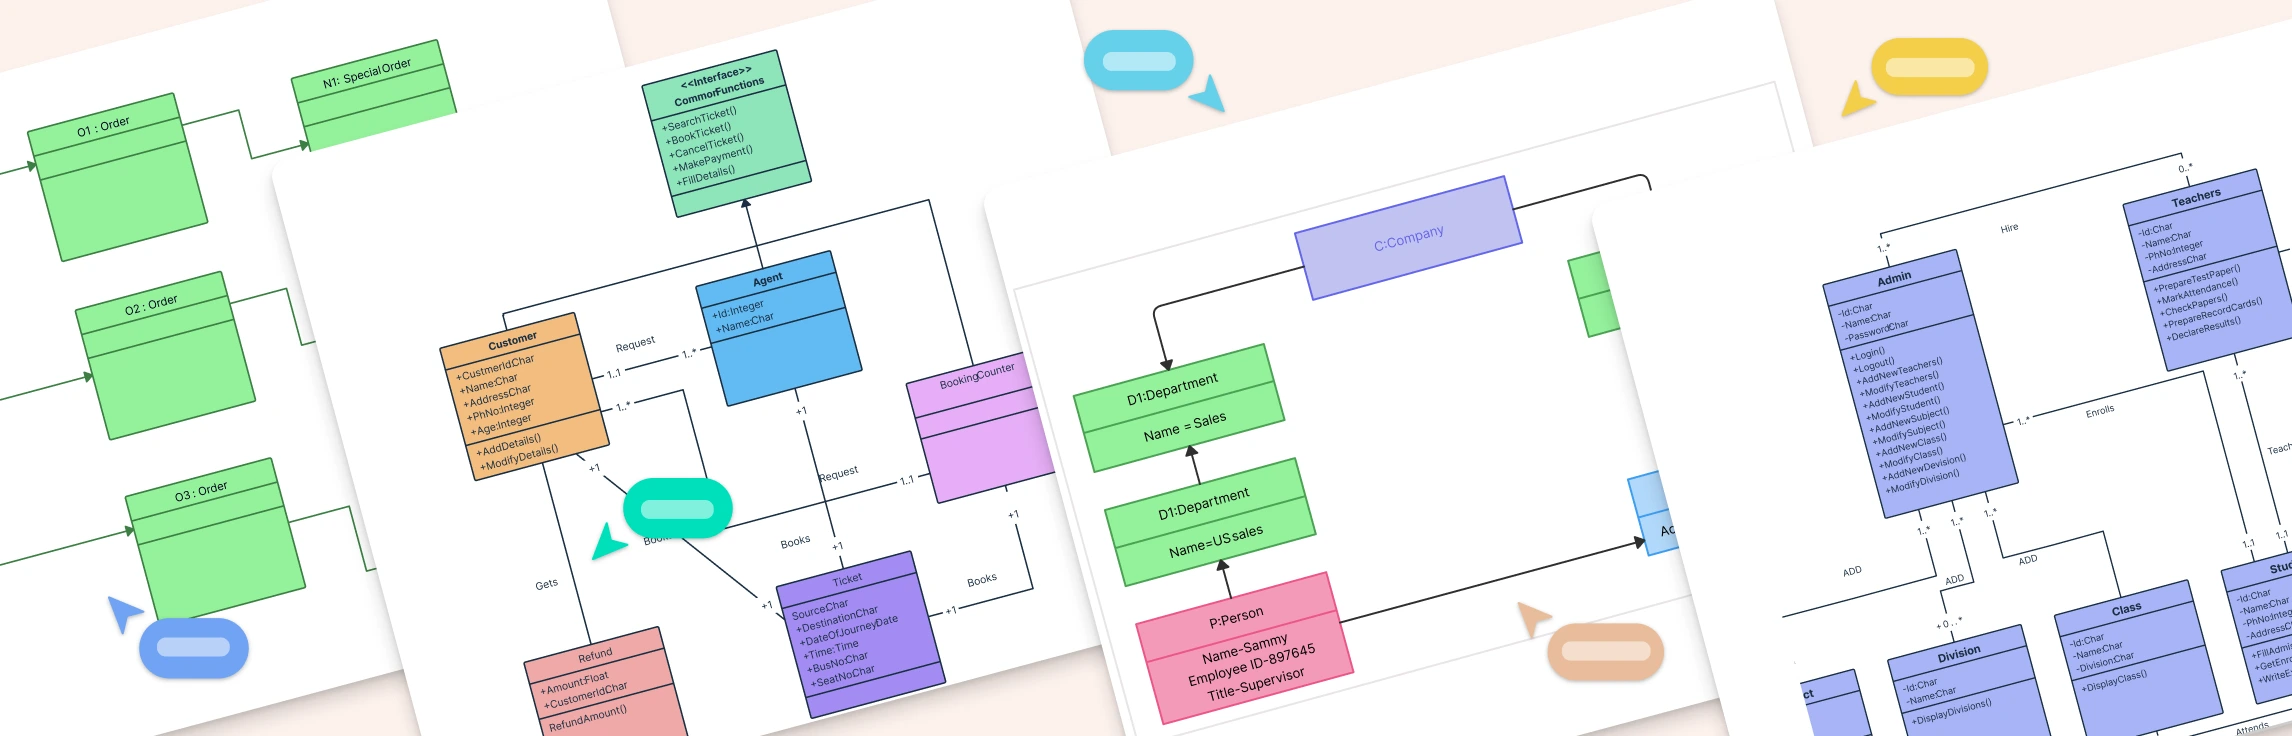
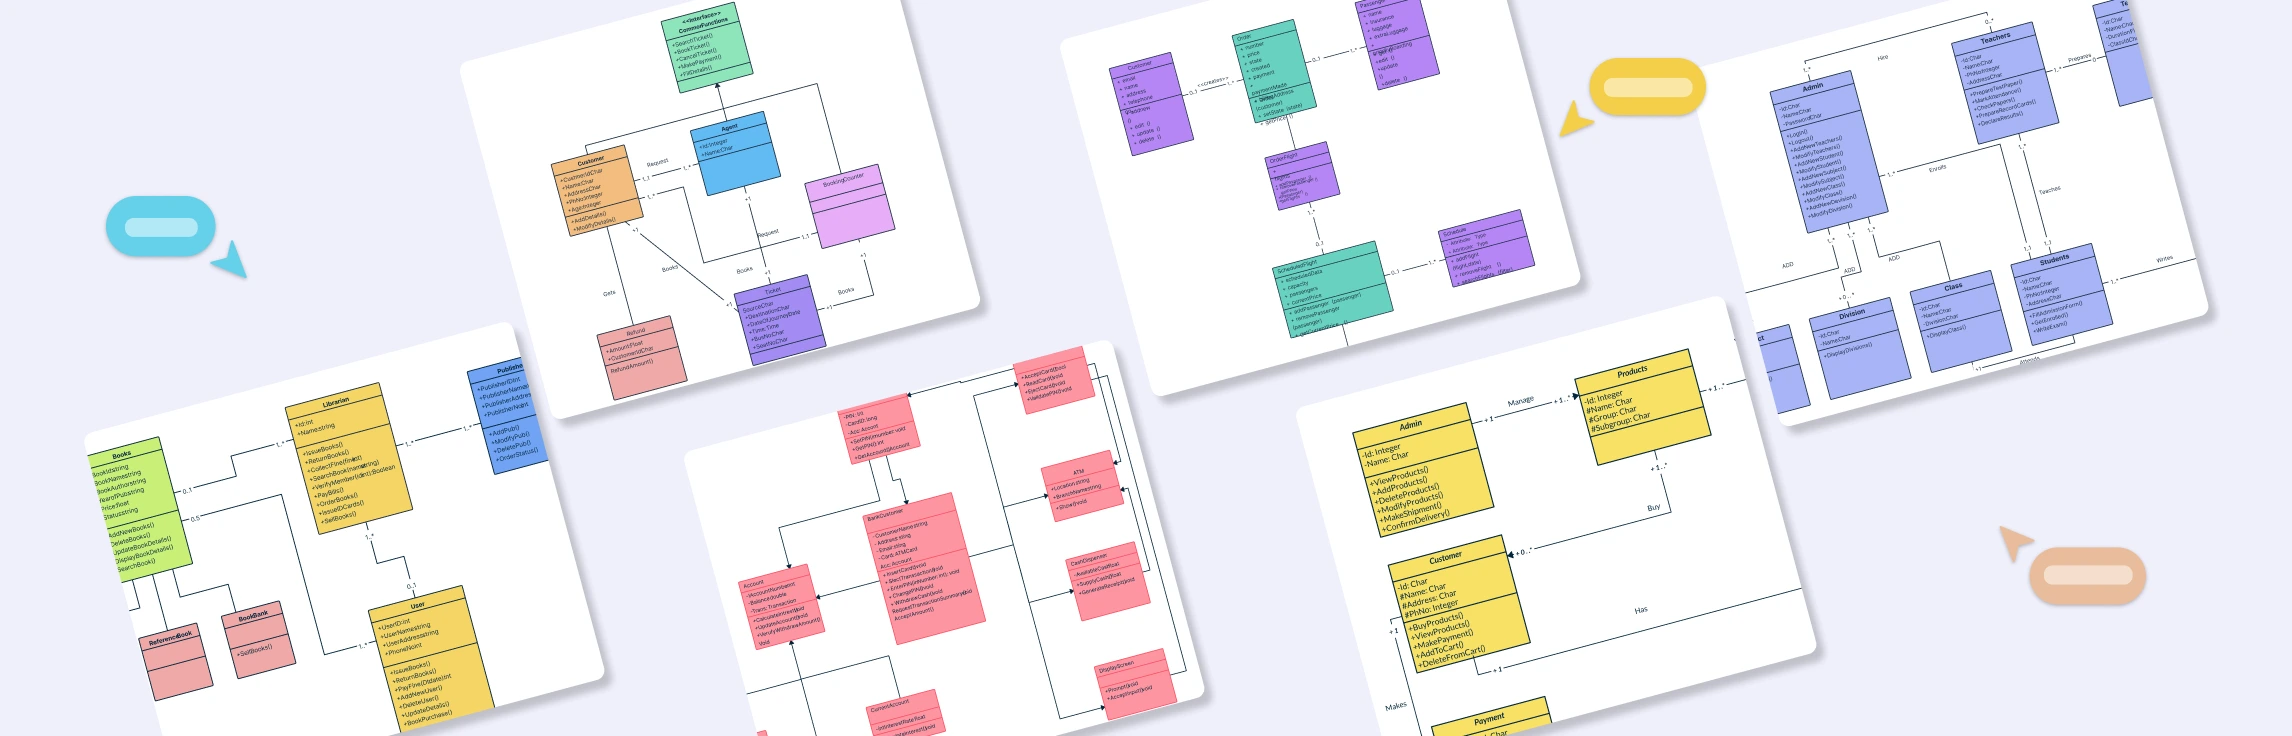
Class diagrams are a fundamental part of UML notation, used to model the static structure of a system, including classes, interfaces, relationships, inheritance, and object interactions. Whether you’re a beginner or an experienced developer, having a UML Class Diagram Cheat Sheet ensures your diagrams are clear, consistent, and easy to understand.
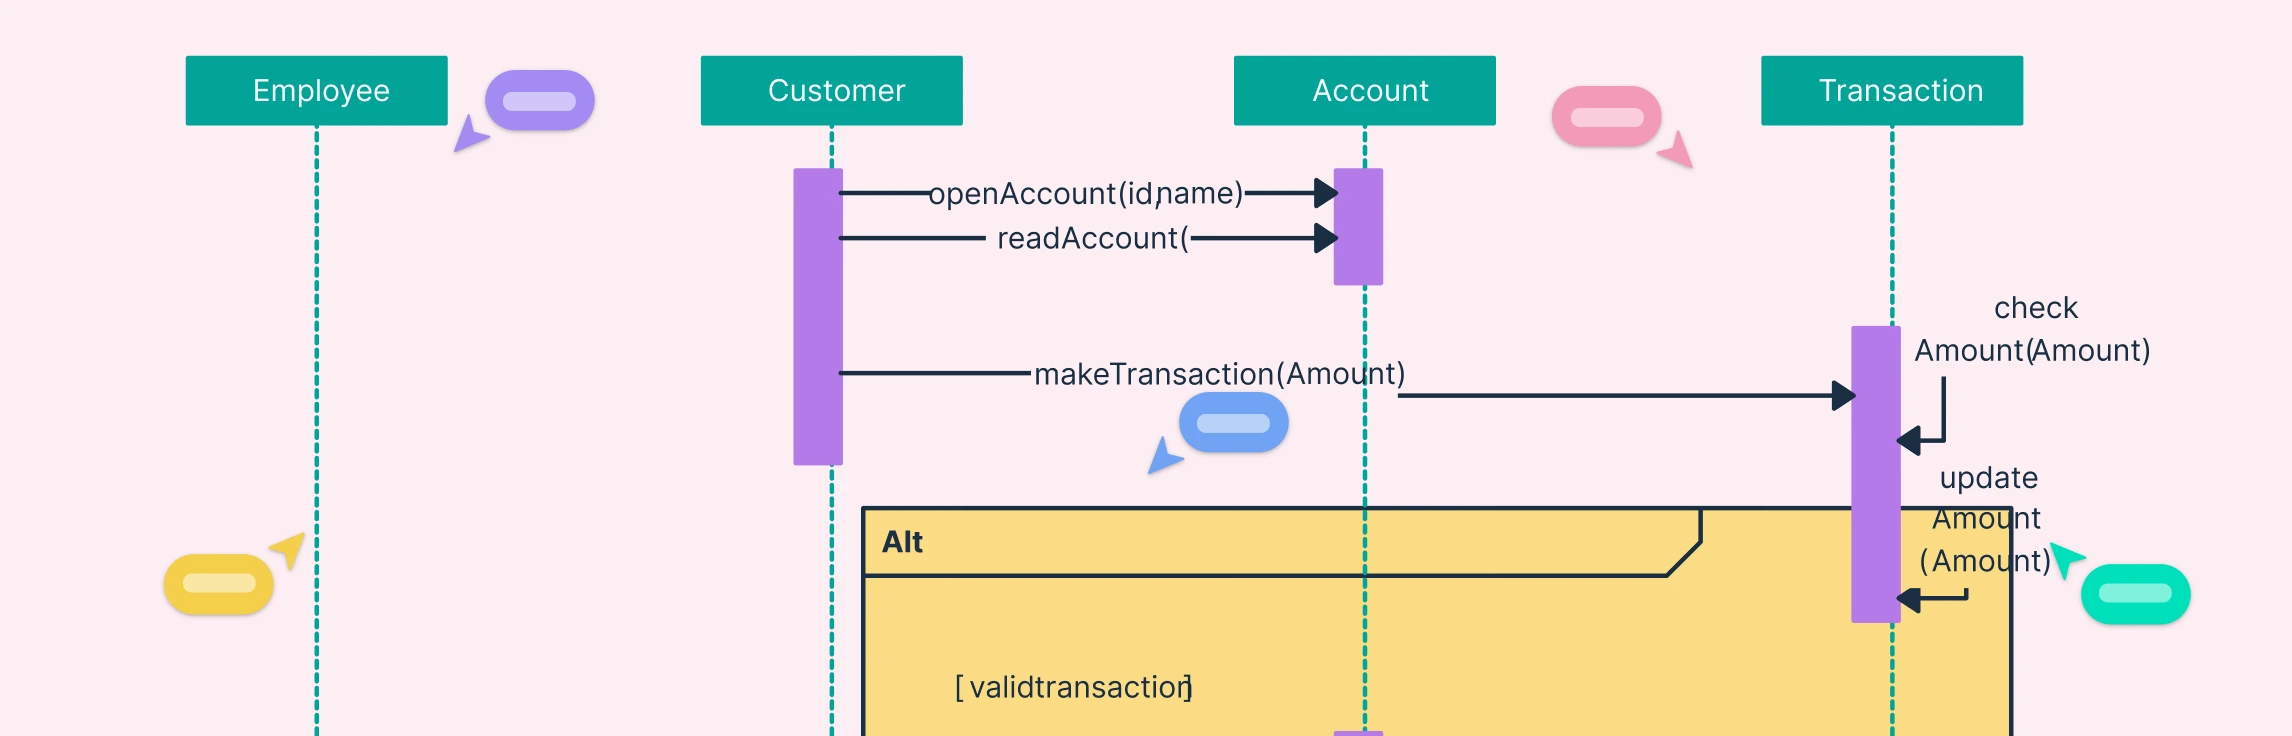
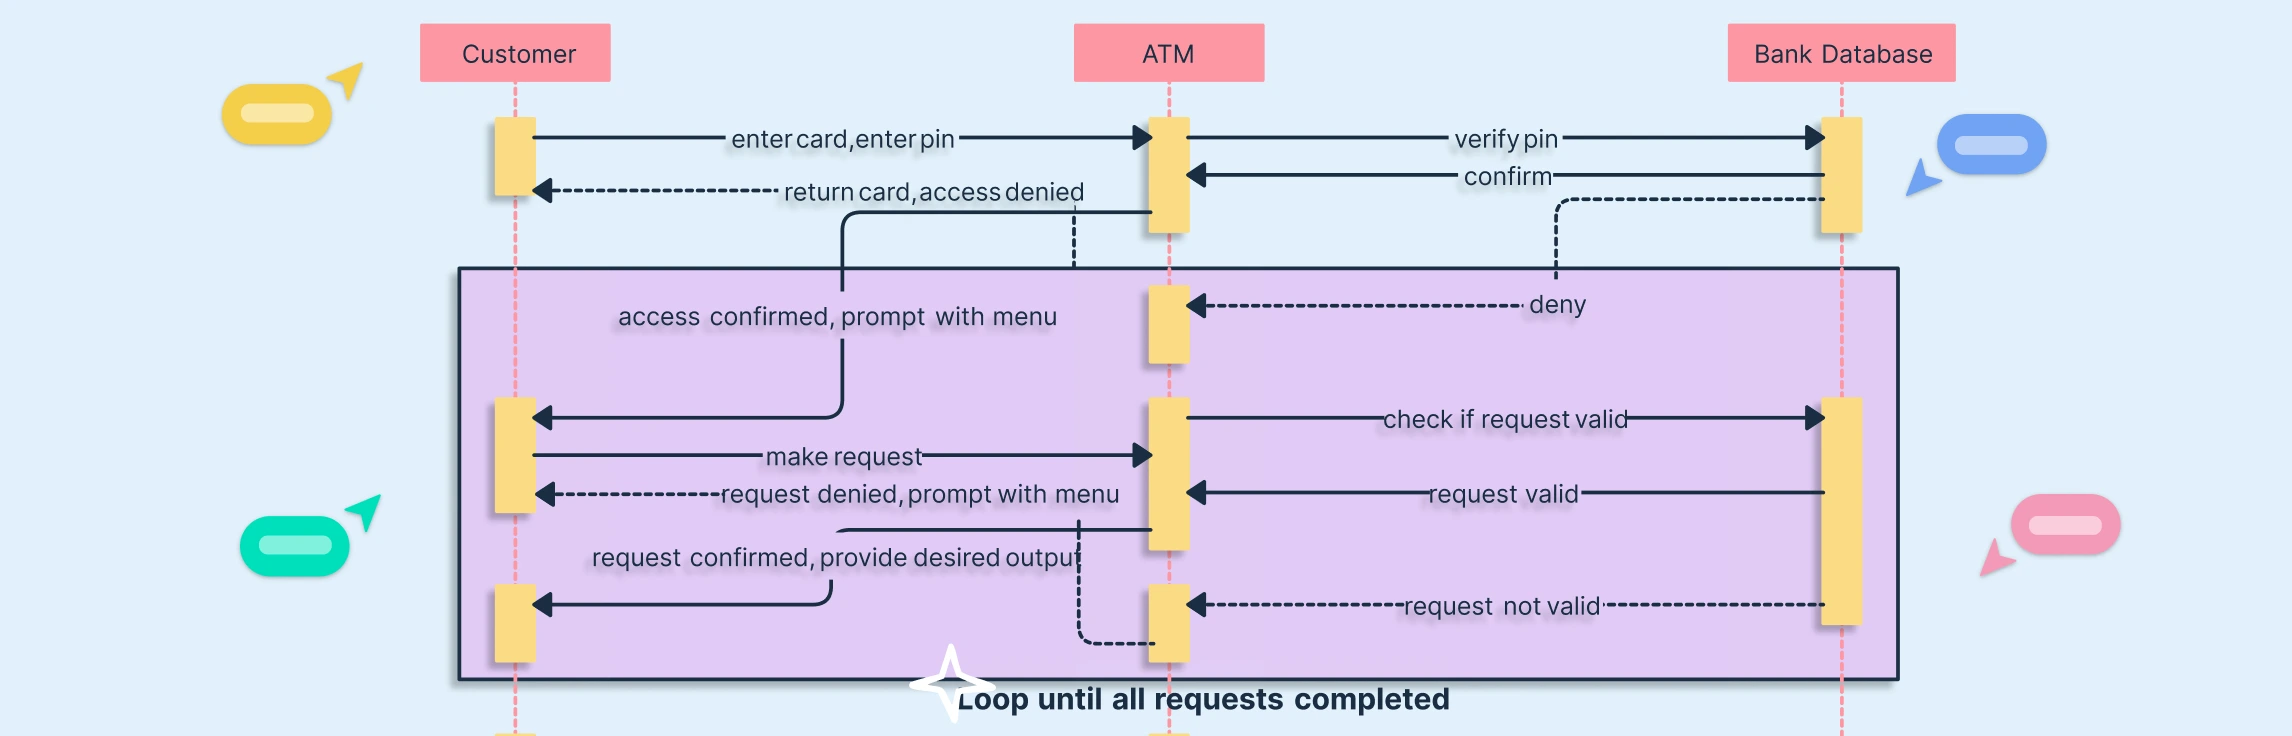
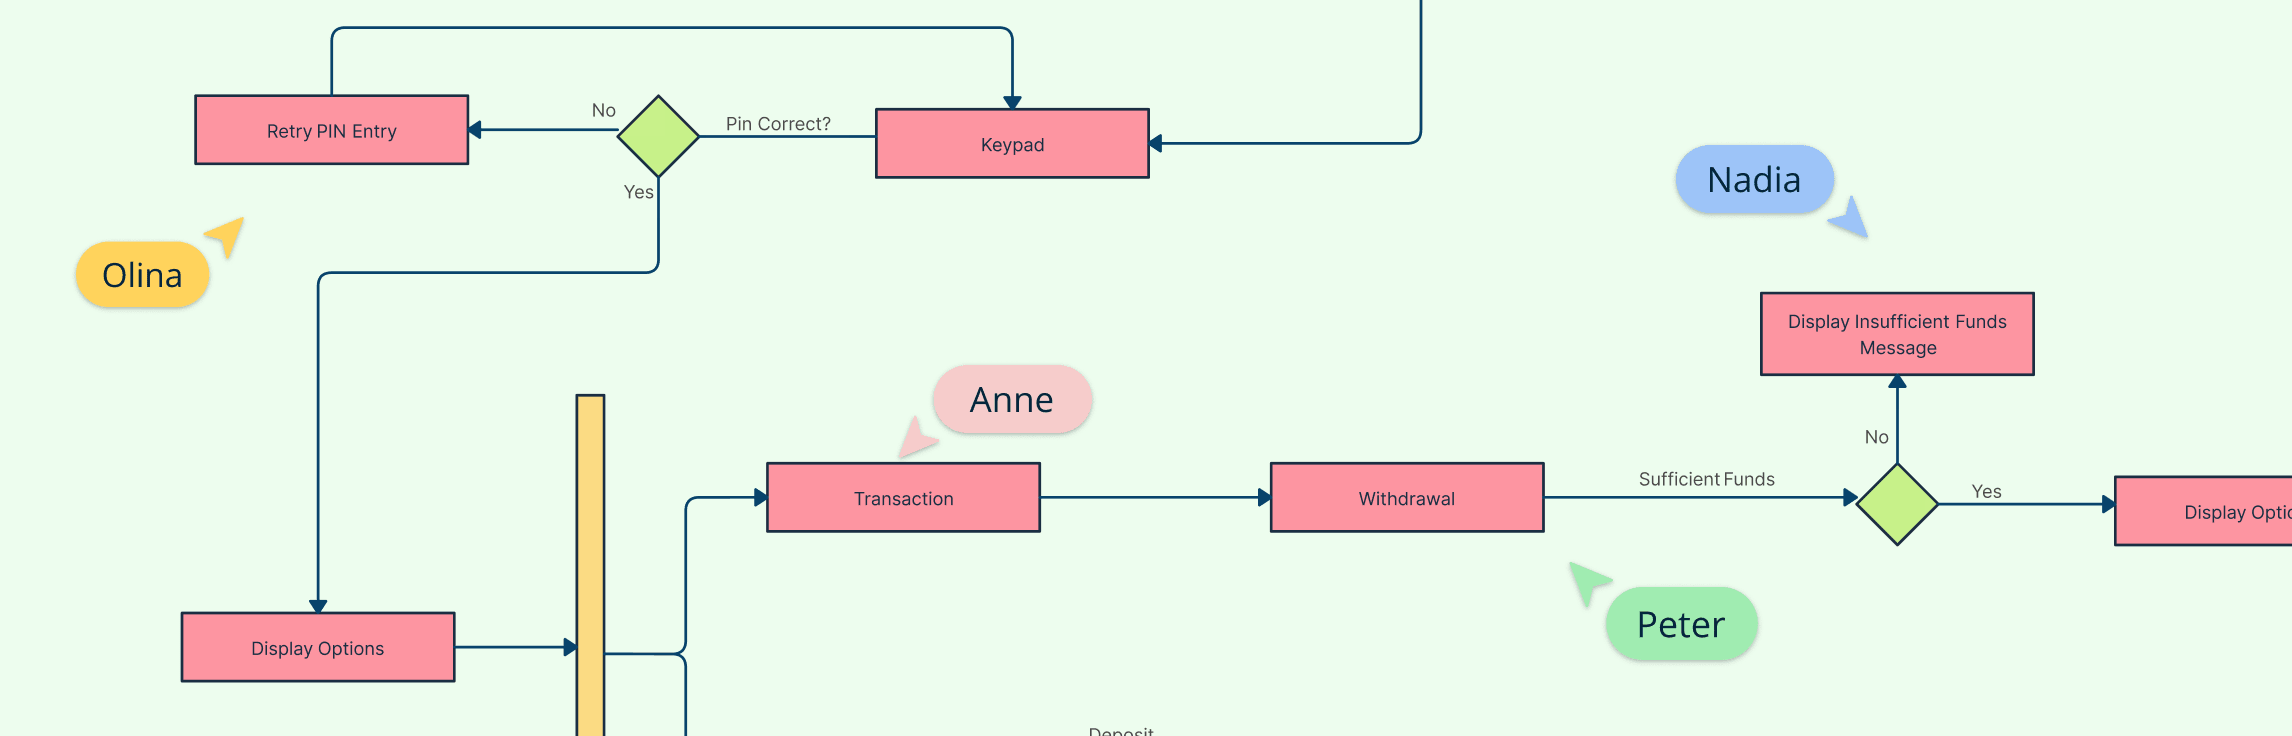
Repetitive processes are a core part of most software systems, from multiple login attempts to repeated data validations. Sequence diagram loops make these interactions easy to understand and communicate. By visually representing repeated actions, developers and stakeholders can quickly grasp system behavior, avoid errors, and streamline workflow design. Whether you’re designing an ATM, an online exam platform, or an e-commerce system, understanding how to model loops in sequence diagrams is a game-changer.
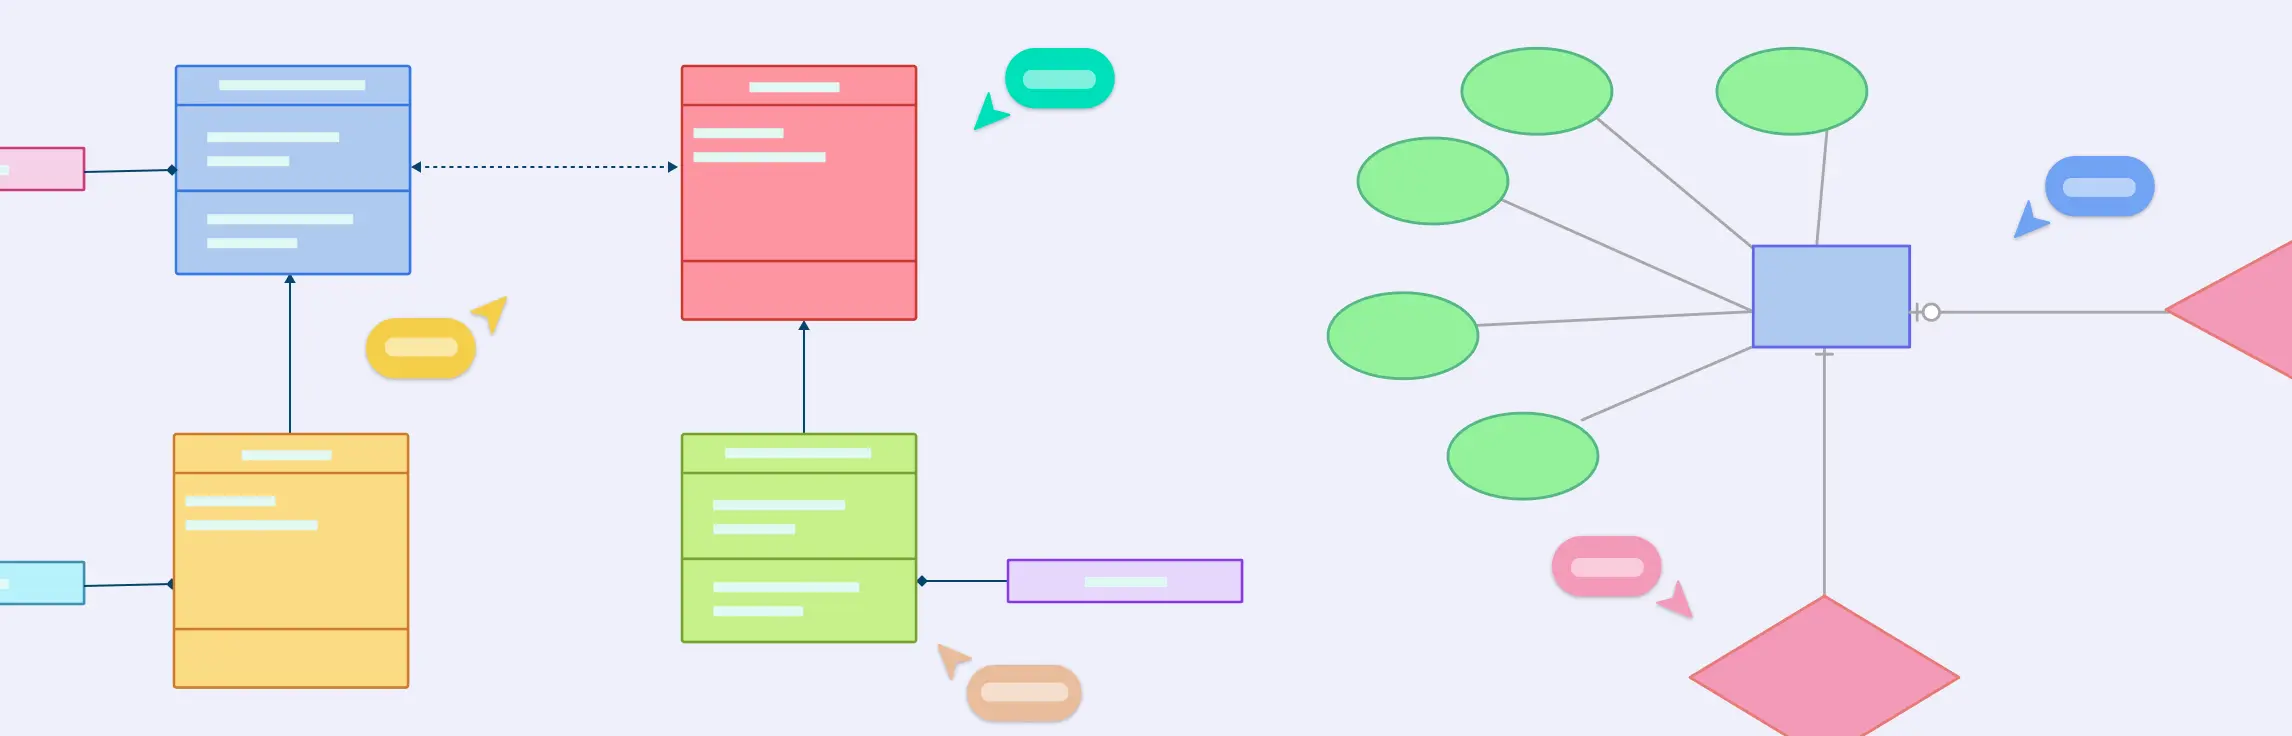
If you’ve ever confused an ERD with a class diagram, you’re not alone. ERDs show how data is structured in a database, while class diagrams show how that data behaves in software. Use ERDs for database design and class diagrams for object-oriented planning. This guide breaks down their differences, notations, mapping patterns, conversion steps, real-world examples, a migration checklist, and templates to build your own models quickly.
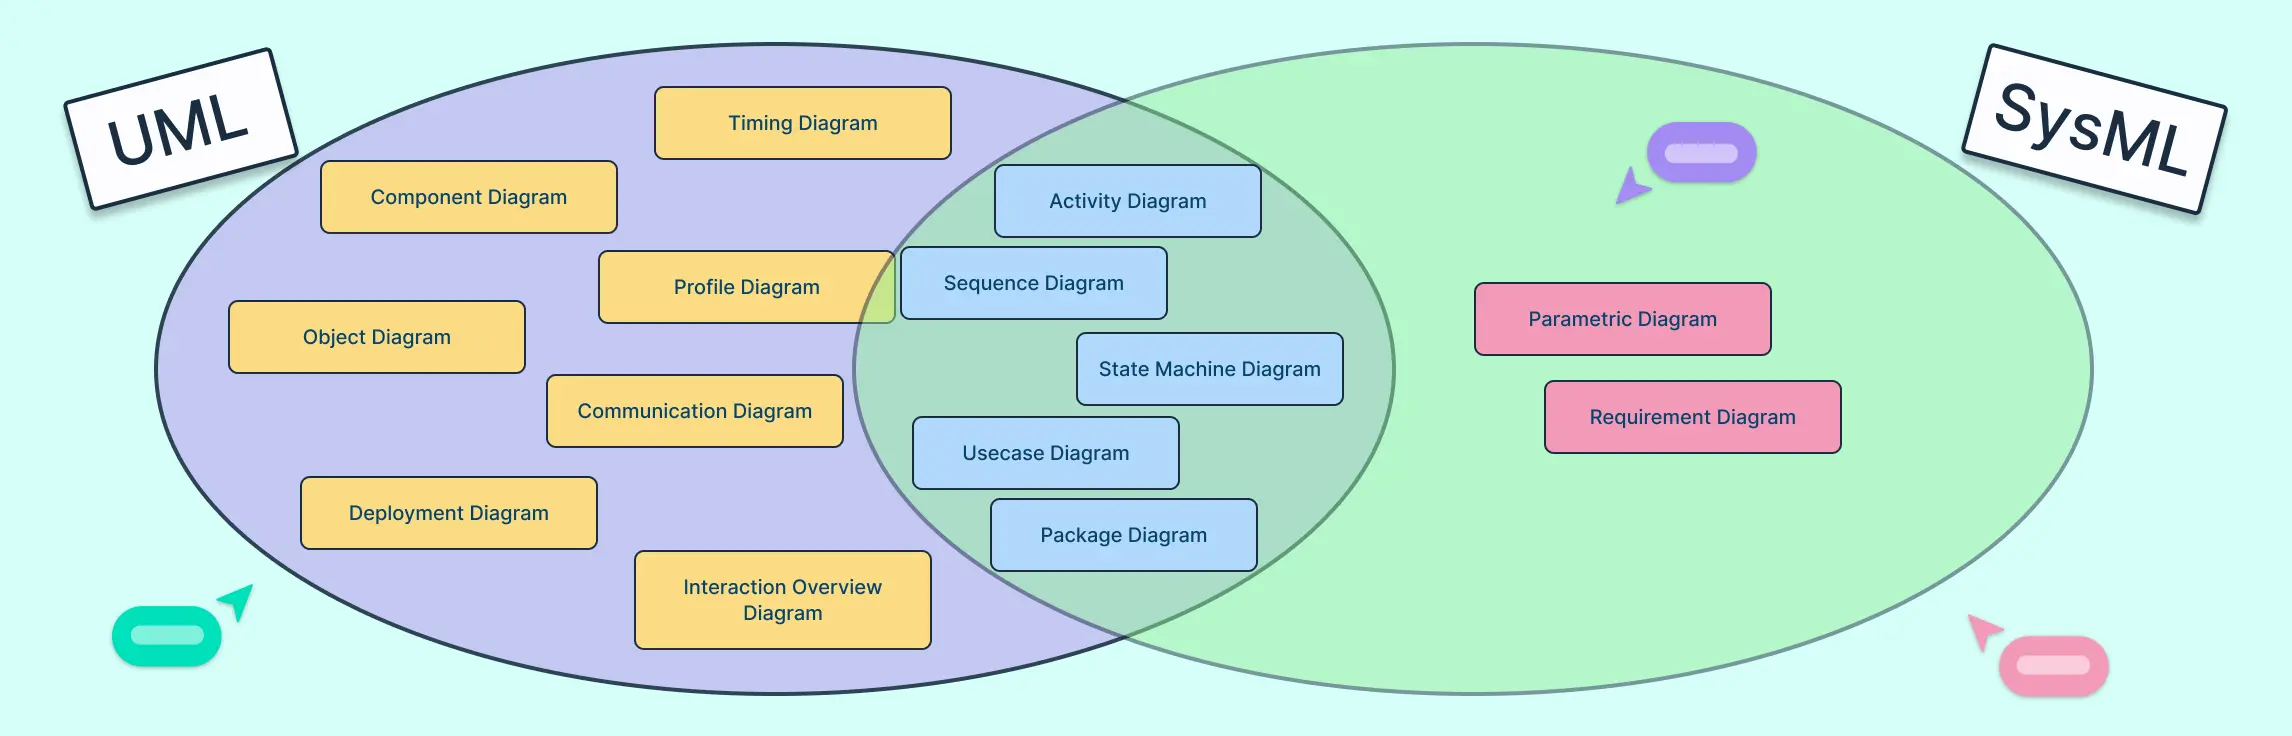
Modeling complex systems or software is easier when you use the right language, which is why UML and SysML are so useful. This guide looks at why each is used—UML for software design, SysML for systems engineering—and compares their diagram types, use cases, and real-world applications to help you choose the best approach for your project.
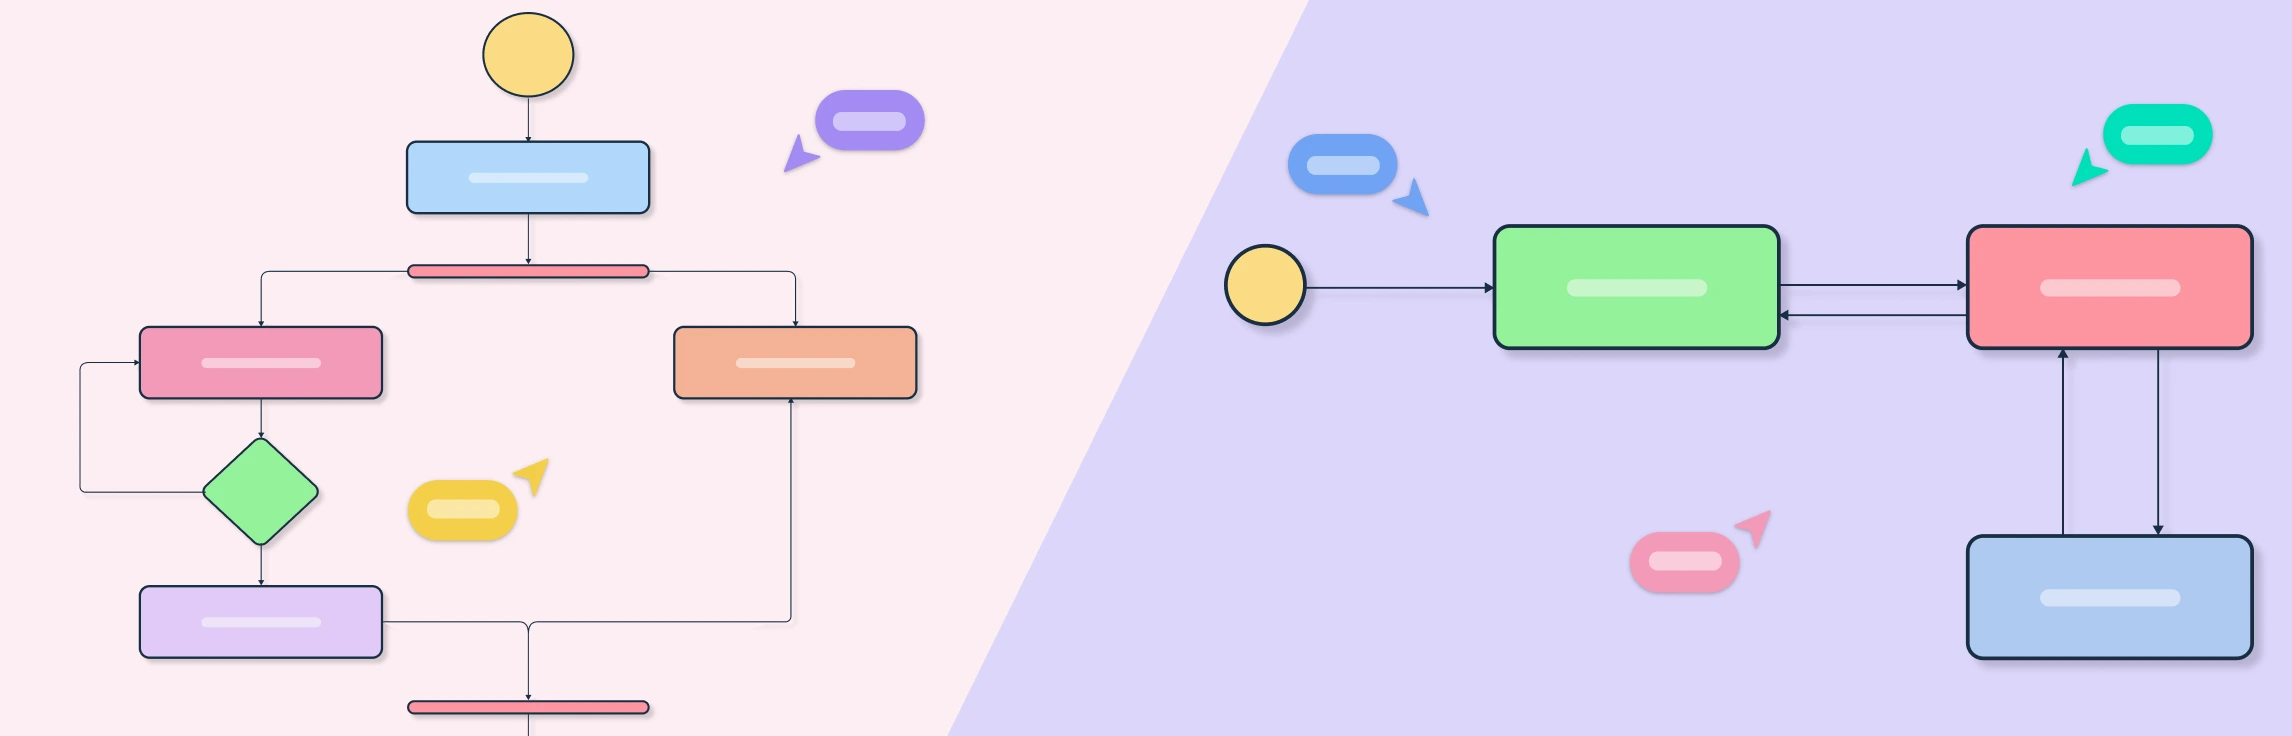
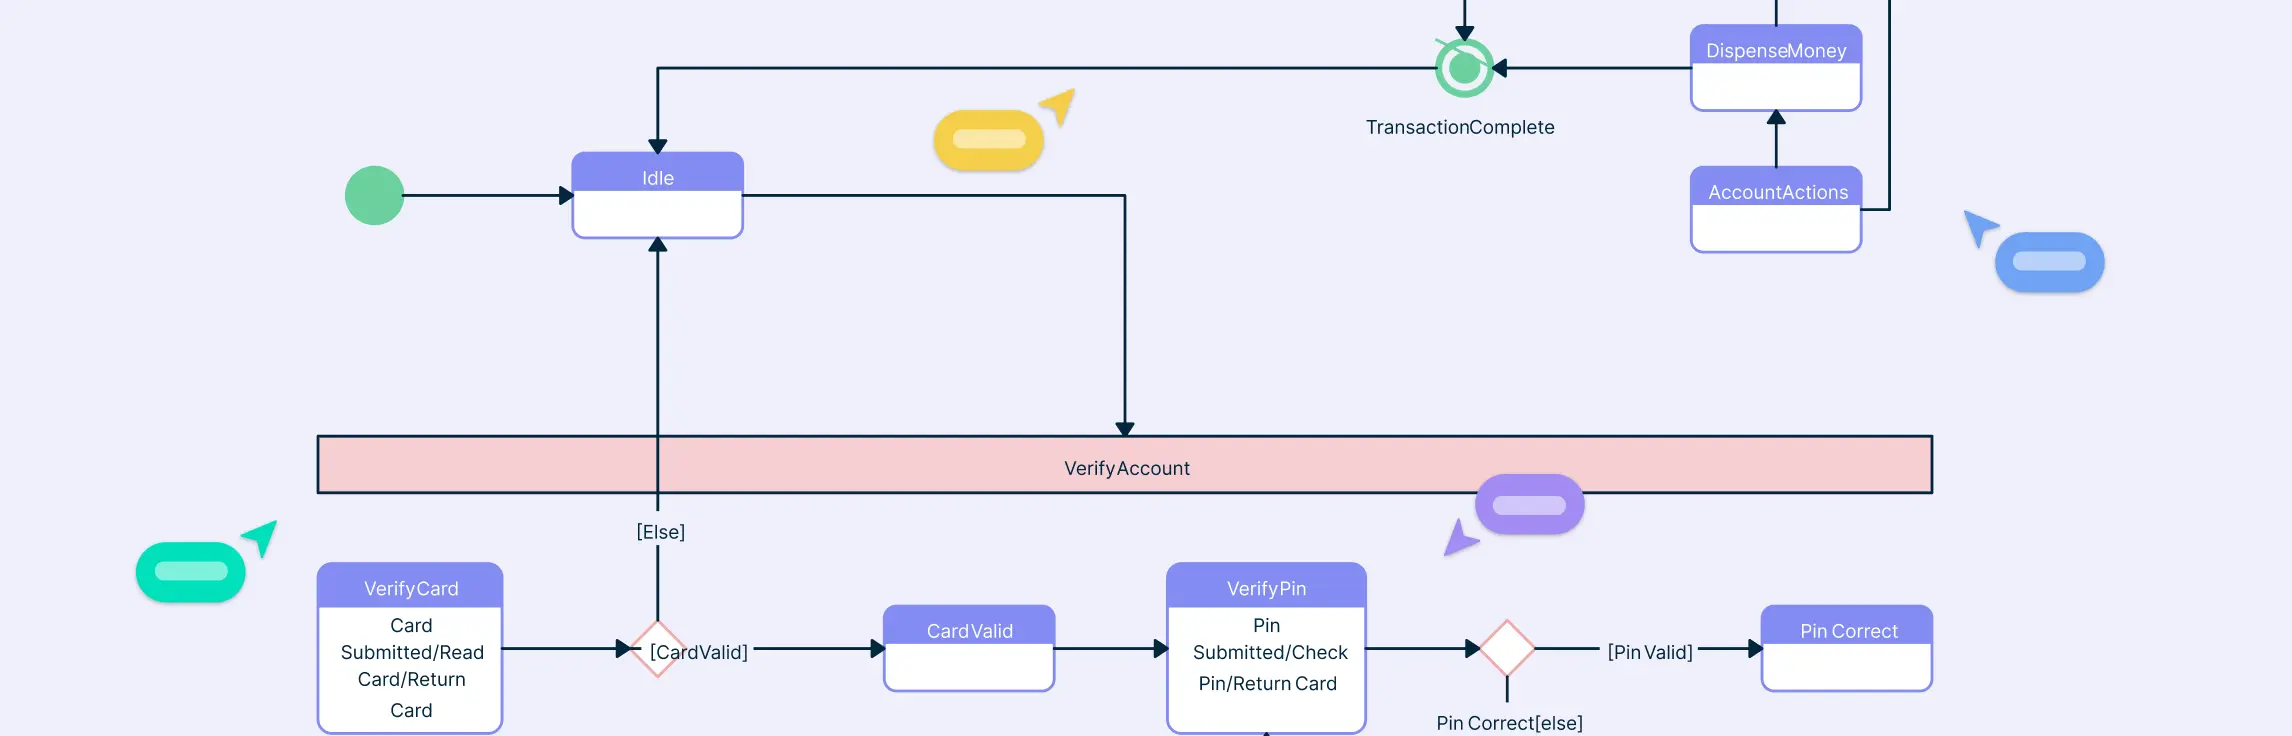
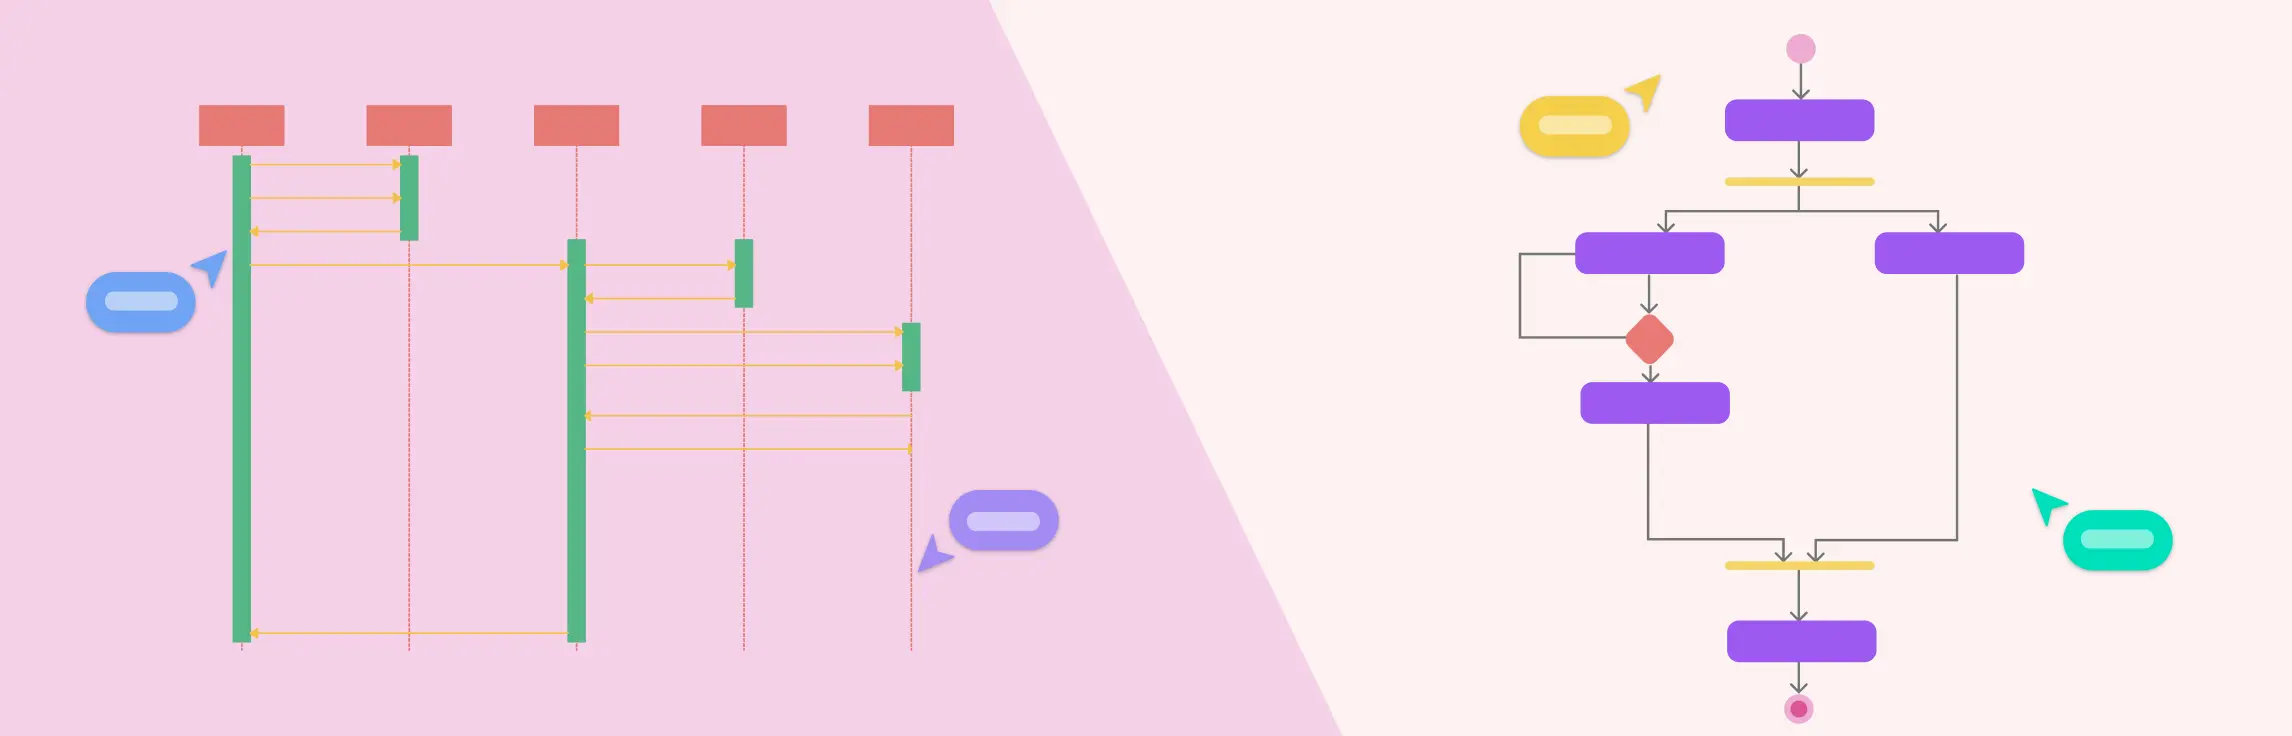
Understanding how a system behaves requires looking at both its process flow and its state changes, and that’s where Activity and State Diagrams come in. This guide explores the Difference Between Activity Diagram and State Diagram in UML, explaining how each visualizes system behavior from a different perspective. You’ll learn how each diagram works with real-world examples, and how to choose the right one for your modeling needs.
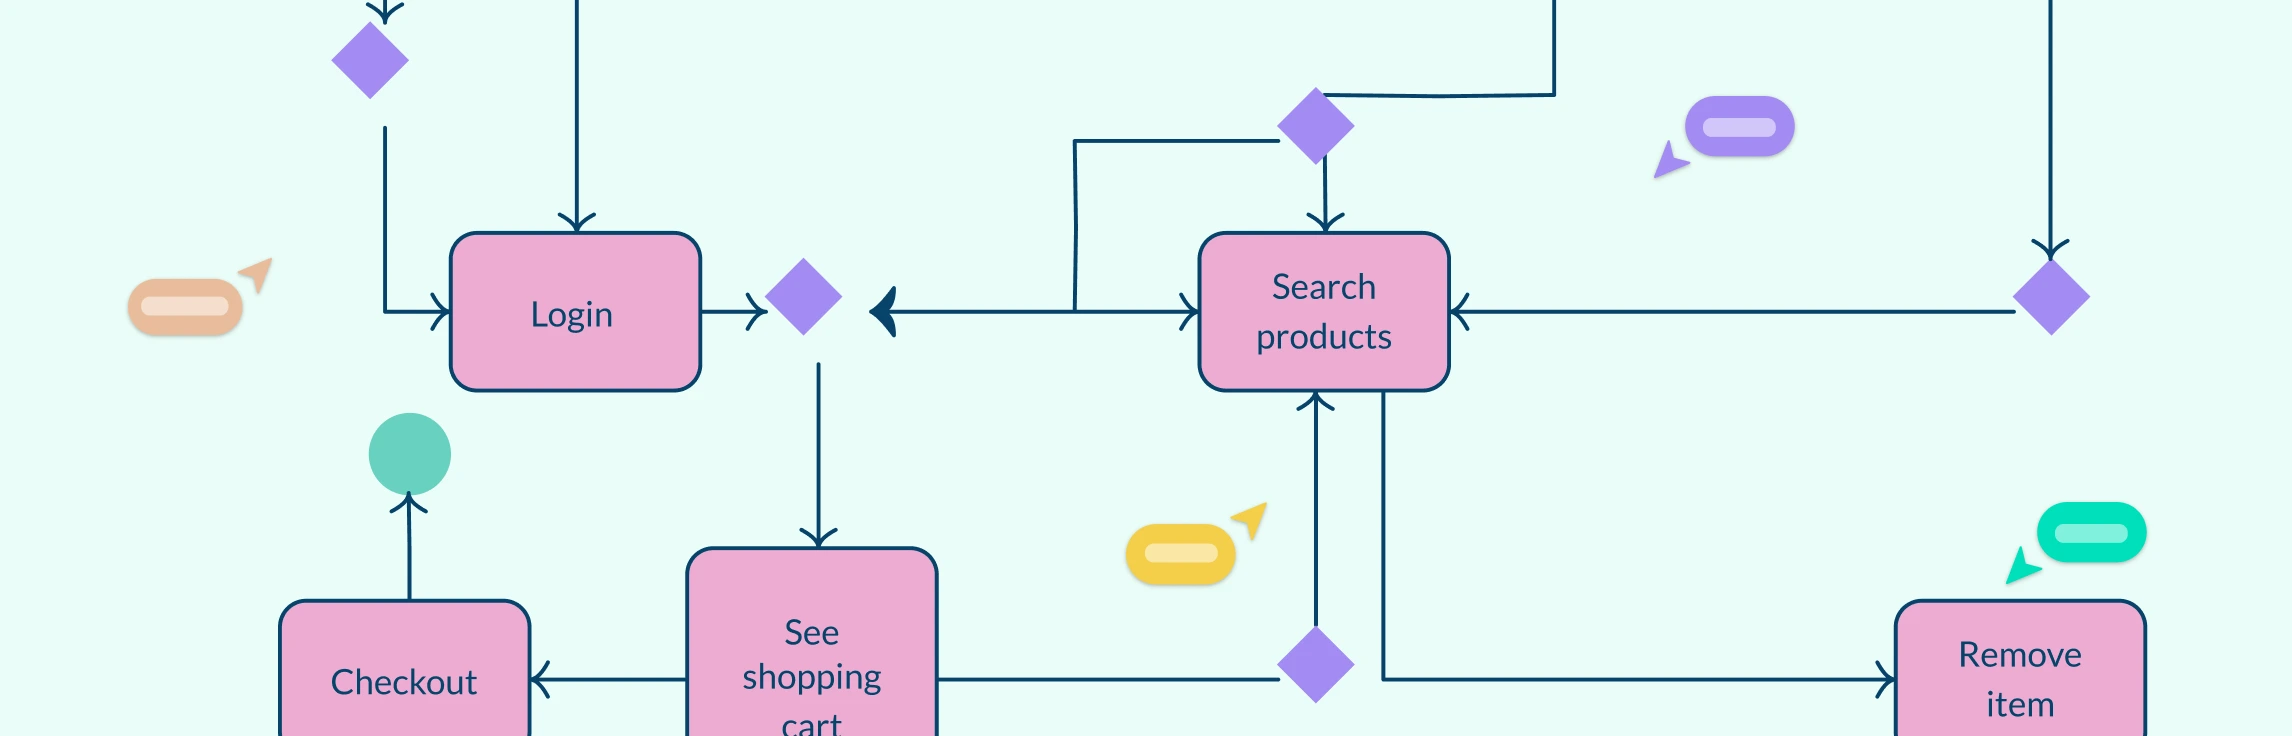
Understanding how different parts of a system interact is essential for modeling complex behaviors in software design. In this guide, we’ll cover what an Interaction Overview Diagram is, its key notations, and a step-by-step process on how to draw one. You’ll also explore the benefits of using these diagrams and learn when to use them effectively in system modeling.
Understanding the difference between UML vs. ERD is essential for anyone involved in software or database design. While both are visual modeling tools, they serve distinct purposes. In this guide, we’ll explore what UML and ER diagrams are, their key differences, use cases, and comparison through examples to help you decide which diagram to use for your next project.
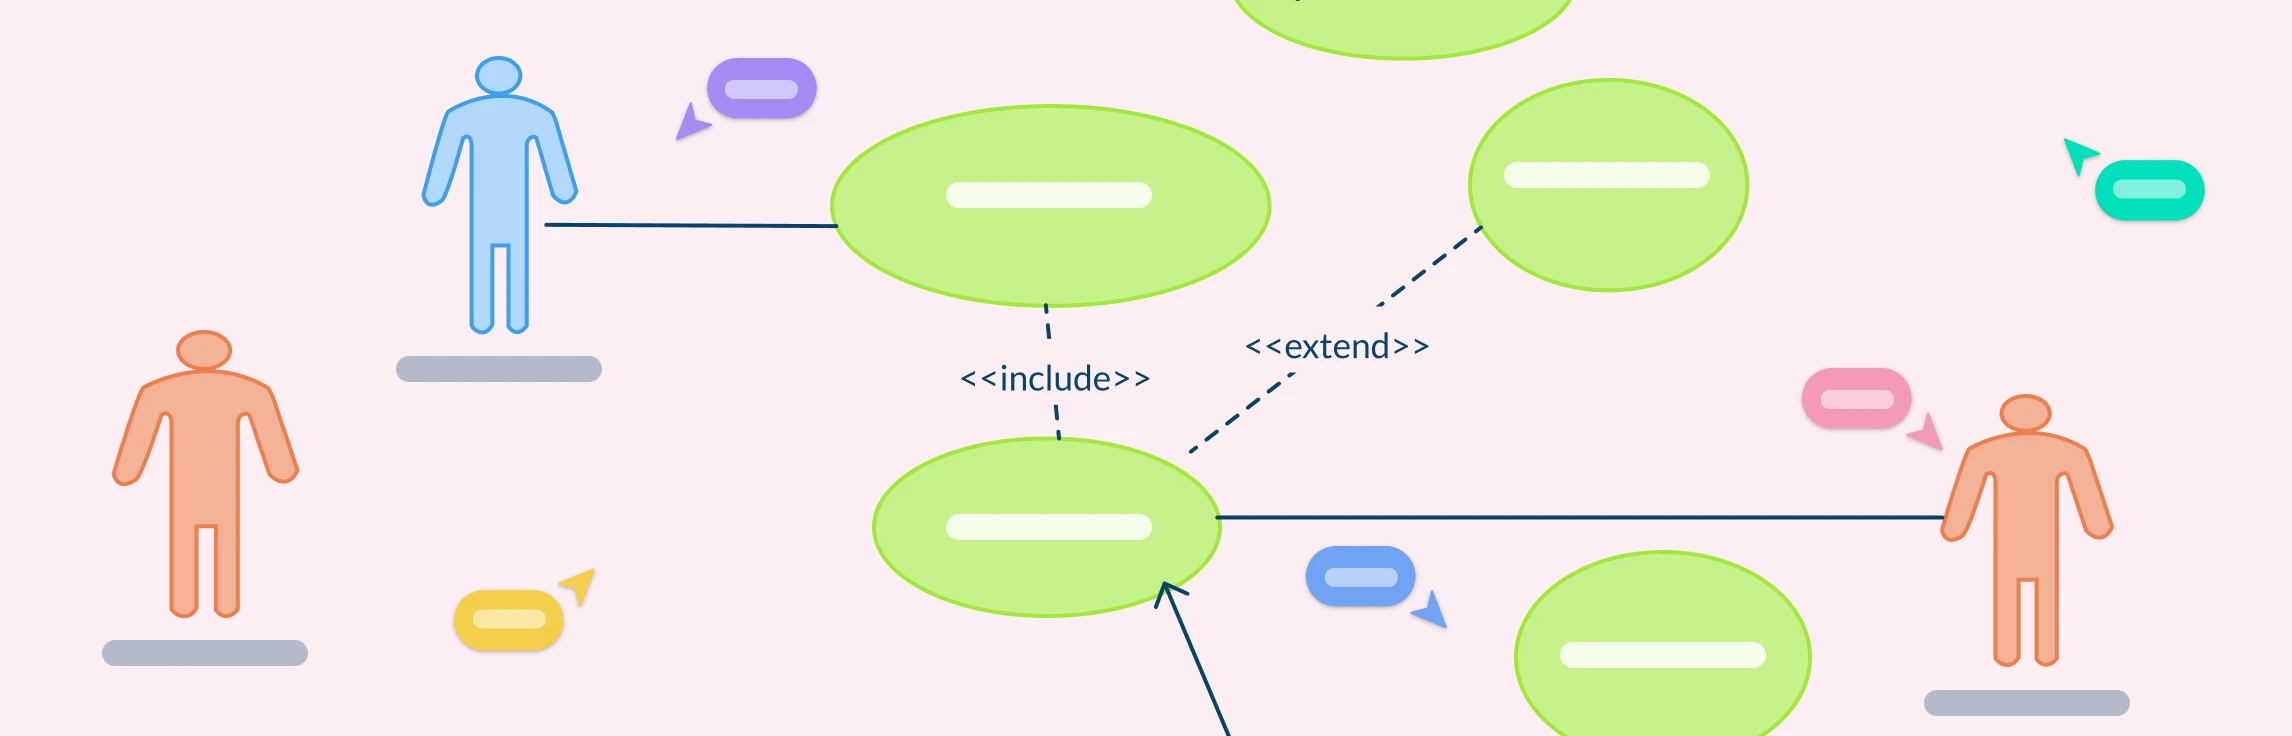
What Are Actors in Use Case Diagrams? Actors in a use case diagram represent the roles that interact with a system. They can be individuals, external systems, or organizations that exchange information or perform actions with the system being modeled. Their main purpose is to define who uses the system and what they expect it to do, helping clearly establish boundaries between the system and its environment.
What is a UML Collaboration Diagram Understanding how different parts of a system interact is key to effective software design, and UML Collaboration Diagrams provide a clear way to visualize those interactions. This guide explains what collaboration diagrams are, their key components, and notations. You’ll also learn how to create one step by step, and discover best practices to make your diagrams clear and useful.
Understanding how a system behaves under different conditions is key to designing reliable software, and that’s where state diagrams come in. This guide will walk you through what a UML state diagram is, why it’s important in modeling system behavior, and how to create one effectively. You’ll learn about its core components, see examples of real-world applications, and explore best practices to capture the dynamic flow of your system.
State diagrams are essential tools for visualizing how systems behave and transition between different states, making complex processes easier to understand. In this guide, we’ll explore state diagram examples to simplify complex system modeling and demonstrate how objects or components interact within a system. To make your diagram creation even easier, we’ve included ready-to-use templates that you can customize for your specific projects.
When designing a new system, tracking every interaction between components can be a nightmare. That’s why sequence diagrams are essential for illustrating how objects or components interact over time, making complex systems easier to understand for developers, analysts, and stakeholders alike. But with so many tools available, from intuitive drag-and-drop editors to text-based generators, choosing the right one can be overwhelming. In this guide, we break down the top sequence diagram tools, comparing their features, collaboration capabilities, templates, and export options, so you can pick the perfect tool for your workflow.
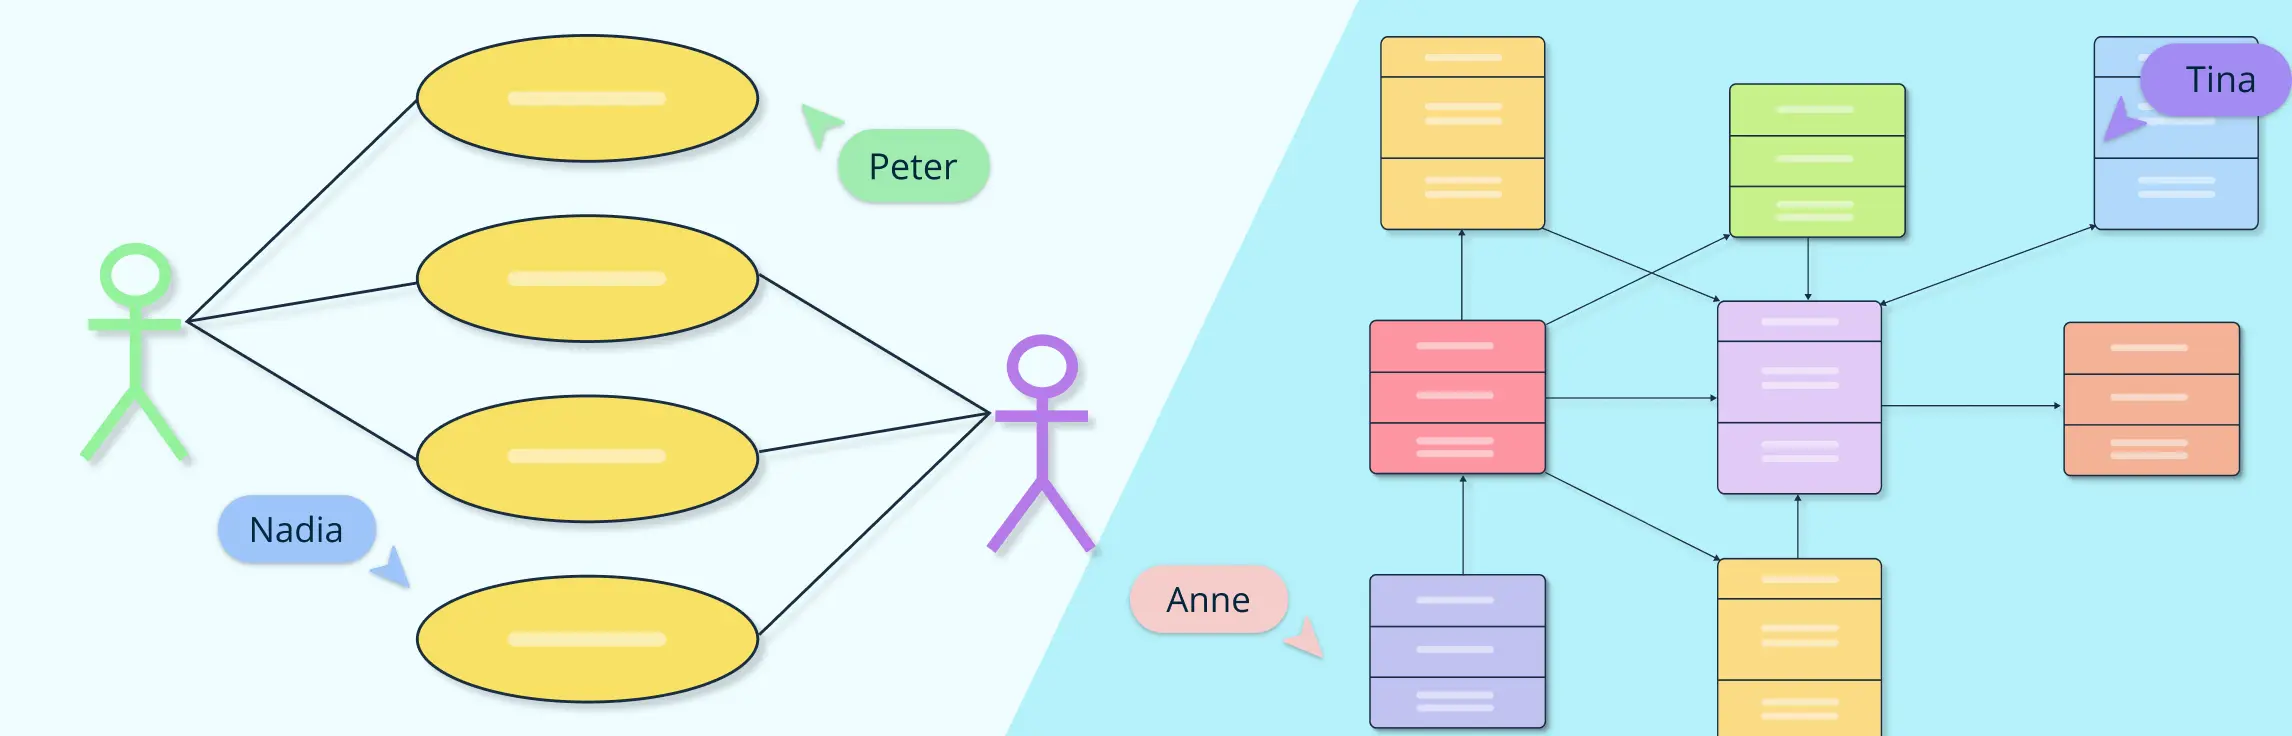
Ever started designing a system only to realize your team is mixing up user flows with system structures? You’re not alone. UML diagrams are essential tools in software design and UML modeling, helping teams visualize how systems behave and how their components interact. Among the most commonly used types, use case diagrams and class diagrams are often confused, yet they serve entirely different purposes. While one focuses on system behavior and user interactions, the other captures the internal structure and relationships between classes. In this guide on use case diagram vs class diagram, we’ll break down their key differences, explore real-world use case diagram examples and class diagram examples, and share ready-to-use templates to help you create both effortlessly.
Composite structure diagrams are a UML tool used to model a system’s internal structure, showing how its parts, ports, and connectors interact at runtime. Unlike class diagrams, they focus on the internal composition and collaboration of components.
Visualizing how a system behaves is key to effective software design, and UML (Unified Modeling Language) makes this easy. Among its behavioral diagrams, the Sequence Diagram and Activity Diagram stand out for showing interactions and workflows. This guide explores Sequence vs Activity Diagram, highlighting their differences, components, and when to use each for clear, actionable system modeling.
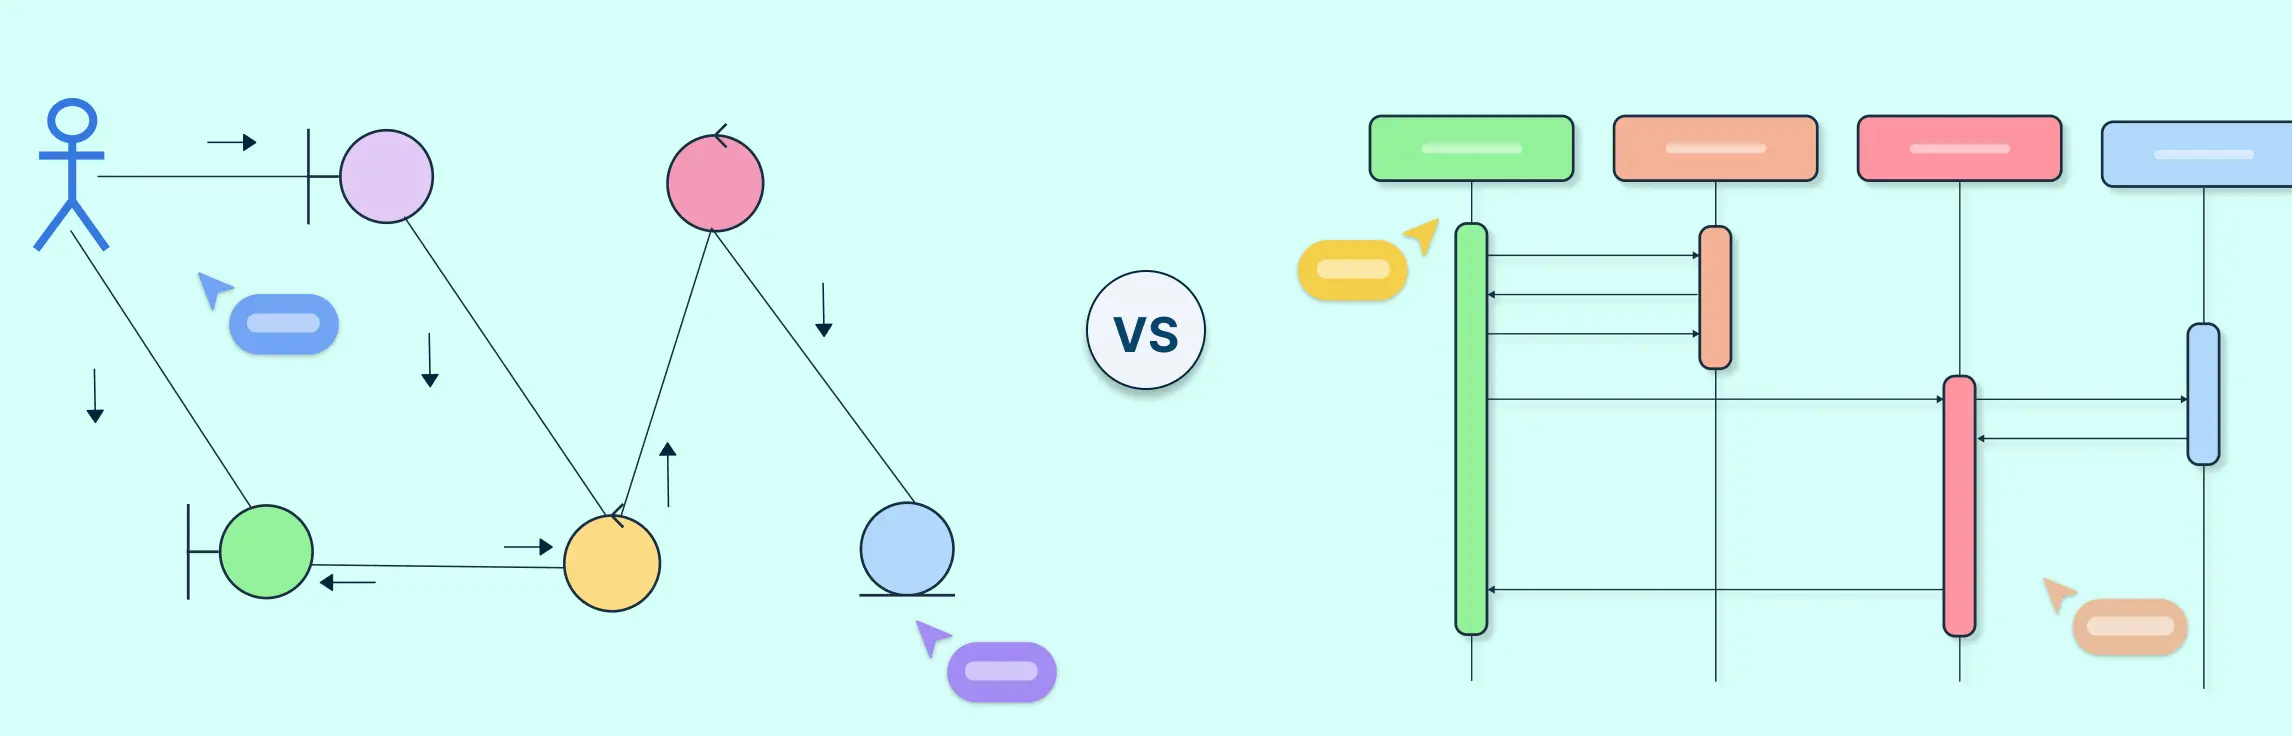
In UML, sequence and communication diagrams both show how objects interact within a system, but they do so from different perspectives. A sequence diagram focuses on the order of messages over time, while a communication diagram emphasizes the relationships and message flow between objects. This guide explains their key differences, when to use each, and how they work together to model system behavior effectively.
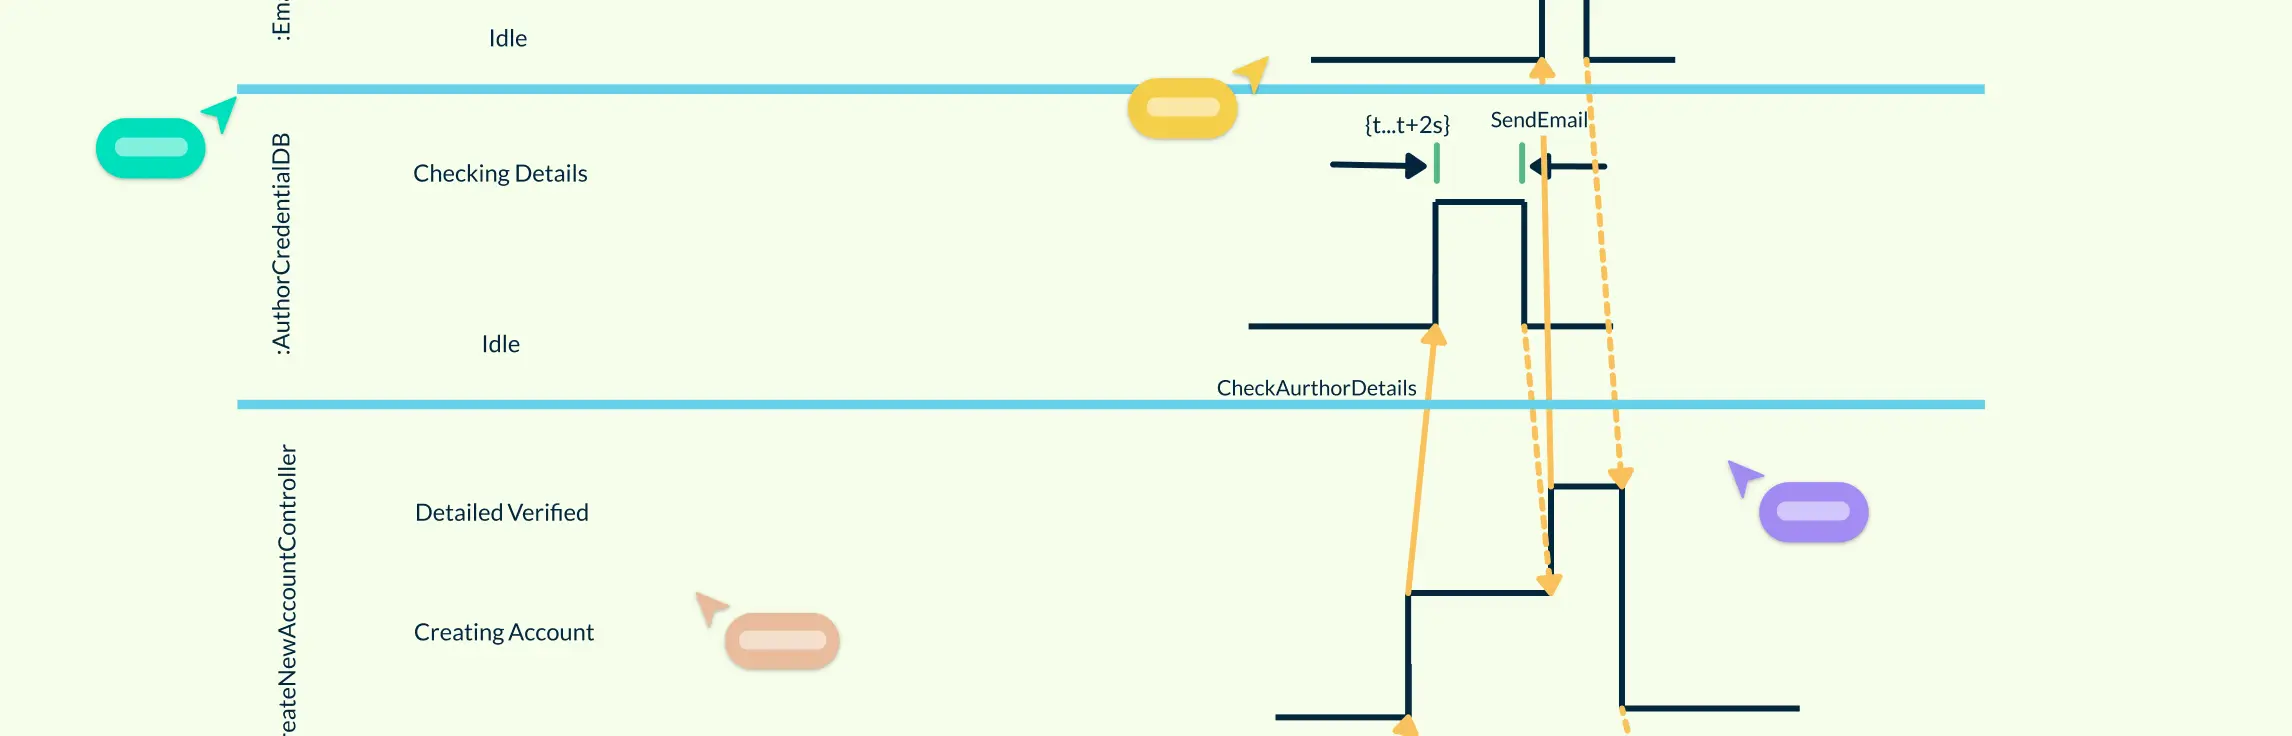
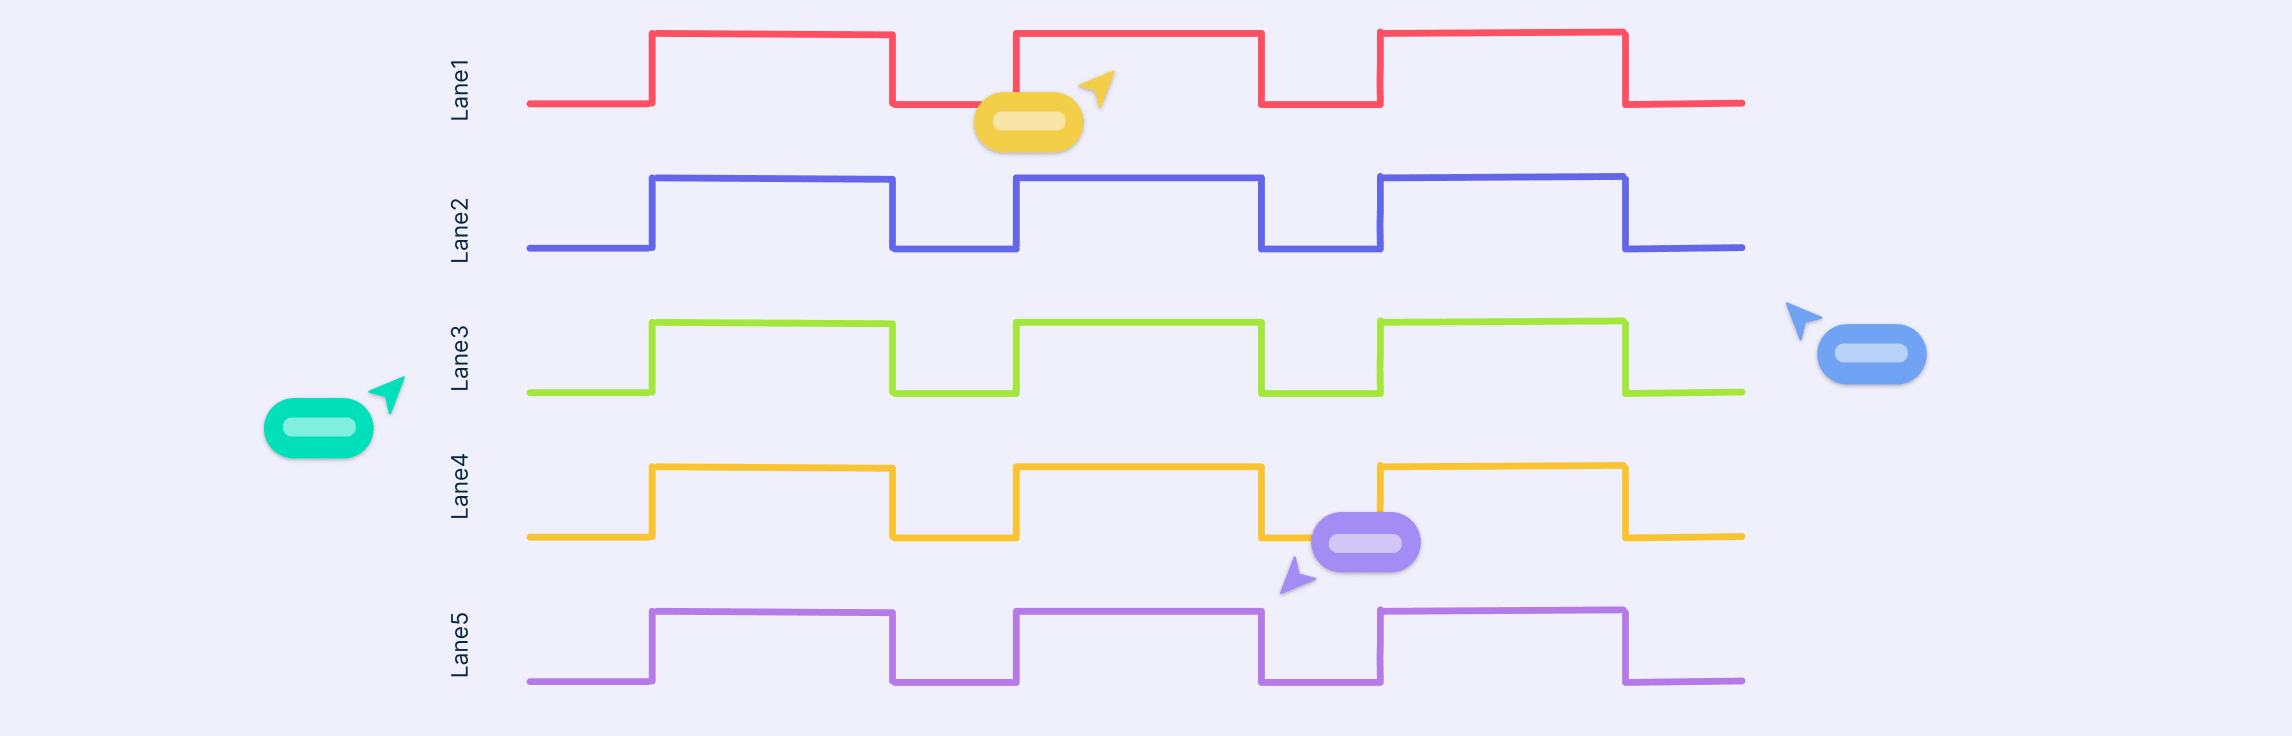
Ever wondered how complex systems keep everything running smoothly, on time, and in sync? Timing is everything, and understanding it can make the difference between a system that works and one that fails. In this guide, you’ll learn the key components, types, and step-by-step process for creating timing diagrams, along with best practices to make your diagrams clear, accurate, and easy to understand.
What Are Class Diagram Symbols? UML Class Diagram symbols are the standardized notations used to represent the structure and relationships of classes in object-oriented systems. These symbols visually communicate how classes, attributes, methods, and relationships interact within a software design. They serve as a universal language for developers, analysts, and designers, helping teams model systems clearly without ambiguity.
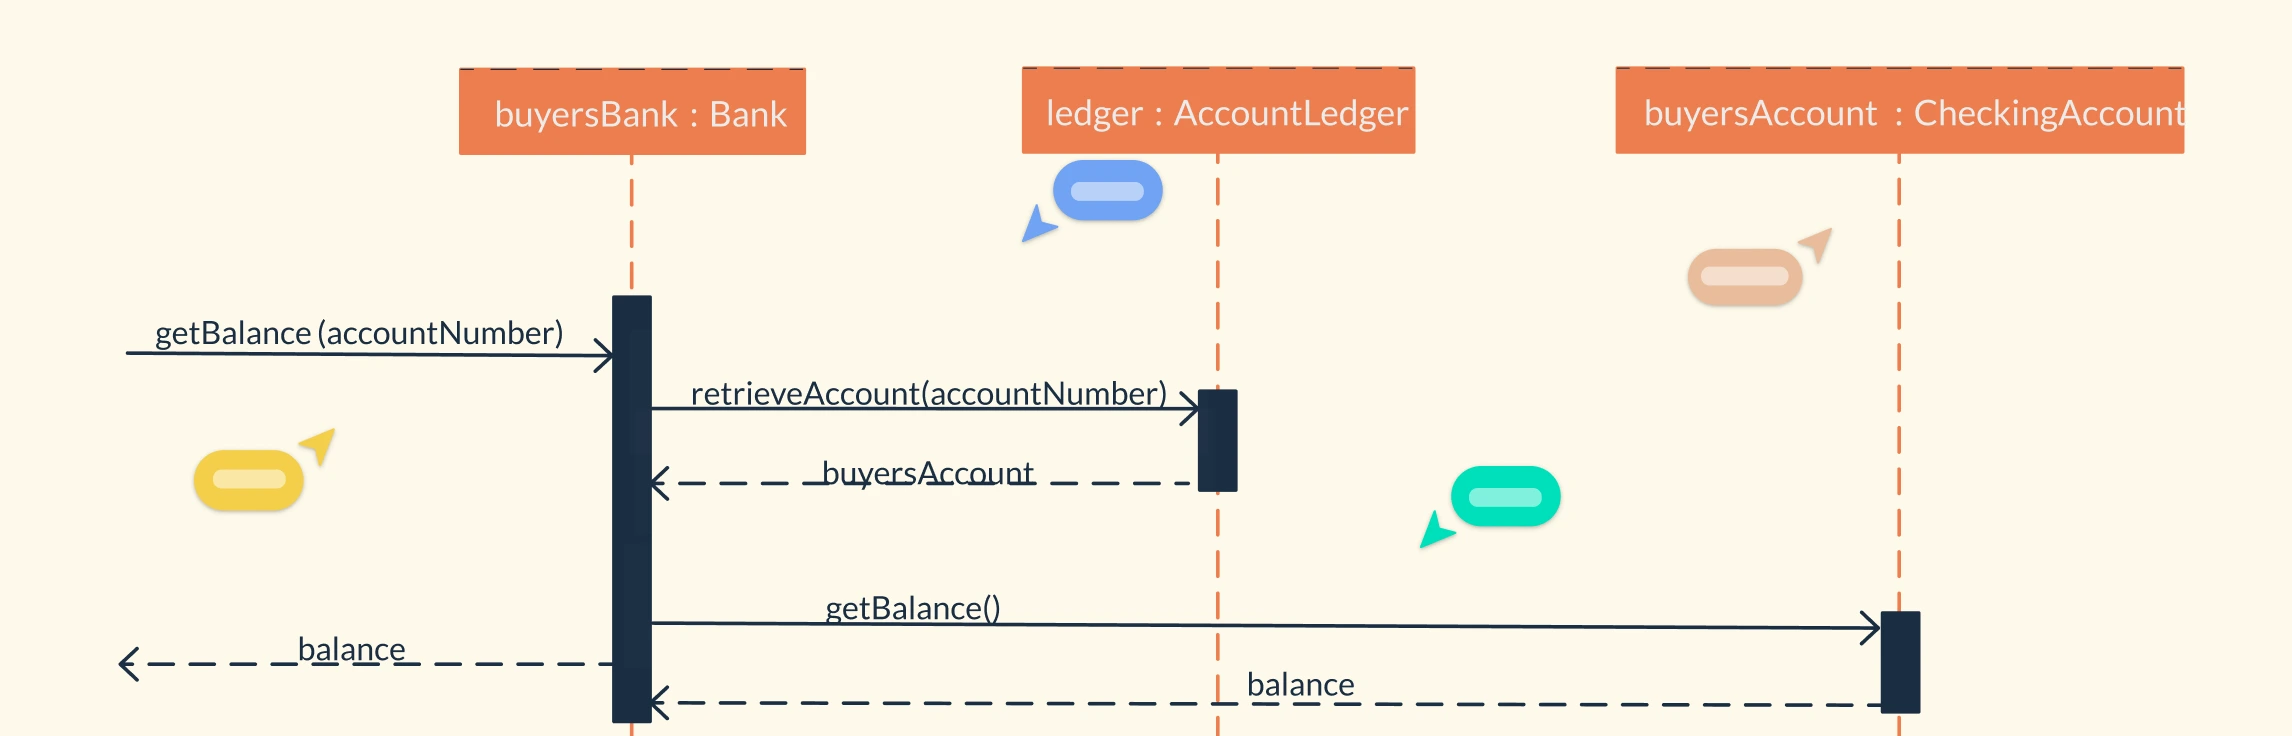
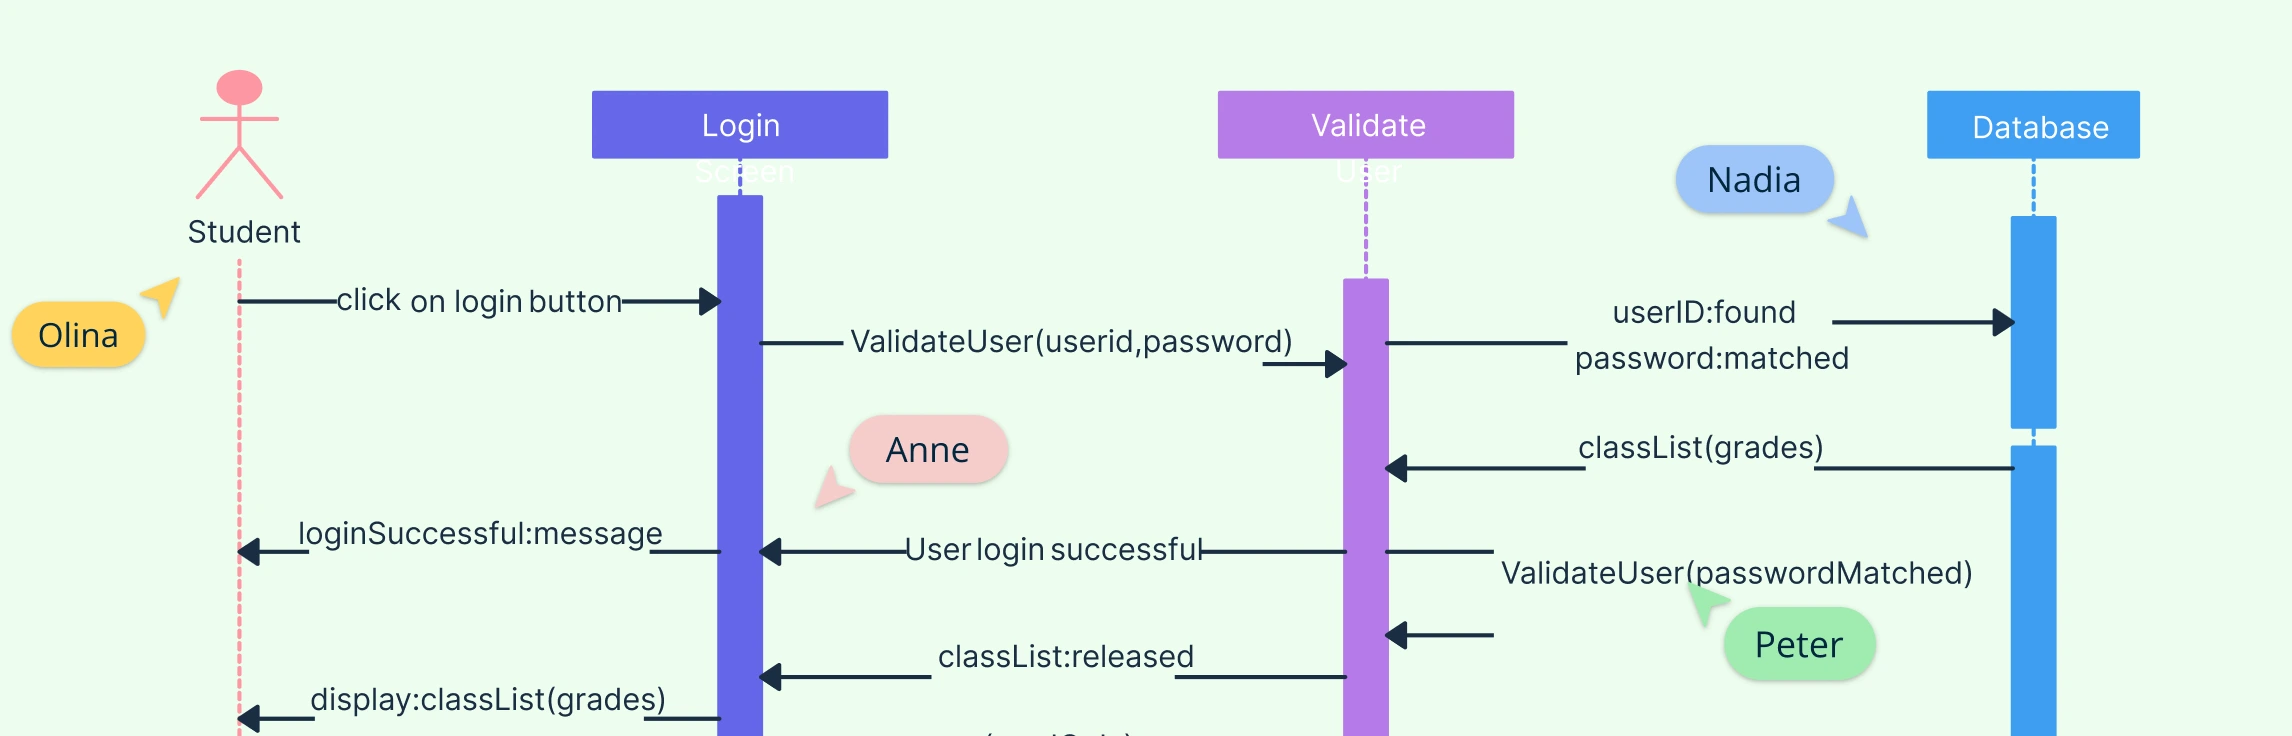
If you have trouble understanding what is a sequence diagram, this guide will provide everything you need to know, including the definition, notations, how to draw a sequence diagram, best practices, examples, and common mistakes you should avoid when drawing one.
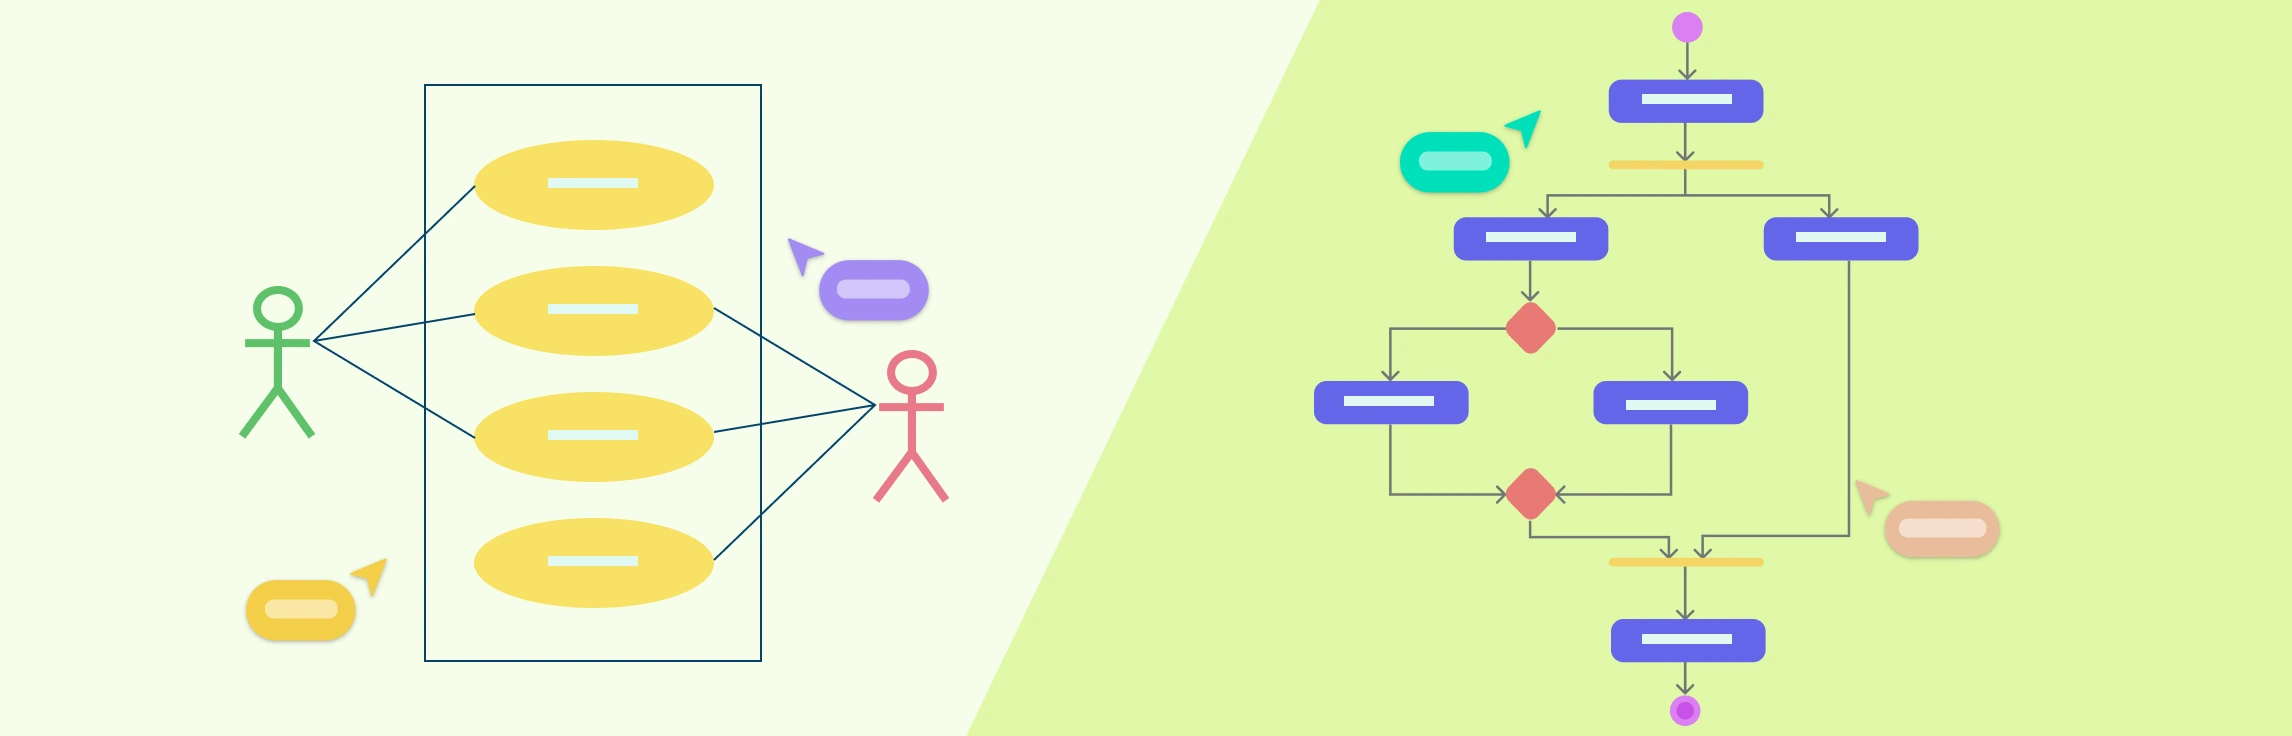
Understanding the difference between use case diagram and activity diagram is essential for anyone involved in system analysis, software design, or process modeling. While both are part of the Unified Modeling Language (UML) suite, they serve distinct purposes and visualize different aspects of a system. This guide breaks down their purposes, notations, and practical applications, helping you understand when to use each diagram, and how they complement one another.
A System Sequence Diagram (SSD) is a high-level UML sequence diagram that shows how external actors interact with the system as a single black box for a specific use case. It captures the time-ordered sequence of input events (messages) from actors to the system and the system’s observable responses, without revealing any internal objects, classes, or control flow. Let’s look at when to use UML system sequence diagrams, notations, a comparison with sequence diagrams and benefits.
Interaction Diagram Definition A UML Interaction Diagram is a type of behavioral diagram used to visualize how objects in a system interact through the exchange of messages. It focuses on the dynamic behavior of a system by showing what happens, when it happens, and which components communicate during a specific process or use case. Interaction diagrams capture the “conversation” between objects, helping designers and developers understand how parts of a system collaborate to achieve a goal.
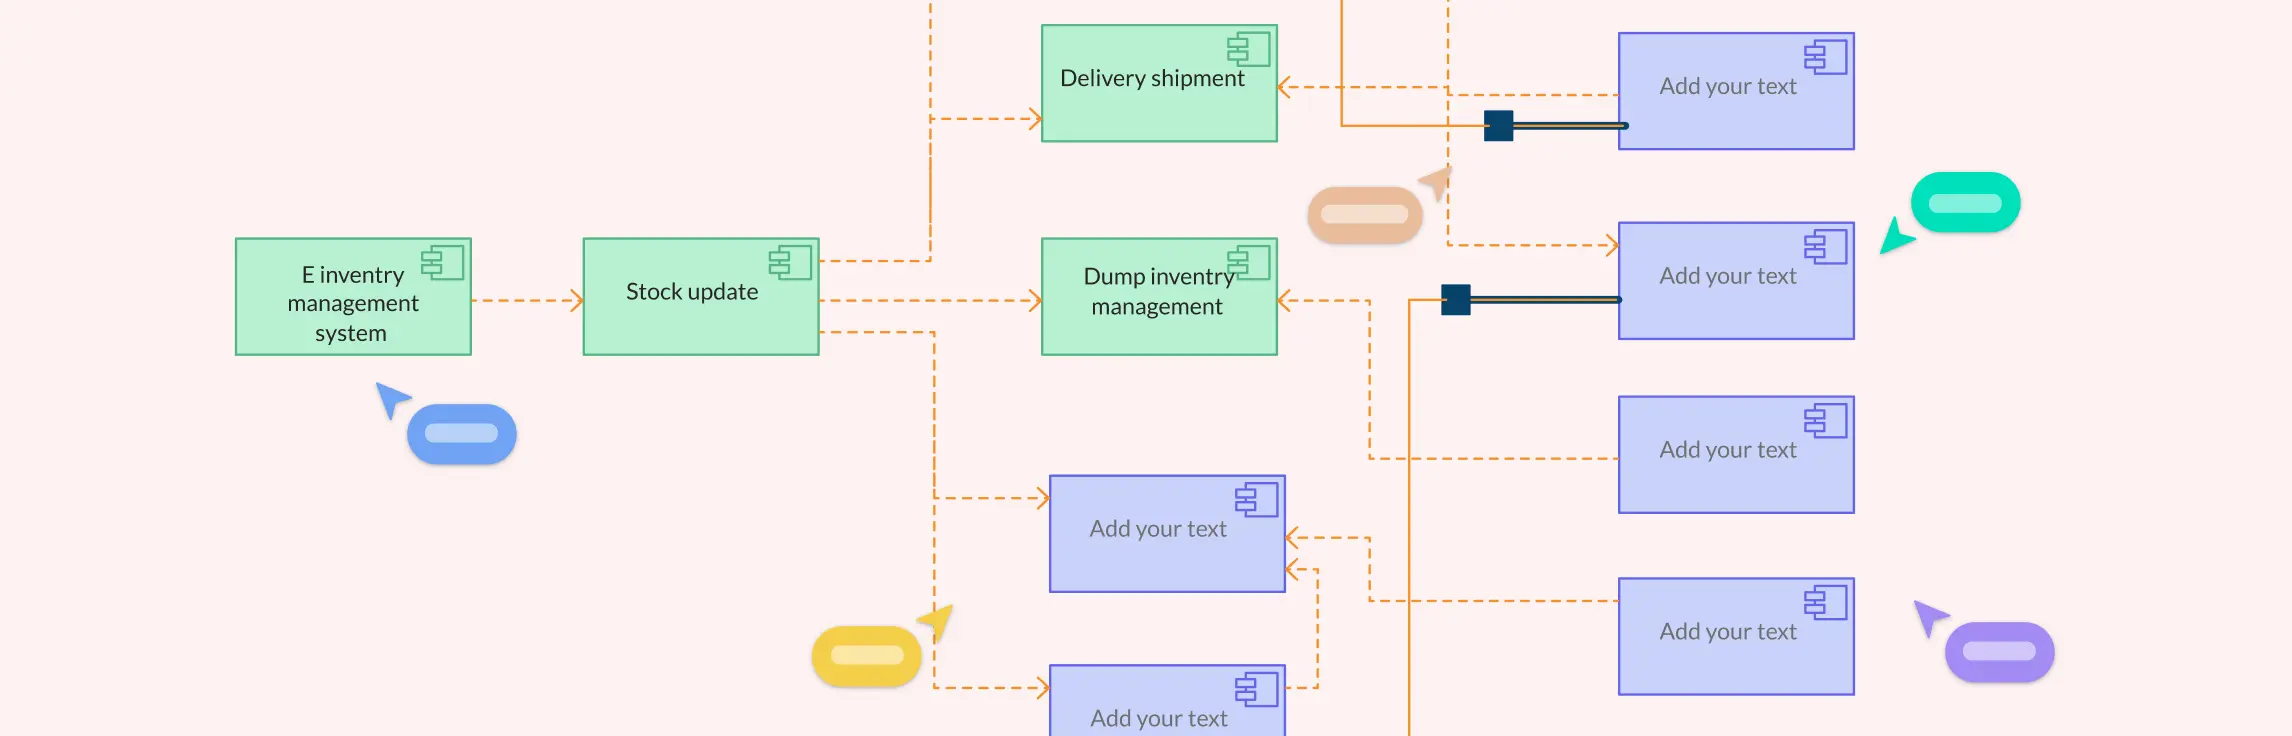
In software and system design, understanding how different parts of a system interact is crucial, and that’s where component diagrams come in. A component in UML represents a modular part of a system, showing its interfaces, dependencies, and relationships with other components. This guide will walk you through practical component diagram examples and provide ready-to-use templates, helping you visualize complex systems clearly and implement UML components quickly and efficiently.
A UML Profile Diagram is a powerful tool for customizing standard UML models to fit specific domains, from IT management and enterprise software to mobile applications and service-oriented architectures. By using UML profiles, teams can define domain-specific stereotypes, tagged values, and constraints, all while keeping their models compatible with standard UML tools. In this guide, we’ll break down the key elements of a UML profile diagram, show you how to create one step-by-step, and explore ready-to-use templates to accelerate your modeling workflow.
Understanding the internal workings of a system is crucial for software designers, architects, and developers. A UML composite structure diagram offers a detailed view of how components, parts, ports, and roles interact within a system, making it easier to design modular, maintainable, and scalable solutions. Whether you’re modeling software architecture, system workflows, or component-based designs, these diagrams help bridge the gap between static class definitions and dynamic interactions, providing clarity and improving collaboration across teams.
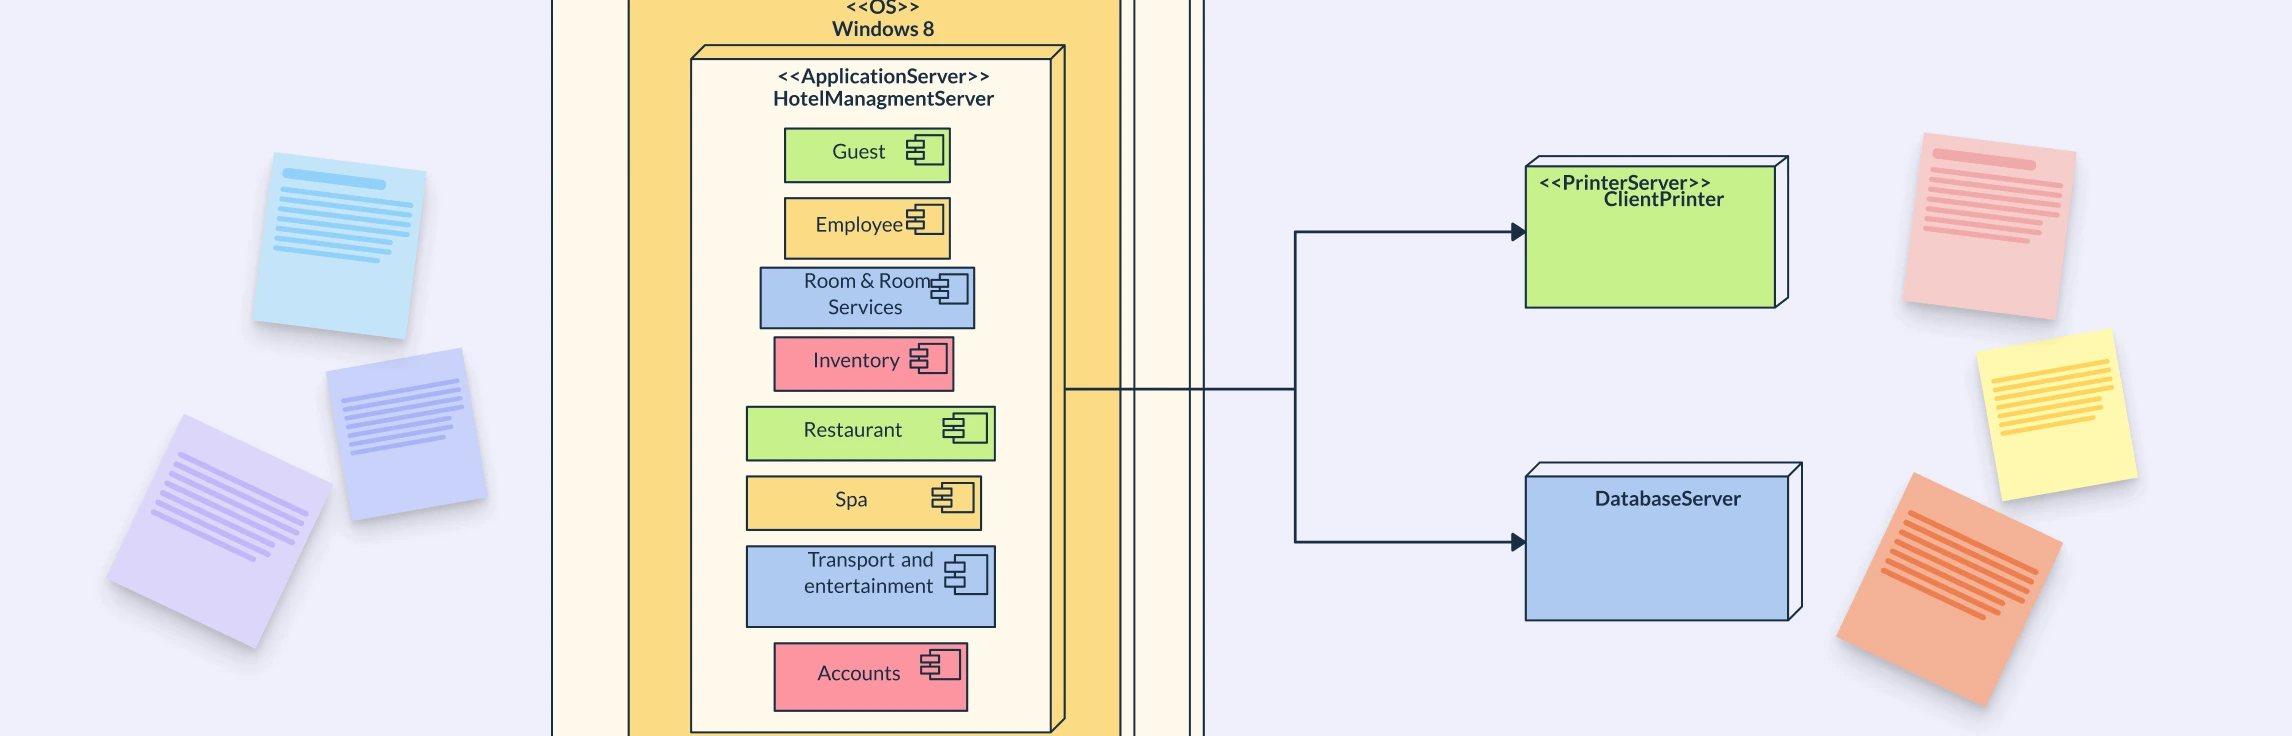
A deployment diagram is a UML diagram that shows how software components are deployed across hardware nodes, servers, devices, or cloud environments. It bridges the gap between design and implementation by visualizing where each part runs and how elements communicate. Used across industries from web and mobile apps to IoT, cloud, and enterprise systems, it helps teams plan, document, and optimize architecture for scalability, reliability, and efficiency.
What is a Deployment Diagram A UML Deployment Diagram is a structural diagram that shows how software components are deployed across hardware or network environments. It maps hardware nodes (servers, devices) to software artifacts (applications, databases) to visualize where each part runs and how they interact. In short, it illustrates a system’s runtime architecture, helping teams understand and document how software operates within its infrastructure.
Understanding how different parts of a system interact is essential for effective software design, and that’s where UML Communication Diagrams come in. In this guide, we’ll explore what a Communication Diagram is, its purpose, key elements, and how to create one effectively.
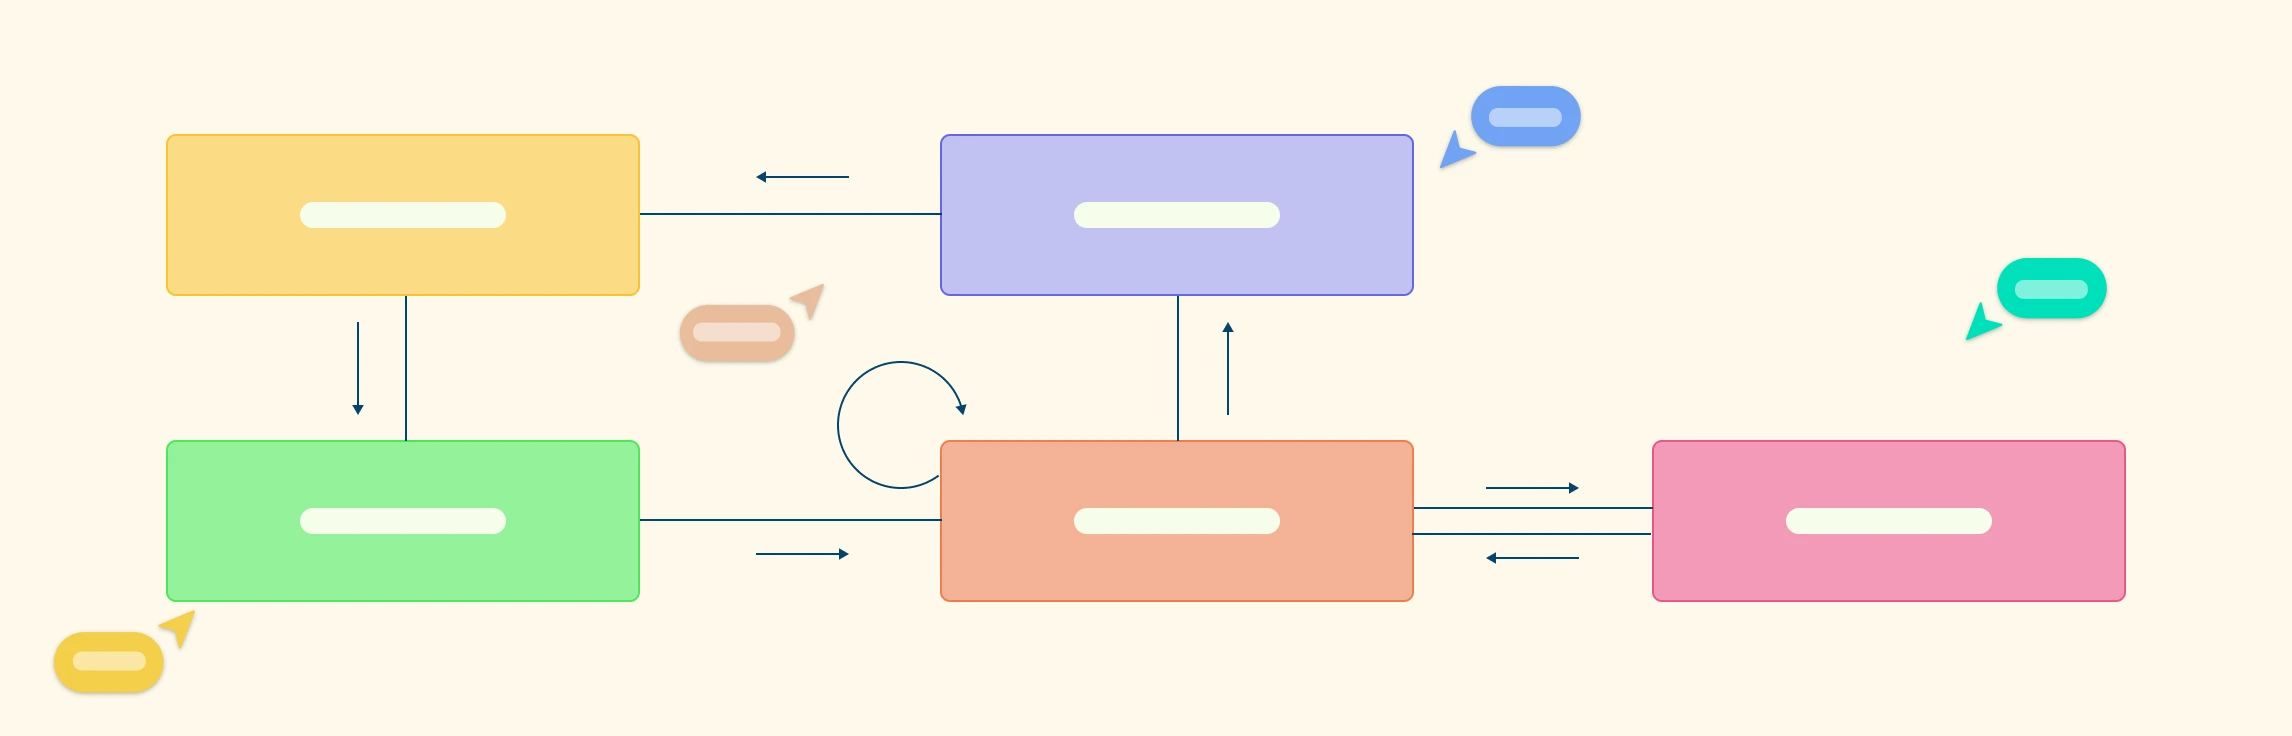
UML Diagram Definition A UML Diagram is a visual representation of a system created using the Unified Modeling Language (UML) to illustrate how different parts of a software system interact, function, or are structured. It helps developers, designers, and stakeholders understand and communicate system design clearly before or during implementation. UML diagrams are generally divided into two main types, structural and behavioral. In complex organizations, 43% of people in highly matrixed environments report complexity hurts decision quality and speed, which is why clear system modeling matters early (Marmolejo et al., 2021).
Class Diagram Definition A class diagram is a type of UML (Unified Modeling Language) diagram that visually represents the structure of a system by showing its classes, attributes, methods, and relationships. It serves as a blueprint for how different parts of an object-oriented system interact and organize data. Class diagrams are fundamental in system design because they bridge the gap between real-world concepts and code implementation. This helps developers, analysts, and stakeholders understand how the system’s components are connected and how they collaborate to perform various functions.
Package Diagram Definition A package diagram in UML (Unified Modeling Language) is a structural diagram that groups related elements such as classes or components into logical units called packages. It shows how these packages are organized and depend on each other, offering a clear view of a system’s structure. By grouping related parts, package diagrams simplify complex designs, promote modularity, and ensure a clean separation of responsibilities within large software systems.
Object Diagram Definition A UML Object Diagram is a structural diagram that shows a snapshot of objects, their attributes, and relationships at a specific point in time. It represents how instances of classes interact in a real situation, reflecting the system’s state during execution. While class diagrams define the blueprint of a system, object diagrams display the actual data and connections between objects, making them useful for understanding, validating, and illustrating how a system behaves at runtime.
In the world of software design, clear visual modeling can make the difference between a well-structured system and a confusing tangle of code. Among the essential UML tools, object diagrams vs. class diagrams stand out as critical instruments for understanding both the blueprint and the real-time instances of a system. This guide will help you explore the key differences between class and object diagrams, illustrate practical examples of each, and provide ready-to-use templates so you can start modeling your software architecture with clarity and efficiency.
UML Class Diagrams are one of the most essential tools in software engineering, helping developers visualize the structure and relationships within object-oriented systems. They provide a clear overview of classes, attributes, methods, and how different entities interact, making them indispensable for designing, documenting, and maintaining complex applications.
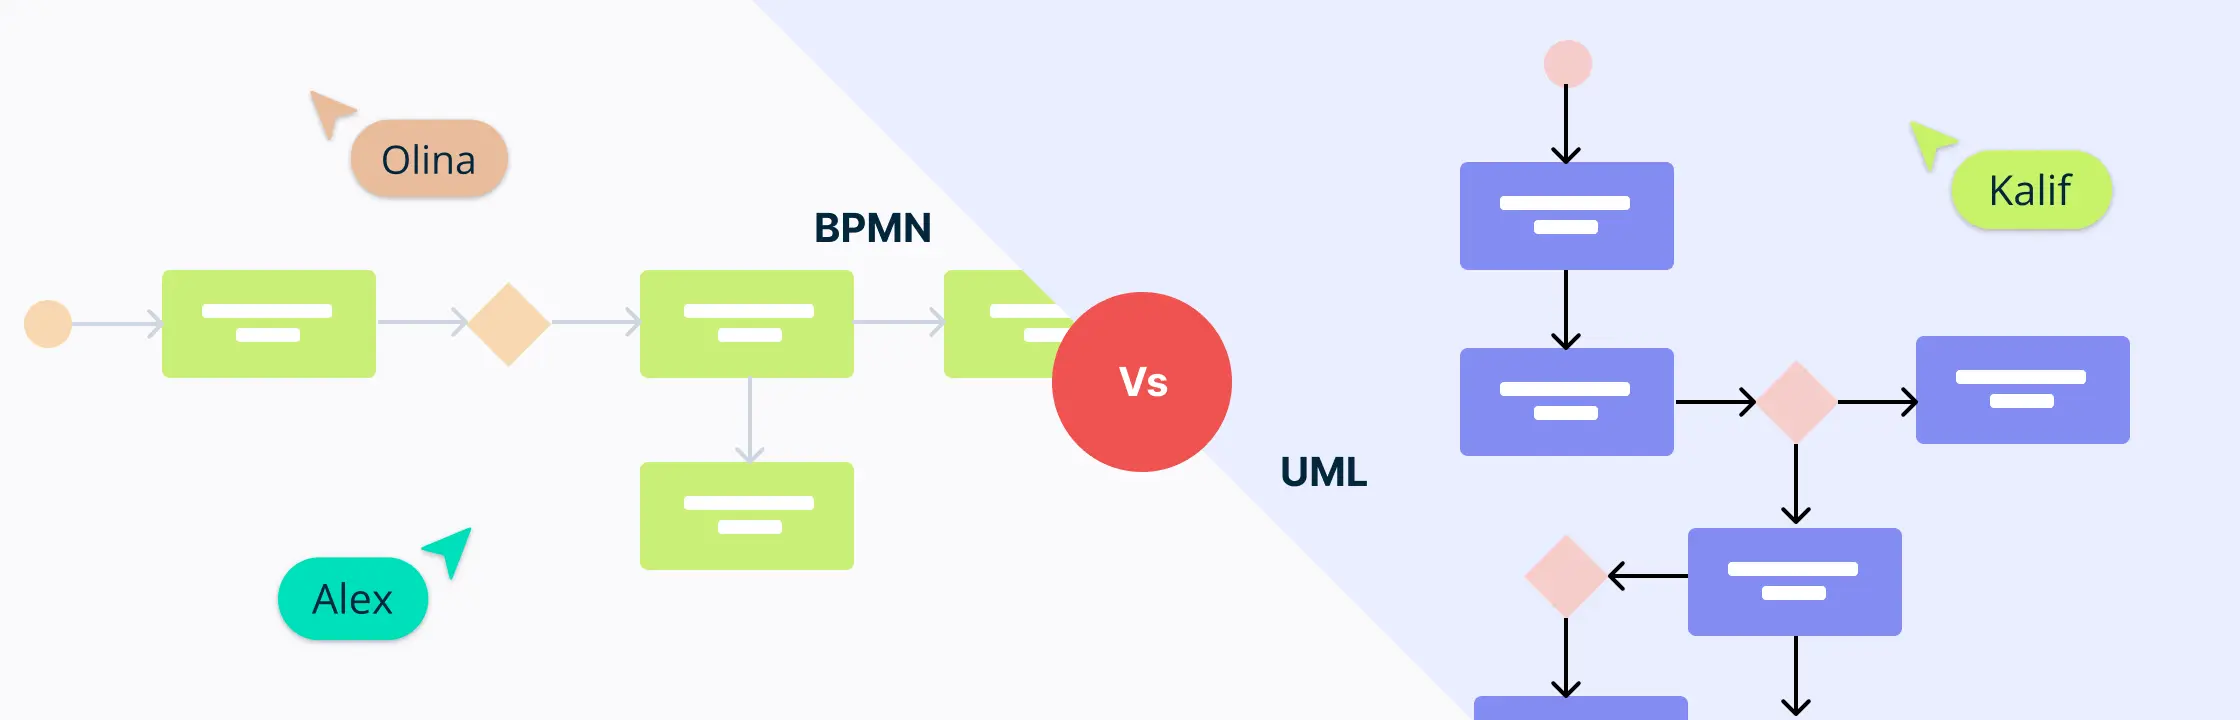
In business and tech, choosing between BPMN vs UML carries significant importance. If you are involved in process modeling, you know these languages are key to improving how organizations work. This short guide compares the basics of BPMN vs UML, helping you make smarter choices for your projects.
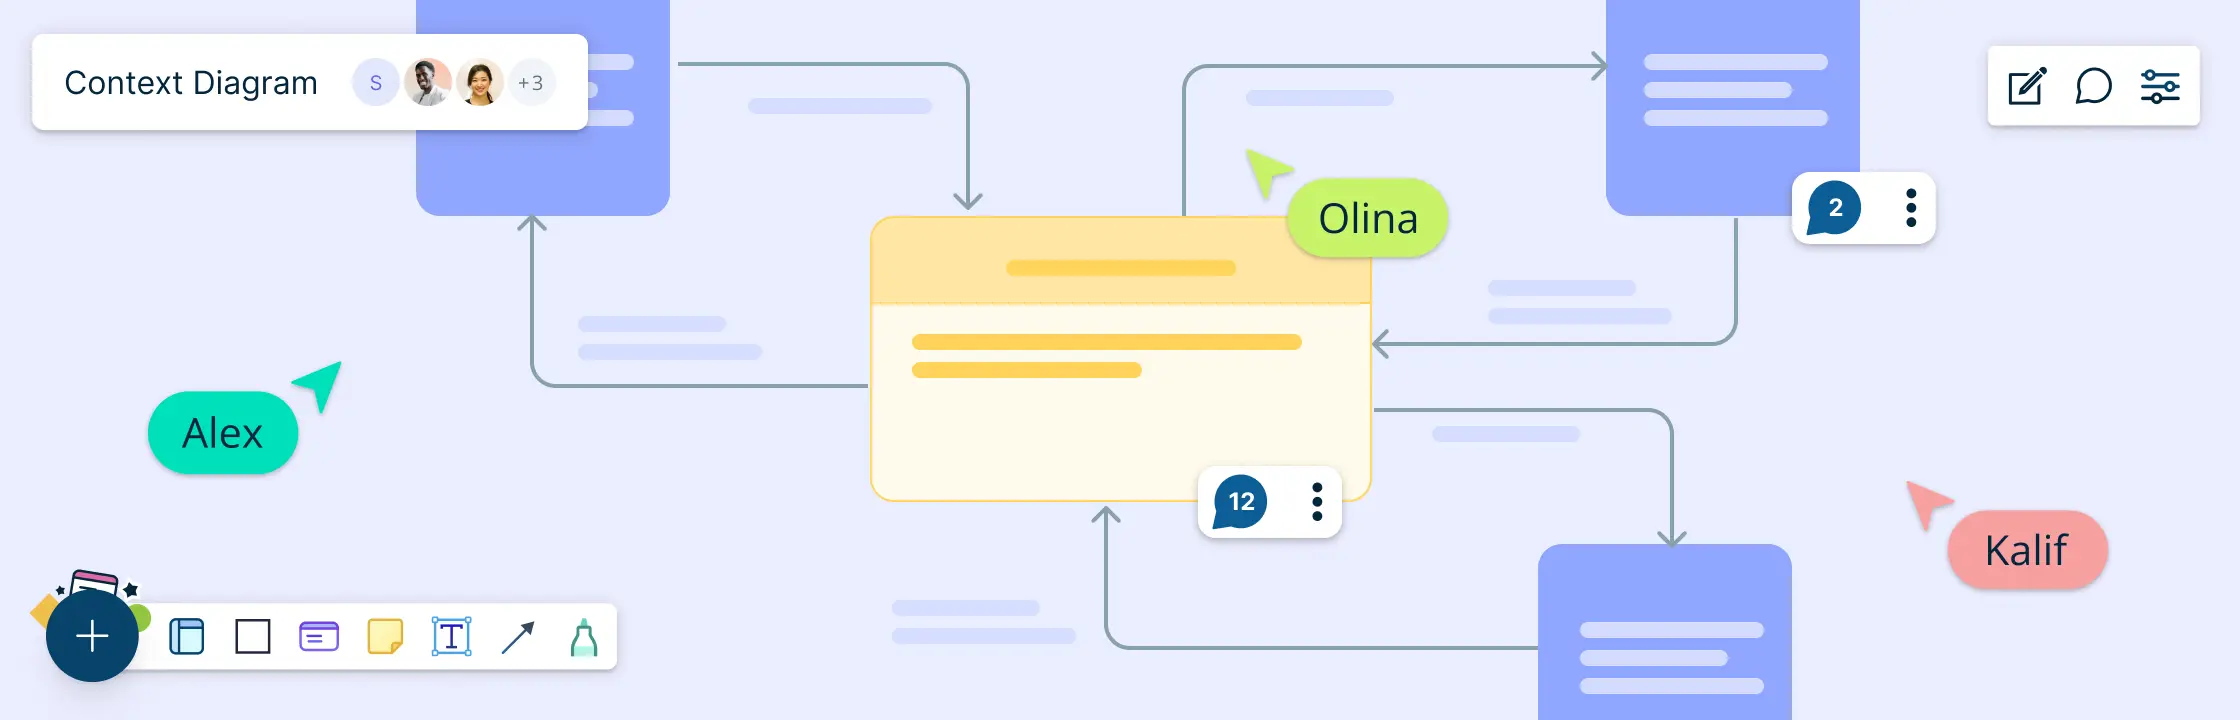
A context diagram stands as a cornerstone in system analysis, offering a bird’s-eye view of a system’s landscape. It’s a high-level representation that encapsulates the system’s scope, illustrating how it interacts with external entities—users, systems, and data flows. Unlike other system representation tools that delve into granular details, the context diagram keeps it simple; it’s the 30,000-foot overview that provides clarity without overwhelming stakeholders with complexity. This guide will take you through everything you need to know about a context diagram and how you can create one.
Activity diagrams can be used in all stages of software development and for various purposes. And because they are a lot similar to flowcharts, they are generally more popular than other UML diagram types.
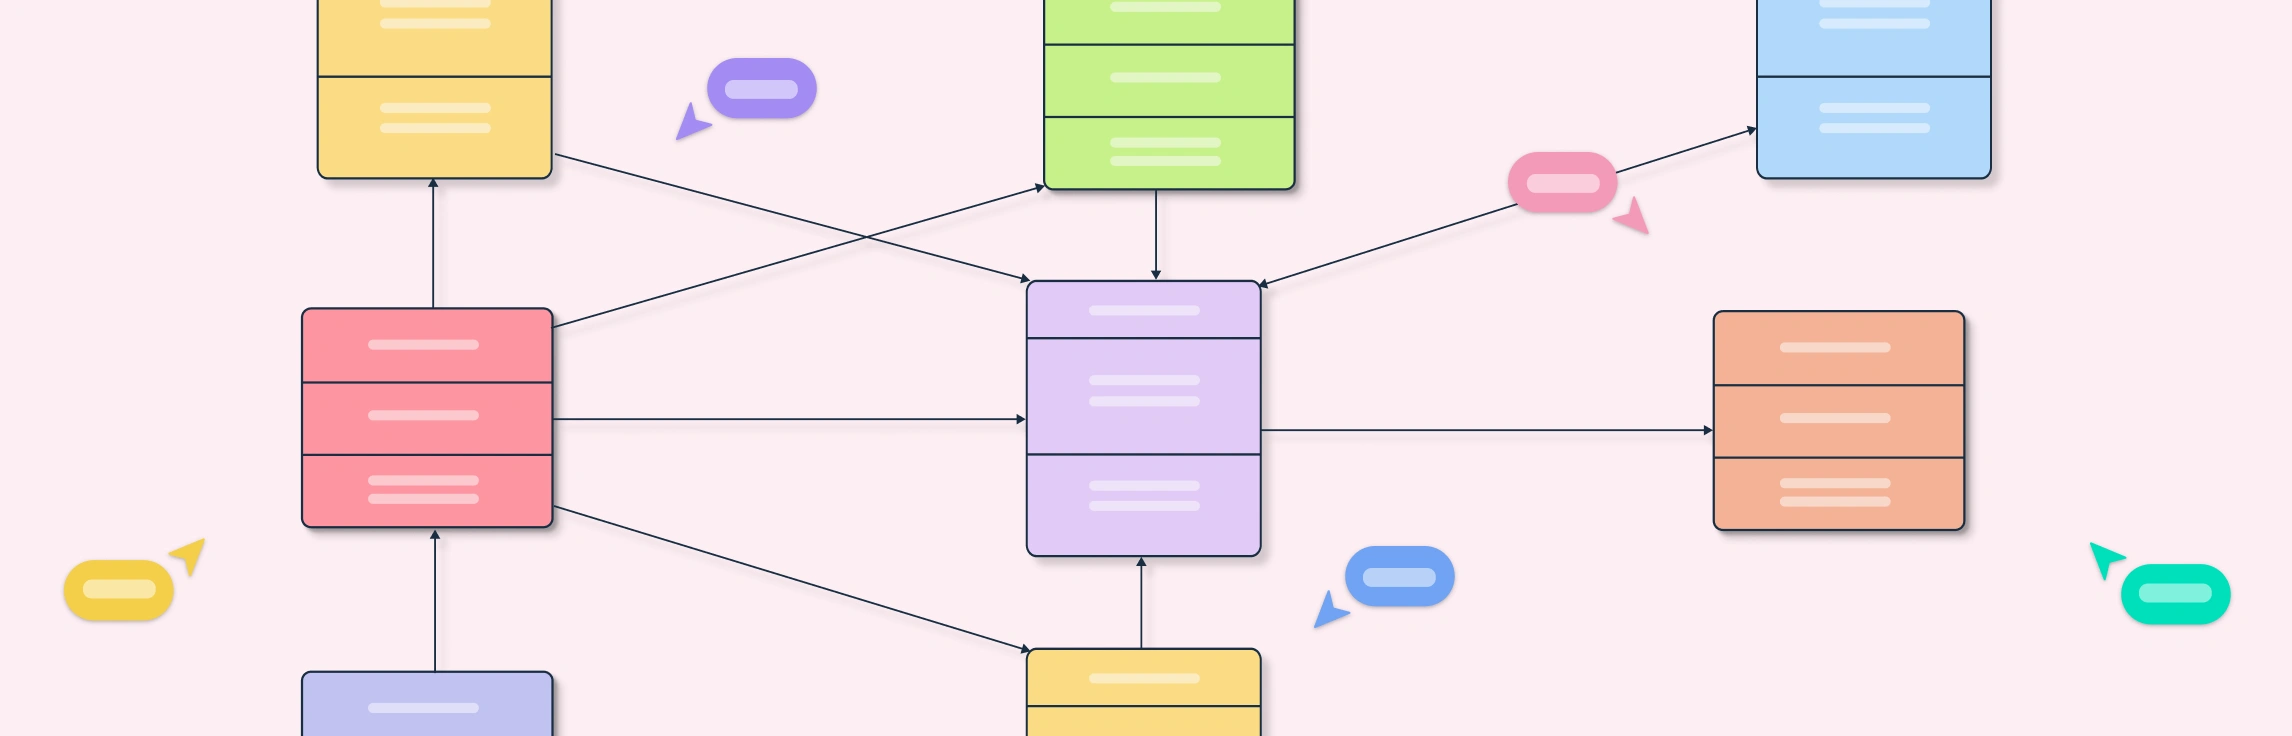
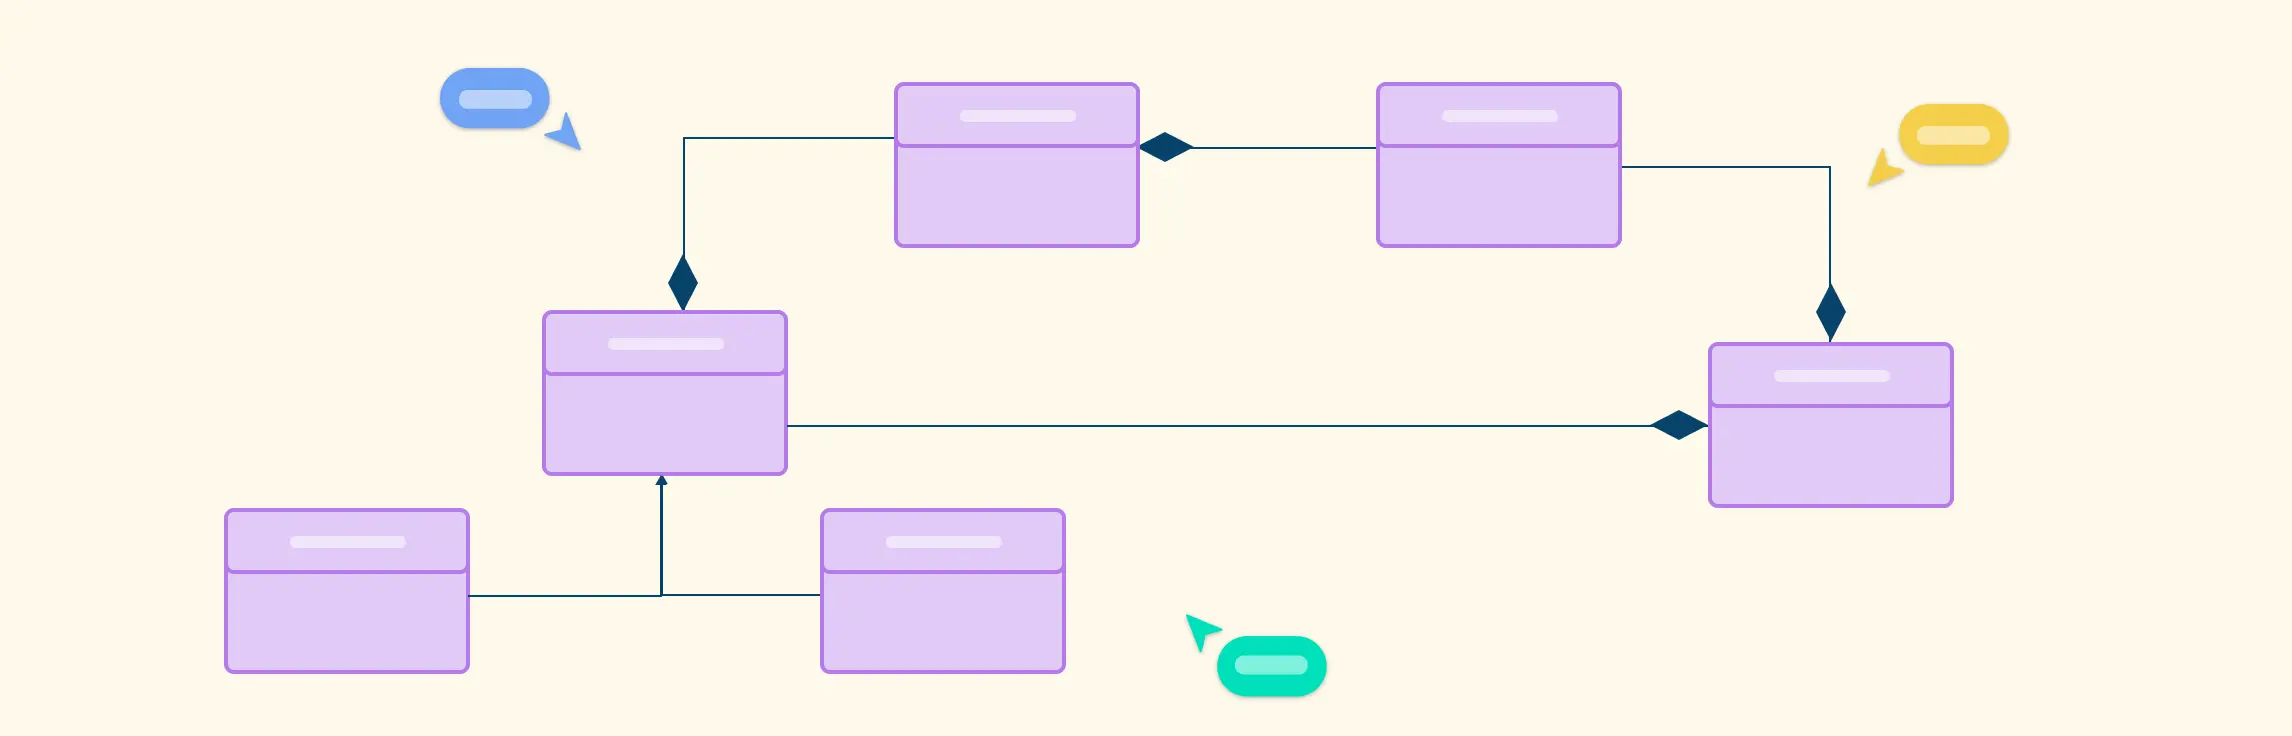
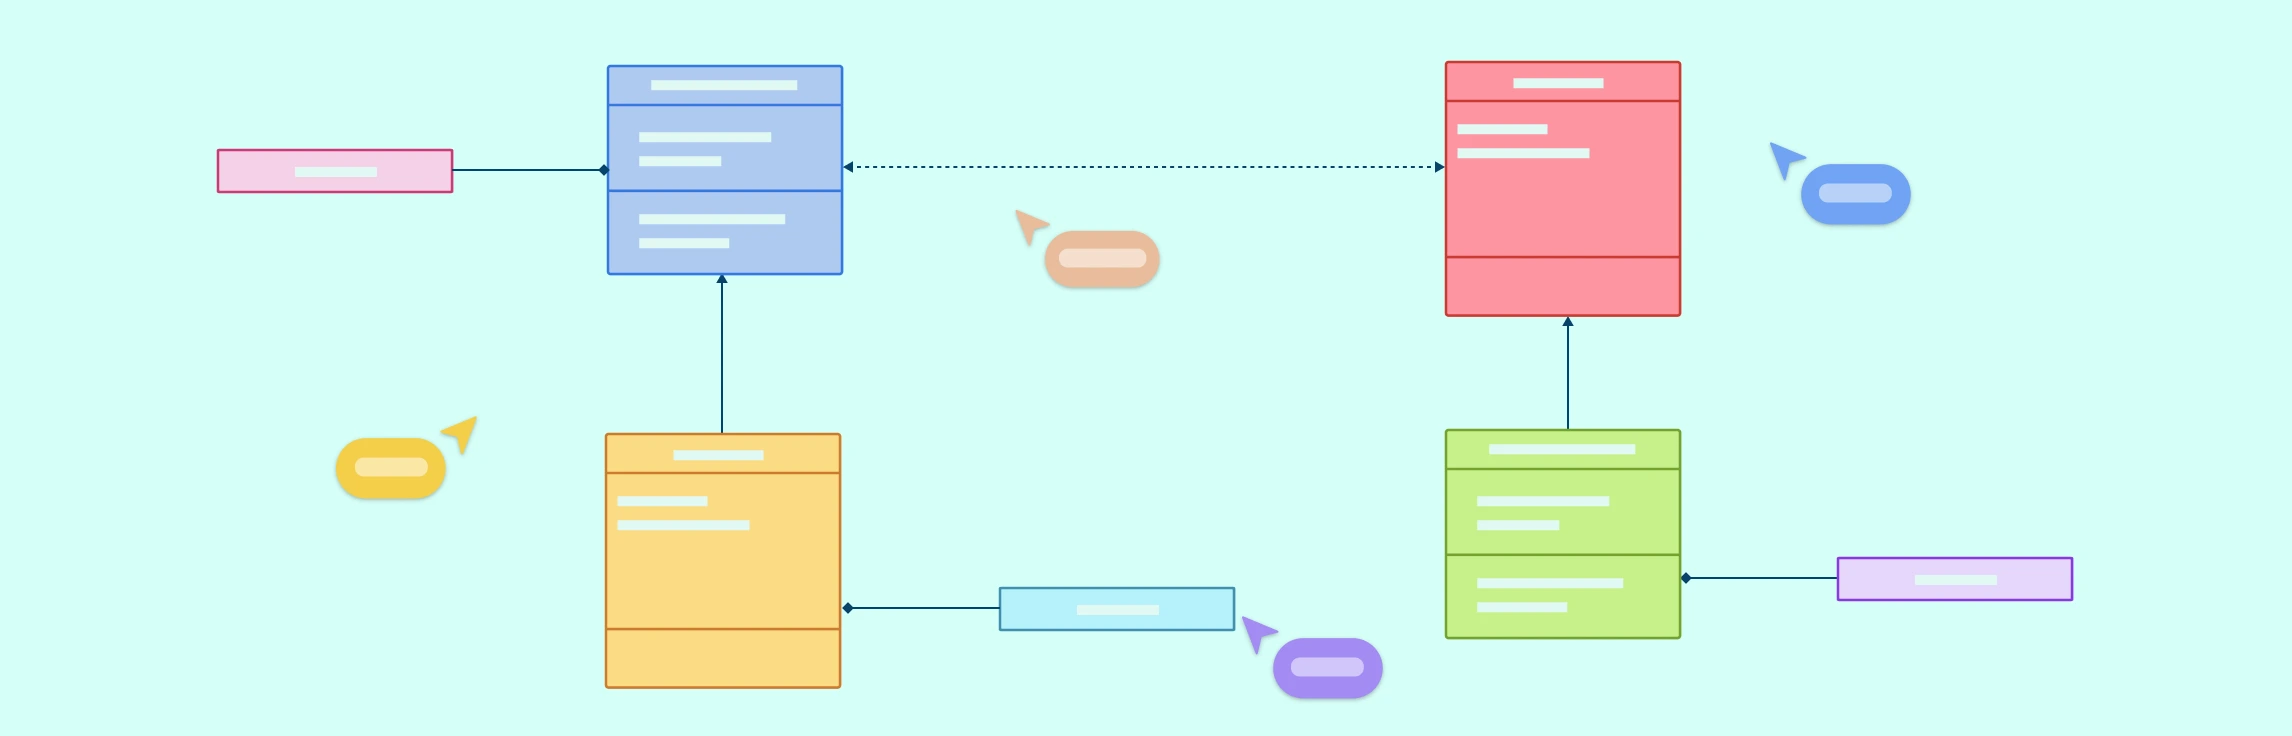
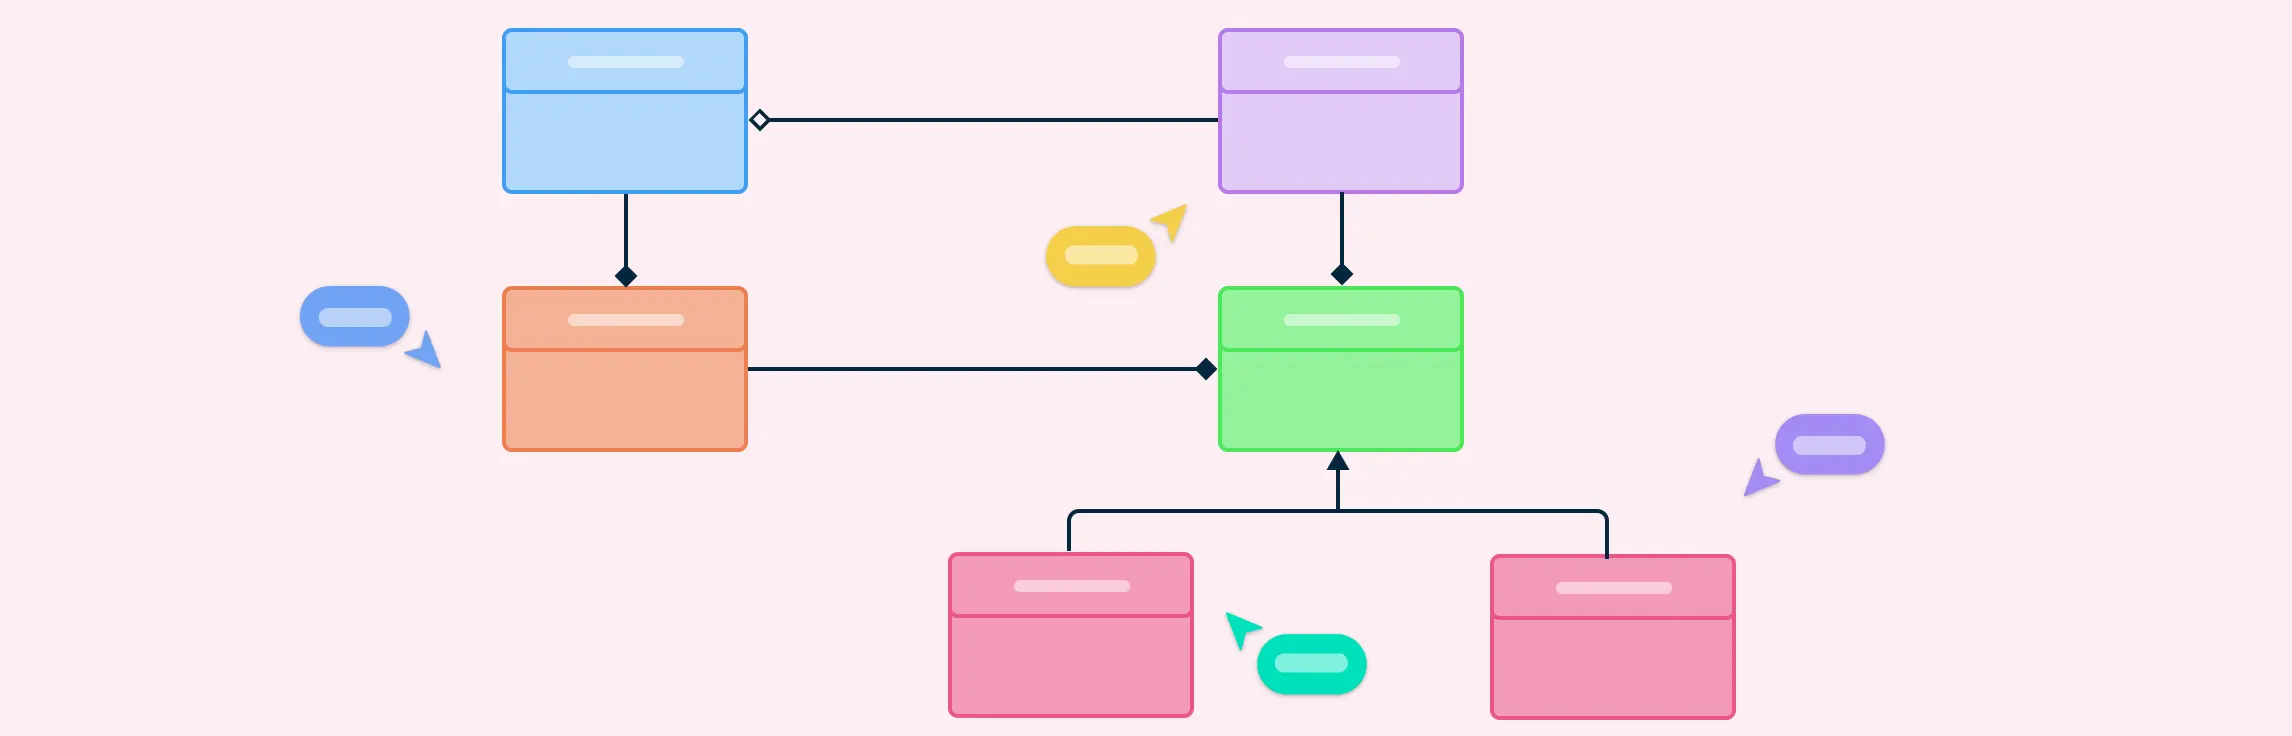
Class diagrams are the main building blocks of object-oriented modeling so it is important that you understand the various class diagram relationships and how they affect your solution. We have listed them below with examples.
UML is a versatile visual language that is used to model a software system. The software industry has been divided in its opinion regarding the use of UML diagrams. While some see it as an integral part of software systems and development, there are a significant number of people that deem it completely unnecessary.